
There were 122,515 Polish nationals living in Ireland in April 2016, the largest non-Irish population group in 2016. The population fell by less than 0.1 per cent between 2011 and 2016, the smallest percentage change of the top ten profiled nationalities.
| Table 2.1 Population Usually Resident by Nationality and Census Year | |||
| 2006 | 2011 | 2016 | |
| Polish | 63,276 | 122,585 | 122,515 |
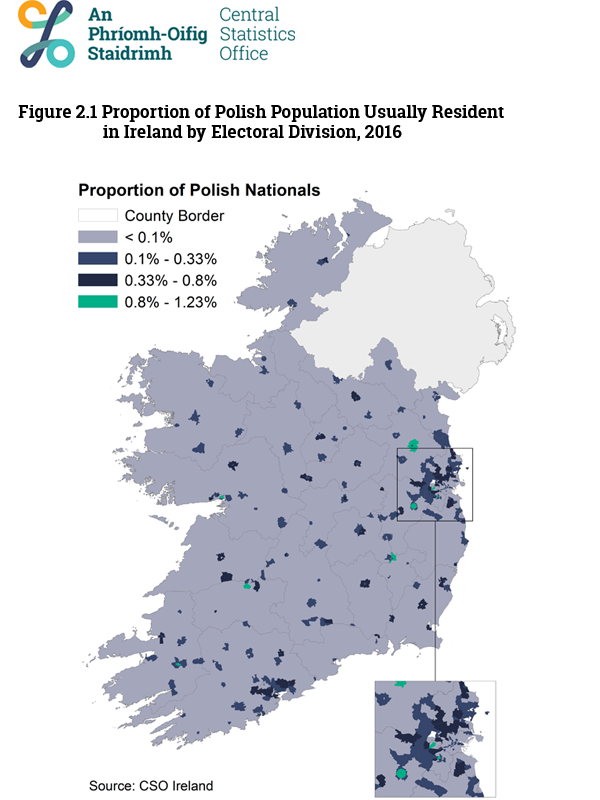
33,751 Polish nationals were living in county Dublin in April 2016, accounting for 28 per cent of the Polish population. As shown in the inset of Figure 2.1 the Electoral Divisions with higher concentrations of Polish nationals were outside of the city. 19,904 Polish nationals were living between Fingal and South Dublin. Areas of high concentration continue to be evident outside county Dublin, with Maynooth, Celbridge, and Donaghmore all being popular areas to live among the Polish population.
More than 1,100 Polish nationals were found to be living in each of the Electoral Divisions of Navan, Naas, Ballybaan, and Ballycummin, coloured in green in Figure 2.1.
It's a Fact
Table 2.2 shows the towns in Ireland where Polish residents accounted for nearly 12 per cent of the total population of the town. The population of Millstreet in county Cork was 17 per cent Polish, making it the town with the highest proportion of Polish nationals.
| Table 2.2 Population Usually Resident in the State by Town of Usual Residence, Nationality, and Statistic, 2016 | |||
| Town population | Polish population | % Polish | |
| Millstreet, Cork | 1,560 | 259 | 17 |
| Ballymahon, Longford | 1,866 | 273 | 15 |
| Bunclody-Carrickduff | 1,955 | 251 | 13 |
| New Ross, Wexford | 8,072 | 987 | 12 |
| Fermoy, Cork | 6,594 | 774 | 12 |
The age breakdown of the Polish and State populations can be seen by clicking an option below:
While the overall size of the Polish population living in Ireland remained relatively stable between 2011 and 2016, the number of female Polish nationals increased by 2 per cent, to 60,655 females whereas the number of Polish males decreased by 2 per cent to 61,860.
It's a Fact
The average age of the Polish population rose by 3.6 years between 2011 and 2016. This was the second fastest ageing profiled population after UK nationals.
| Table 2.3 Population Usually Resident in the State by Nationality, Average Age, and Census Year | |||
| 2006 | 2011 | 2016 | |
| Polish | 28.0 | 27.7 | 31.3 |
| State | 35.5 | 36.1 | 37.3 |
| Retired, unable to work due to permanent sickness or disability or other economic status | Student or pupil | Looking after home/family | Unemployed | Persons at work | |
| State | 704262 | 415555 | 303034 | 294006 | 1970728 |
| Polish | 3344 | 6750 | 5724 | 11417 | 75508 |
There were 102,743 Polish nationals aged 15 years and over living in Ireland in April 2016. Almost three quarters of these Poles were working (75,508 persons, 73%). This figure is 20 percentage points higher than the proportion of the State population at work (53%).
Table 2.4 shows the top three broad industrial groups among the Polish population at work in April 2016. More than one fifth of all Polish nationals were working in the retail industry. Within this industry, 6,746 Polish nationals were working as cashiers and retail assistants, accounting for almost one tenth of all Polish nationals at work (9%).
| Table 2.4 Population Aged 15 Years and Over, at Work, by Nationality and Broad Industrial Group, 2016 | ||
| Polish | State | |
| At Work | 75,508 | 1,970,728 |
| Wholesale and retail trade; repair of motor vehicles and cycles | 22% | 13% |
| Manufacturing | 18% | 10% |
| Accommodation and food service activities | 15% | 6% |
It's a Fact
Table 2.5 shows the top three broad occupational groups where the Polish population were working in April 2016. 23 per cent worked in elementary occupations (17,049 persons), the greatest concentration of Polish nationals in any one occupational group. Within this occupational group, cleaners and domestics were the most common job type (5,708). These Polish nationals accounted for 17 per cent of all persons working in this group.
Skilled trades occupations were also prevalent among Polish nationals. One quarter of all metal workers, 15 per cent of all tailors and dressmakers, and 14 per cent of all butchers in Ireland were Polish nationals in 2016.
| Table 2.5 Population Aged 15 Years and Over, at Work, by Nationality and Broad Occupational Group, 2016 | ||
| Polish | State | |
| At Work | 75,508 | 1,970,728 |
| Elementary Occupations | 23% | 9% |
| Skilled Trades Occupations | 17% | 14% |
| Process, Plant and Machine Operative Occupations & Transport | 15% | 7% |
It's a Fact
| Table 2.6 Polish Population Aged 15 Years and Over who were Married by Census Year | |||
| 2006 | 2011 | 2016 | |
| Married | 21,406 | 49,827 | 53,343 |
In 2006, 47 per cent of married Polish nationals living in Ireland were not living with their spouse, by 2011 this had dramatically reduced to 12 per cent. In April 2016, only 9 per cent of Polish nationals who were married were not living with their spouse.
| 2016 | 2011 | 2006 | |
| Under 25 years | 12.2047244094488 | 7.53275109170306 | 30.2542812662169 |
| 25 - 29 years | 10.132058287796 | 7.54313417938115 | 34.2544068604097 |
| 30 - 34 years | 5.69716050130169 | 7.50093996741446 | 45.3071153456315 |
| 35 - 39 years | 5.81624230109848 | 11.3394118402466 | 58.1314878892734 |
| 40 - 44 years | 9.37671609006041 | 20.3503348789284 | 63.6538461538461 |
| 45 - 49 years | 17.1270718232044 | 28.8129226145755 | 63.3810572687225 |
| 50 - 54 years | 20.9893048128342 | 31.5 | 58.0487804878049 |
| 55 - 59 years | 24.6808510638298 | 31.8345323741007 | 60.9230769230769 |
| 60 - 64 years | 24.1379310344828 | 34.0277777777778 | 62.9032258064516 |
| 65 years and over | 23.2 | 42.5 | 60.7843137254902 |
It's a Fact
Learn about our data and confidentiality safeguards, and the steps we take to produce statistics that can be trusted by all.