Your feedback can help us improve and enhance our services to the public. Tell us what matters to you in our online Customer Satisfaction Survey.
In April 2016, there were 11,531 German nationals who were usually resident in Ireland, a 2 per cent increase on April 2011.
| Table 11.1 Population Usually Resident by Nationality and Census Year | |||
| 2006 | 2011 | 2016 | |
| German | 10,289 | 11,305 | 11,531 |
It's a Fact
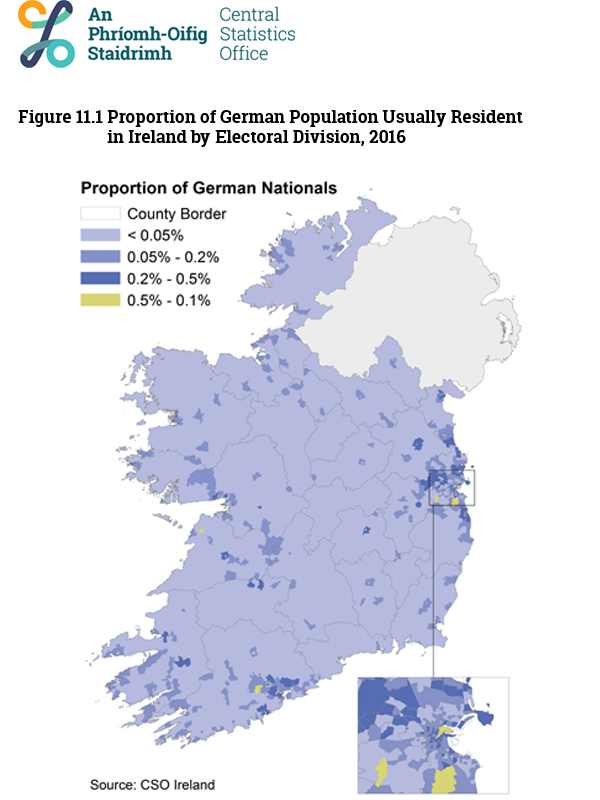
A high proportion of German nationals usually resident in Ireland were living in county Dublin and the surrounding counties (Meath, Kildare, and Wicklow), as shown in Figure 11.1 (over 40% of the German population). High concentrations of German nationals were also found to be living in Lisdoonvarna and the areas surrounding Cork city, highlighted in green in Figure 11.1. Compared with Brazilian, Spanish, Italian, and French nationals living in Ireland, the German population was more spread throughout the country.

In April 2016 there were 6,539 German females living in Ireland. This accounted for 57 per cent of the German population.
While overall, the German population increased between 2011 and 2016, the number of males decreased. In 2011, there were 5,011 German males living in Ireland, as of April 2016, this number had fallen to 4,992.
The age breakdown of the German and State population can be seen by clicking an option below:
The average age of the German population living in Ireland increased by over 4 years between 2006 and 2016, from 36.2 years to 40.5 years.
| Table 11.2 Population Usually Resident in the State by Nationality, Average Age, and Census Year | |||
| 2006 | 2011 | 2016 | |
| German | 36.2 | 37.5 | 40.5 |
| State | 35.5 | 36.1 | 37.3 |
In April 2016, 70 per cent of German nationals, aged 4 years and over, indicated they spoke English very well (7,946 persons), the highest proportion of the nine non-native English speaking nationalities profiled.
| Average of all other nationalities - 2016 | German - 2016 | |
| Not well, not at all, not stated | 22.23 | 14.39 |
| Well | 37.29 | 15.62 |
| Very well | 40.48 | 69.99 |
The proportion of German nationals aged 15 years and over at work (65%, 6,974 Germans) was higher than for the State (53%), in April 2016.
| 0 | Unemployed, unable to work or other economic status | Looking after home/family | Student or pupil | Retired | Persons at work |
|---|---|---|---|---|---|
| German | 902 | 815 | 944 | 1045 | 6974 |
| State | 465884 | 303034 | 415555 | 532384 | 1970728 |
A fifth of the German population was working in the information and communication activities industry (19%), the greatest proportion of German nationals in any one industry. This was also a much larger proportion of the population in this industry than the State population (4%). While German nationals were found to be working in a broad range of occupations within this industry, greater numbers of persons indicated they worked as programmers, financial accountants, sales executives, and IT support technicians and engineers.
| Table 11.3 Population Aged 15 Years and Over, at Work, by Nationality, Broad Industrial Group, and Census Year | |||
| German 2011 | German 2016 | State 2016 | |
| At Work | 6,438 | 6,974 | 1,970,728 |
| Information and communication activities | 17% | 19% | 4% |
| Manufacturing | 14% | 13% | 10% |
| Professional, scientific and technical activities | 7% | 9% | 6% |
Learn about our data and confidentiality safeguards, and the steps we take to produce statistics that can be trusted by all.