Your feedback can help us improve and enhance our services to the public. Tell us what matters to you in our online Customer Satisfaction Survey.
In April 2016, there were 13,640 Brazilian nationals usually resident in Ireland. Since 2006 the Brazilian population in Ireland has more than trebled in size.
| Table 7.1 Population Usually Resident by Nationality and Census Year | |||
| 2006 | 2011 | 2016 | |
| Brazilian | 4,388 | 8,704 | 13,640 |
It's a Fact
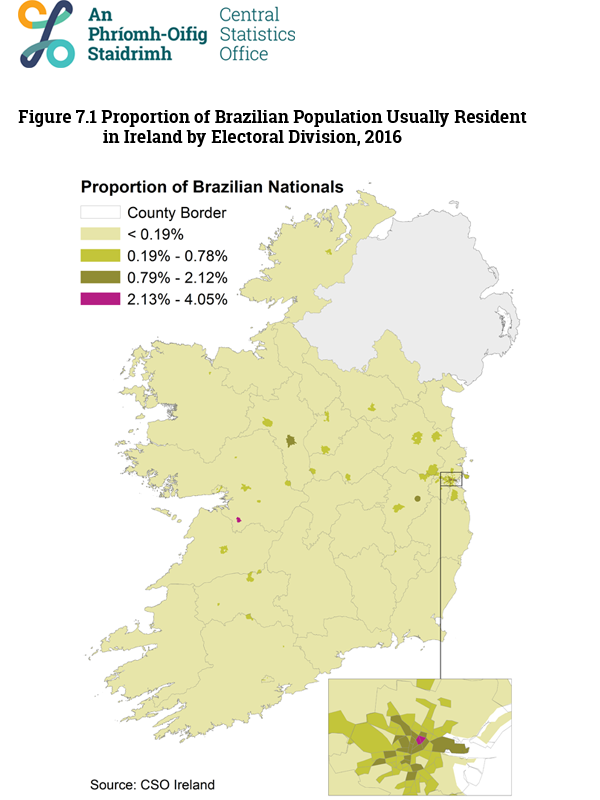
Outside of county Dublin, Electoral Divisions with a relatively high concentration of Brazilian nationals included Gort, Roscommon, and Naas, as highlighted in dark green and pink in Figure 7.1.

It's a Fact
In April 2016, one quarter of the Brazilian population usually resident in Ireland was aged 25 years to 28 years old. Only 10 per cent of the Brazilian population was aged 40 years and over. Comparably, 45 per cent of the State population was aged 40 years and over.
The age breakdown of the Brazilian and State populations can be seen by clicking an option below:
Of all ten nationalities profiled, the Brazilian population was the youngest in 2016 with an average age of 29.9 years. The average age of the Brazilian population grew by 1 year, from 28.8 years to 29.9 years between 2011 and 2016.
| Table 7.2 Population Usually Resident in the State by Nationality, Average Age, and Census Year | |||
| 2006 | 2011 | 2016 | |
| Brazilian | 28.8 | 28.8 | 29.9 |
| State | 35.5 | 36.1 | 37.3 |
| Unable to work due to permanent sickness, retired or other economic status | Student or pupil | Looking after home/family | Unemployed | Persons at work | |
| State - 2016 | 704262 | 415555 | 303034 | 294006 | 1970728 |
| Brazilian - 2016 | 121 | 4207 | 629 | 1562 | 6568 |
| Brazilian - 2011 | 80 | 2270 | 527 | 1107 | 4011 |
While there was a large proportion of Brazilian nationals aged 15 years and over who were students in April 2016 (32%) - much greater than for the State’s population (11%) - the proportion of Brazilian nationals at work (50%) was relatively similar to the proportion of the State’s population (53%).
There were 10,305 Brazilian nationals aged 25 years and over living in Ireland in April 2016, of which 25 per cent (2,626 persons) were students. 60 per cent of these Brazilian students had already attained a third level degree or professional qualification (1,588 Brazilian nationals). Of all students and pupils in the State’s population - aged 25 years and over - 48 per cent had a third level degree or professional qualification.
| Postgraduate degree | Third level degree/professional qualification or both | Upper secondary, technical, vocational | Lower secondary, primary, no formal education, not stated | |
| State | 7807 | 23939 | 13723 | 4916 |
| Brazilian | 463 | 1588 | 377 | 198 |
Table 7.3 shows the top three broad industrial groups among the Brazilian population at work in April 2016. One fifth of the Brazilian population at work was in the accommodation and food services industry (22%), nearly 4 times the proportion of the State population in the same industry (6%). Kitchen and catering assistants, wait staff, and chefs were prevalent occupations among Brazilians within this industry.
| Table 7.3 Population Aged 15 Years and Over, at Work, by Nationality, Broad Industrial Group, and Census Year | |||
| Brazilian 2011 | Brazilian 2016 | State 2016 | |
| At Work | 4,011 | 6,568 | 1,970,728 |
| Accommodation and food service activities | 19% | 22% | 6% |
| Wholesale and retail trade; repair of motor vehicles and cycles | 15% | 12% | 13% |
| Manufacturing | 16% | 9% | 10% |
In April 2016, there were 7,490 permanent private households containing at least one Brazilian national in Ireland, of which 33 per cent were households containing unrelated persons (2,452 households). Compared with all other nationalities profiled, households containing Brazilian nationals were more likely to be comprised of unrelated persons.
Learn about our data and confidentiality safeguards, and the steps we take to produce statistics that can be trusted by all.