
This publication is categorised as a CSO Frontier Series Output. Particular care must be taken when interpreting the statistics in this release as it may use new methods which are under development and/or data sources which may be incomplete, for example new administrative data sources.
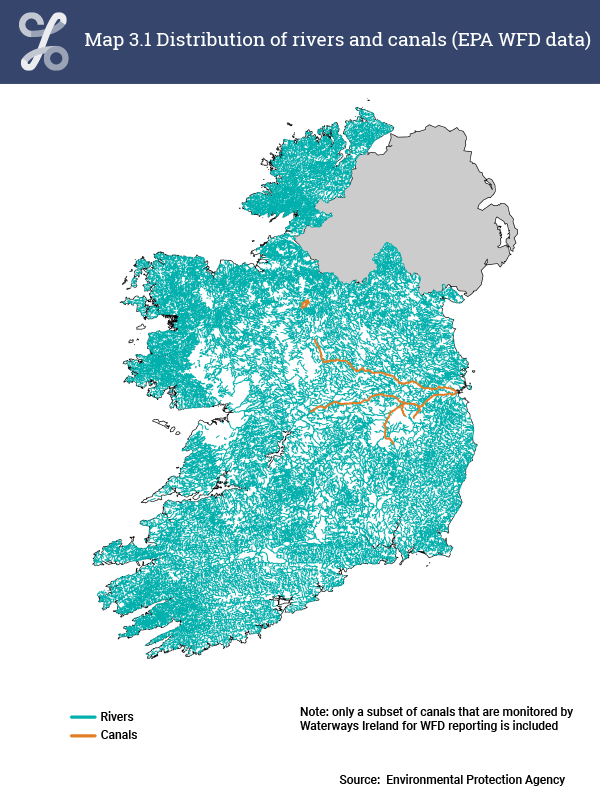
The extent of the river network can be seen in Map 3.1, occurring in almost every part of the country. This map also shows the location of selected canals (note that this is a subset of the canal network and includes just the canals monitored by Waterways Ireland for ecological status). The total length of rivers and canals was more than 74,000km (Table 3.1). Three counties each had more than 10% of the total length of rivers; Cork (7,584km), Donegal (7,867km), and Mayo (7,464km) (Table 3.1, Figure 3.1, Map 3.2). Dublin, Longford, and Louth had the shortest total length of rivers, at less than 900km or around 1% of the total length in each county.
As part of the work done for the implementation of the Water Framework Directive (WFD), the Environmental Protection Agency (EPA) has mapped Ireland's waters, focusing on the length of rivers and not their area. For more information, see Background Notes.
| Table 3.1 Length of rivers and canals by county (based on EPA WFD data) | |||||||
| kilometers | %1 | ||||||
| County | Rivers | Canals | Rivers and Canals | Rivers | Canals | Rivers and Canals | |
| Carlow | 971 | 0 | 971 | 1.3 | 0.0 | 1.3 | |
| Cavan | 2,097 | 0 | 2,097 | 2.8 | 0.0 | 2.8 | |
| Clare | 2,887 | 0 | 2,887 | 3.9 | 0.0 | 3.9 | |
| Cork | 7,584 | 0 | 7,584 | 10.2 | 0.0 | 10.2 | |
| Donegal | 7,867 | 0 | 7,867 | 10.6 | 0.0 | 10.6 | |
| Dublin | 890 | 39 | 929 | 1.2 | 10.4 | 1.2 | |
| Galway | 5,701 | 0 | 5,701 | 7.7 | 0.0 | 7.7 | |
| Kerry | 6,463 | 0 | 6,463 | 8.7 | 0.0 | 8.7 | |
| Kildare | 1,106 | 123 | 1,229 | 1.5 | 32.7 | 1.7 | |
| Kilkenny | 1,512 | 0 | 1,512 | 2.0 | 0.0 | 2.0 | |
| Laois | 1,528 | 13 | 1,541 | 2.1 | 3.5 | 2.1 | |
| Leitrim | 2,115 | 26 | 2,141 | 2.9 | 6.9 | 2.9 | |
| Limerick | 3,027 | 0 | 3,027 | 4.1 | 0.0 | 4.1 | |
| Longford | 818 | 35 | 853 | 1.1 | 9.3 | 1.1 | |
| Louth | 820 | 0 | 820 | 1.1 | 0.0 | 1.1 | |
| Mayo | 7,464 | 0 | 7,464 | 10.1 | 0.0 | 10.0 | |
| Meath | 2,202 | 21 | 2,223 | 3.0 | 5.6 | 3.0 | |
| Monaghan | 1,410 | 0 | 1,410 | 1.9 | 0.0 | 1.9 | |
| Offaly | 1,423 | 71 | 1,494 | 1.9 | 18.9 | 2.0 | |
| Roscommon | 1,872 | 0 | 1,872 | 2.5 | 0.0 | 2.5 | |
| Sligo | 2,425 | 0 | 2,425 | 3.3 | 0.0 | 3.3 | |
| Tipperary | 4,120 | 0 | 4,120 | 5.6 | 0.0 | 5.5 | |
| Waterford | 1,879 | 0 | 1,879 | 2.5 | 0.0 | 2.5 | |
| Westmeath | 1,329 | 47 | 1,376 | 1.8 | 12.5 | 1.8 | |
| Wexford | 2,373 | 0 | 2,373 | 3.2 | 0.0 | 3.2 | |
| Wicklow | 2,200 | 0 | 2,200 | 3.0 | 0.0 | 3.0 | |
| Ireland | 74,083 | 376 | 74,459 | 100.0 | 100.0 | 100.0 | |
| 1 Due to rounding, percentages may not sum to 100 | |||||||
| X-axis label | Rivers |
|---|---|
| Donegal | 7867 |
| Cork | 7584 |
| Mayo | 7464 |
| Kerry | 6463 |
| Galway | 5701 |
| Tipperary | 4120 |
| Limerick | 3027 |
| Clare | 2887 |
| Sligo | 2425 |
| Wexford | 2373 |
| Meath | 2202 |
| Wicklow | 2200 |
| Leitrim | 2115 |
| Cavan | 2097 |
| Waterford | 1879 |
| Roscommon | 1872 |
| Laois | 1528 |
| Kilkenny | 1512 |
| Offaly | 1423 |
| Monaghan | 1410 |
| Westmeath | 1329 |
| Kildare | 1106 |
| Carlow | 971 |
| Dublin | 890 |
| Louth | 820 |
| Longford | 818 |
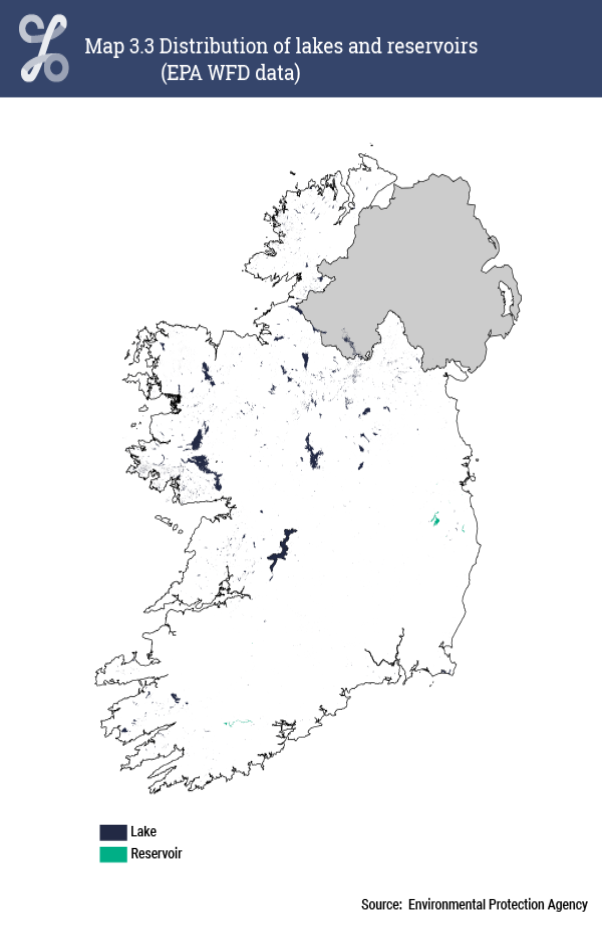
The total area of lakes in Ireland was 125,111 hectares, while reservoirs covered 3,473 hectares (Table 3.2). The distribution of lakes and reservoirs can be seen in Map 3.3, with the majority of lakes occurring in the midlands and west/northwest of the country, while the reservoirs can be seen in the Wicklow and Cork areas. More than 22% of the area covered by lakes occurred in Galway (28,489ha), with almost 18% in Mayo (22,394ha), as shown in Table 3.2, Figure 3.2, and Map 3.4. Carlow, Dublin, Kildare, Kilkenny, Laois, and Louth each had less than 100 hectares of lake ecosystems. Just under two-thirds of the total area of reservoirs was in Wicklow (2,224ha), while about one third was in Cork (1,094ha).
| Table 3.2 Area of lakes and reservoirs by county (based on EPA WFD data) | |||||||
| hectares | %1 | ||||||
| County | Lakes | Reservoirs | Lakes and Reservoirs | Lakes | Reservoirs | Lakes and Reservoirs | |
| Carlow | 10 | 0 | 10 | 0.0 | 0.0 | 0.0 | |
| Cavan | 6,876 | 0 | 6,876 | 5.5 | 0.0 | 5.3 | |
| Clare | 7,990 | 2 | 7,992 | 6.4 | 0.1 | 6.2 | |
| Cork | 1,009 | 1,094 | 2,103 | 0.8 | 31.5 | 1.6 | |
| Donegal | 7,977 | 2 | 7,979 | 6.4 | 0.1 | 6.2 | |
| Dublin | 68 | 53 | 122 | 0.1 | 1.5 | 0.1 | |
| Galway | 28,498 | <1 | 28,499 | 22.8 | 0.0 | 22.2 | |
| Kerry | 6,423 | 1 | 6,424 | 5.1 | 0.0 | 5.0 | |
| Kildare | 73 | 57 | 130 | 0.1 | 1.6 | 0.1 | |
| Kilkenny | 36 | 2 | 38 | 0.0 | 0.1 | 0.0 | |
| Laois | 53 | 0 | 53 | 0.0 | 0.0 | 0.0 | |
| Leitrim | 8,367 | 0 | 8,367 | 6.7 | 0.0 | 6.5 | |
| Limerick | 306 | 23 | 329 | 0.2 | 0.7 | 0.3 | |
| Longford | 4,671 | 1 | 4,672 | 3.7 | 0.0 | 3.6 | |
| Louth | 93 | 8 | 101 | 0.1 | 0.2 | 0.1 | |
| Mayo | 22,394 | 1 | 22,396 | 17.9 | 0.0 | 17.4 | |
| Meath | 782 | 0 | 782 | 0.6 | 0.0 | 0.6 | |
| Monaghan | 2,092 | 0 | 2,092 | 1.7 | 0.0 | 1.6 | |
| Offaly | 146 | 0 | 146 | 0.1 | 0.0 | 0.1 | |
| Roscommon | 9,161 | <1 | 9,162 | 7.3 | 0.0 | 7.1 | |
| Sligo | 4,284 | 5 | 4,289 | 3.4 | 0.1 | 3.3 | |
| Tipperary | 5,239 | <1 | 5,239 | 4.2 | 0.0 | 4.1 | |
| Waterford | 172 | 0 | 172 | 0.1 | 0.0 | 0.1 | |
| Westmeath | 7,383 | 0 | 7,383 | 5.9 | 0.0 | 5.7 | |
| Wexford | 703 | 0 | 703 | 0.6 | 0.0 | 0.5 | |
| Wicklow | 304 | 2,224 | 2,527 | 0.2 | 64.0 | 2.0 | |
| Ireland | 125,111 | 3,473 | 128,584 | 100.0 | 100.0 | 100.0 | |
| 1 Due to rounding, percentages may not sum to 100 | |||||||
| X-axis label | Lakes | Reservoirs |
|---|---|---|
| Galway | 28498 | 0.5 |
| Mayo | 22394 | 1 |
| Roscommon | 9161 | 0.5 |
| Leitrim | 8367 | 0 |
| Clare | 7990 | 2 |
| Donegal | 7977 | 2 |
| Westmeath | 7383 | 0 |
| Cavan | 6876 | 0 |
| Kerry | 6423 | 1 |
| Tipperary | 5239 | 0.5 |
| Longford | 4671 | 1 |
| Sligo | 4284 | 5 |
| Wicklow | 304 | 2224 |
| Cork | 1009 | 1094 |
| Monaghan | 2092 | 0 |
| Meath | 782 | 0 |
| Wexford | 703 | 0 |
| Limerick | 306 | 23 |
| Waterford | 172 | 0 |
| Offaly | 146 | 0 |
| Kildare | 73 | 57 |
| Dublin | 68 | 53 |
| Louth | 93 | 8 |
| Laois | 53 | 0 |
| Kilkenny | 36 | 2 |
| Carlow | 10 | 0 |
Learn about our data and confidentiality safeguards, and the steps we take to produce statistics that can be trusted by all.