
Intermediate Consumption at market prices includes all goods and services used up in the production process in the accounting period, regardless of the date of purchase. For more information see the Background Notes.
When examined by A21 sector and similar to Output, the three largest sectors by Intermediate Consumption in 2018 were Manufacturing (C), Information & Communication (J) and Financial & Insurance activities (K). Construction (F), the third largest sector by Intermediate Consumption in 1995 increased to the second largest in 2005. Construction Intermediate Consumption then declined following 2005, but not as precipitously as Output, declining to fifth biggest by rank in 2010 where it remained in 2018. Agriculture, Forestry and Fishing (A) declined from the fifth biggest sector by Intermediate Consumption in 1995 to the twelfth biggest in 2005 before recovering to the ninth largest in 2018.
Figure 3.1 Proportional composition of Intermediate Consumption by A21 sector, 1995-2018
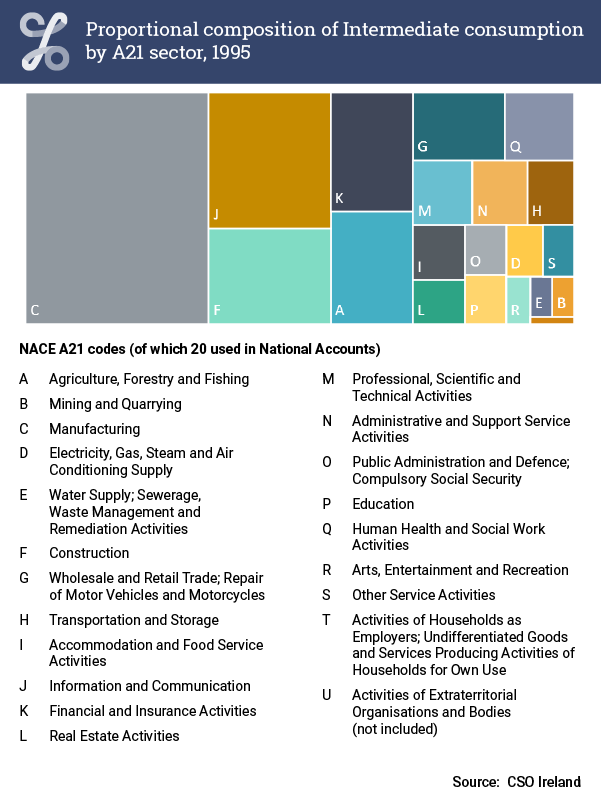
Proportional composition of Intermediate Consumption by A21 sector, 1995

Proportional composition of Intermediate Consumption by A21 sector, 2005

Proportional composition of Intermediate Consumption by A21 sector, 2010
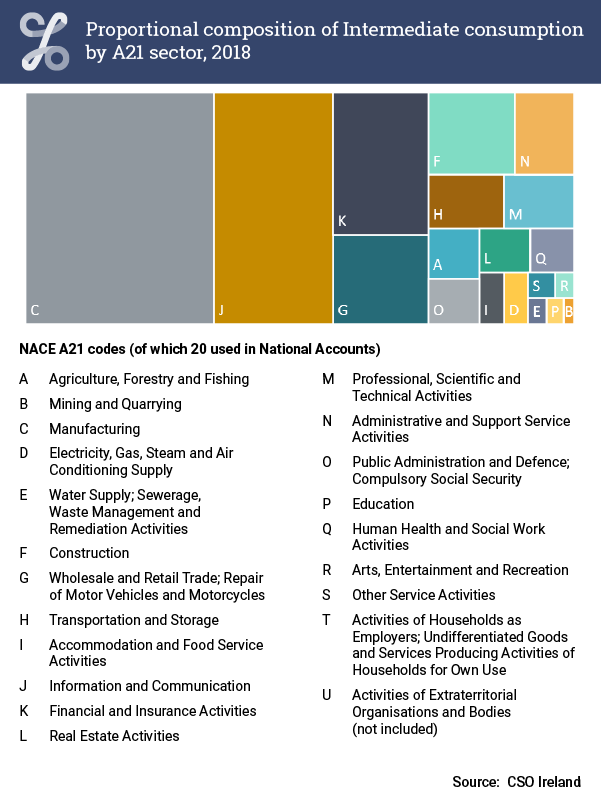
Proportional composition of Intermediate Consumption by A21 sector, 2018
| GEO/TIME | Greece | France | Germany | Luxembourg | Ireland | United Kingdom |
|---|---|---|---|---|---|---|
| 1995 | 45.9134106149265 | 47.0747982125118 | 46.3263121612543 | 50.0990866649066 | 56.6539014752706 | 46.2163911681965 |
| 1996 | 45.6022285625834 | 46.9580441260888 | 46.4194085101789 | 50.6539792058394 | 56.5060936029274 | 46.1664789350684 |
| 1997 | 44.4810722677512 | 47.2361291395449 | 46.8243567947437 | 53.4239743513626 | 56.856423120285 | 46.5170527871209 |
| 1998 | 44.0393631030767 | 47.2042910703142 | 47.2121478501705 | 57.0452049634742 | 57.1103132307245 | 46.9446960595889 |
| 1999 | 43.9554701980839 | 47.8596238910862 | 48.1883406820338 | 58.4480525683262 | 56.9331418458114 | 46.9831714673123 |
| 2000 | 45.4825107487113 | 49.1683341119642 | 49.4955018067395 | 62.5749611581408 | 56.7301837072324 | 46.9235442733536 |
| 2001 | 45.5538488002341 | 49.349121304612 | 49.42453143804 | 62.6378993435449 | 57.1206824889555 | 47.0264706062994 |
| 2002 | 45.599385687458 | 48.7994421071624 | 48.6038295109782 | 61.4200077371558 | 55.8061496157133 | 46.8917642644016 |
| 2003 | 44.0839485907893 | 48.3159620659221 | 49.2461239782934 | 61.2602688141852 | 56.0659970531173 | 46.4900500653211 |
| 2004 | 43.9469595044251 | 48.4692819172632 | 49.5713870271074 | 63.6510760838391 | 56.5459052379869 | 46.8852626601705 |
| 2005 | 44.3790215998032 | 49.0099267724519 | 50.6290704947308 | 65.8083780897299 | 56.6956788139047 | 46.3243965020623 |
| 2006 | 45.4615903136295 | 49.6141260238428 | 51.3036522763118 | 67.831619886166 | 57.9395565326881 | 47.2011008706811 |
| 2007 | 45.6620582708907 | 49.6750052996114 | 51.9580601471588 | 69.1745029796671 | 58.26887062482 | 47.678371552777 |
| 2008 | 44.6677121422675 | 49.7575742459524 | 52.6964369537335 | 69.3430997146094 | 60.2767471822248 | 47.7568958686652 |
| 2009 | 43.4851317486141 | 48.2826811267647 | 51.3289879014636 | 66.815355325501 | 59.0686234955022 | 47.7835949543937 |
| 2010 | 43.7041586337211 | 49.2358796857114 | 52.1528463308592 | 68.7108909948093 | 56.9999595851001 | 48.0744676438849 |
| 2011 | 43.7268163269978 | 49.8391042261088 | 53.1379523053808 | 68.8146473131593 | 53.267292795575 | 48.4741713749783 |
| 2012 | 44.9387326180992 | 49.8986391355527 | 52.5751968163952 | 70.0032215783297 | 57.4945264430695 | 48.251185447935 |
| 2013 | 45.2136894744796 | 49.5133476621129 | 51.9016838614689 | 71.1922360539286 | 58.0171885092917 | 48.4132690314411 |
| 2014 | 45.2346445070778 | 49.3346463917271 | 51.5291424586087 | 73.7114674849198 | 57.0808924156781 | 47.8573029778111 |
| 2015 | 44.0936576004524 | 48.9298973830111 | 51.049607559904 | 74.8325442786942 | 52.45746712089 | 47.4779933069134 |
| 2016 | 43.9791080480637 | 48.7067580366365 | 50.7816530774777 | 73.6009522001063 | 53.0788600924862 | 46.9869354707053 |
| 2017 | 44.9208776777079 | 49.405426251246 | 51.2186295208678 | 73.9904075167163 | 51.8399650359308 | 48.1857891919329 |
| 2018 | 49.7869048868388 | 51.3317994410842 | 73.5712667956892 | 52.4352453905553 | 48.7518678865663 |
Ireland's Intermediate Consumption as a percentage of Output has remained relatively stable between 1995 and 2018. It was lowest in 2017 at 52% and highest in 2008 at 60%. In 2018, the EU Member State with the highest Intermediate Consumption as a percentage of Ouput was Luxembourg (74%), while Greece (45% in 2017) had the lowest percentage.
| X-axis label | Intermediate Consumption |
|---|---|
| Luxembourg | 7.06129500014864 |
| Malta | 8.7189159870411 |
| Cyprus | 9.94937750600484 |
| United Kingdom | 19.4703225664885 |
| Latvia | 22.3653342243638 |
| Denmark | 23.5288968355963 |
| France | 26.817571863101 |
| Croatia | 27.5978891793817 |
| Sweden | 29.8882578672251 |
| Greece | 30.6665639219825 |
| Netherlands | 32.24384417923 |
| Estonia | 32.9701512973232 |
| Ireland | 34.3716534245288 |
| Romania | 34.584686100362 |
| Belgium | 34.8877238494038 |
| Finland | 36.8240120298702 |
| Austria | 37.0008052810906 |
| Spain | 37.3364842016717 |
| Portugal | 37.6537012344662 |
| Bulgaria | 38.7662789993337 |
| Lithuania | 39.636175627582 |
| Italy | 40.8377575253264 |
| Slovenia | 41.5980303074713 |
| Germany | 41.771411251449 |
| Poland | 42.3295568246834 |
| Czechia | 46.5404781412901 |
| Slovakia | 48.544853054316 |
| Hungary | 51.0573681921941 |
Ireland's manufacturing Intermediate Consumption as a percentage of total Intermediate Consumption was 34% in 2018. This placed Ireland among the middle group of EU Member States. In 2018, the highest reported manufacturing Intermediate Consumption as a percentage of total Intermediate Consumption was in Hungary (51%), while the lowest reported among EU Member States was in Luxembourg (7%).
Go to next chapter Gross Value Added (GVA)
Learn about our data and confidentiality safeguards, and the steps we take to produce statistics that can be trusted by all.