
Consumption of Fixed Capital (CFC) represents the depreciation of the stock of produced fixed assets as a result of normal technical and economic ageing and insurable accidental damage. The Consumption of Fixed Capital is the depreciation of the net stock of produced fixed assets during the year not caused by revaluations because of price changes, new fixed capital formation or discarding of fixed assets. For more information see the Background Notes.
When examined by A21 sector, CFC by Manufacturing (C) activities was the largest in both 1995 and 2018. In 2018 it dominated with over half of all CFC. Information and Communication activities (J) increased from the fourth largest CFC by sector in 1995 to the second biggest in 2018. Agriculture, Forestry and Fishing (A) declined from the third biggest sector by CFC in 1995 to the twelfth largest in 2018.
Figure 7.1 Proportional composition of Consumption of Fixed Capital (CFC) by A21 sector, 1995-2018
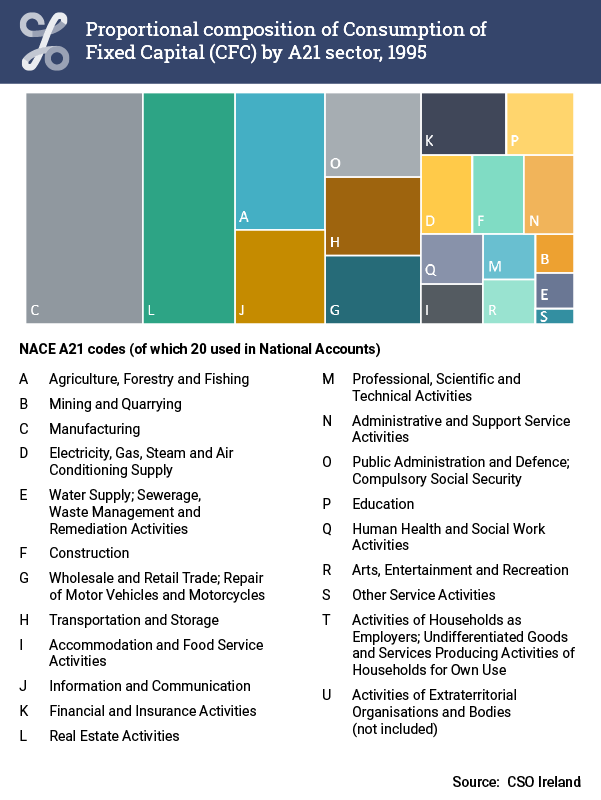
Proportional composition of Consumption of Fixed Capital (CFC) by A21 sector, 1995

Proportional composition of Consumption of Fixed Capital (CFC) by A21 sector, 2005
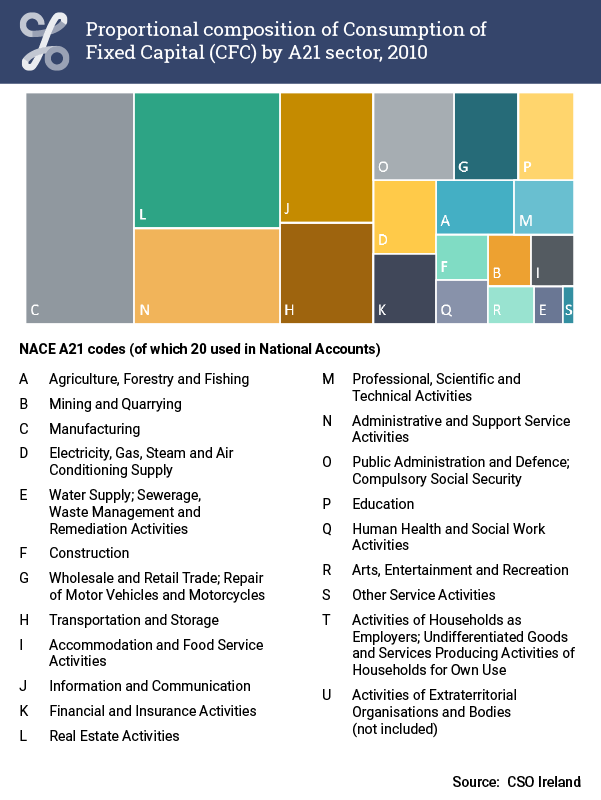
Proportional composition of Consumption of Fixed Capital (CFC) by A21 sector, 2010
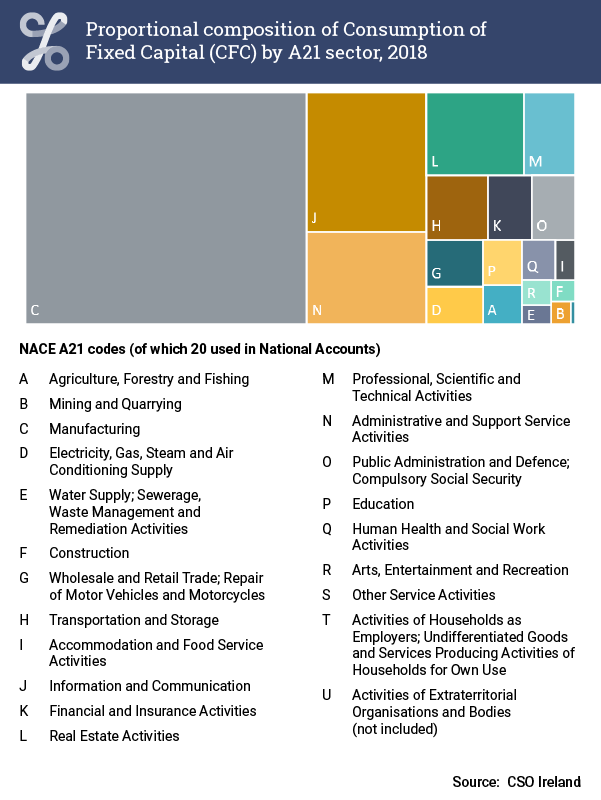
Proportional composition of Consumption of Fixed Capital (CFC) by A21 sector, 2018
| GEO/TIME | Ireland | France | Germany | Netherlands | United Kingdom | Luxembourg |
|---|---|---|---|---|---|---|
| 1995 | 5.55513126144458 | 9.13950825733419 | 9.67111947819407 | 8.82464613121573 | 8.29349203389901 | 6.80673588808721 |
| 1996 | 5.60787084565307 | 9.17663132912158 | 9.75589001937143 | 8.64162035507549 | 8.03469262920939 | 6.72782098884827 |
| 1997 | 5.38693823675093 | 9.05465722321135 | 9.72192535651304 | 8.34909470345543 | 7.74815063855201 | 6.46529715608858 |
| 1998 | 5.27370847624206 | 8.91709330391305 | 9.63122452157689 | 8.24286255638033 | 7.59930686818658 | 6.11495143158777 |
| 1999 | 5.49243533635139 | 8.8428549347161 | 9.53465982028241 | 8.25199794849156 | 7.7198162055313 | 5.45431927083218 |
| 2000 | 5.5729197540511 | 8.66560558253404 | 9.4590722438226 | 8.17534718321269 | 7.78207916830607 | 5.00479170599254 |
| 2001 | 5.55028479882561 | 8.72803261529904 | 9.47578785153421 | 8.32842573011752 | 7.89827933486312 | 5.36140043763676 |
| 2002 | 5.73468603421581 | 8.92095133902873 | 9.7170672660354 | 8.65949524203558 | 7.95736840285754 | 5.72155824948562 |
| 2003 | 5.97661010105013 | 9.09582755395271 | 9.65189081018889 | 8.88075261051848 | 7.96750366184026 | 5.69520739123398 |
| 2004 | 6.20638170357912 | 9.124799155976 | 9.51387450283011 | 8.86938056764036 | 7.85445639283294 | 5.21565574682033 |
| 2005 | 6.56287441162331 | 9.18880671052132 | 9.37806681109851 | 8.72847832191258 | 7.90737176201526 | 4.84869154049615 |
| 2006 | 6.86161395029703 | 9.26986814716232 | 9.09824847688243 | 8.60116348823258 | 7.80696439232904 | 4.18776666581843 |
| 2007 | 6.46898607328229 | 9.29574950946103 | 9.0464171958697 | 8.50394816481183 | 7.76566441800723 | 3.83794835120145 |
| 2008 | 6.11014189981993 | 9.58397941433884 | 9.10992436563661 | 8.523108128649 | 8.02217406894587 | 4.00685152519038 |
| 2009 | 6.47984373772813 | 10.2206691735433 | 10.0322922097624 | 9.21350102660525 | 8.4830819085389 | 4.72795884255193 |
| 2010 | 6.74759255789293 | 9.9985090886296 | 9.58782100221775 | 9.18444940233445 | 8.33078941087141 | 4.20574139894107 |
| 2011 | 7.12377275304317 | 9.96232333551768 | 9.26619324628874 | 8.73365530555608 | 8.3111218861515 | 4.09315250667957 |
| 2012 | 6.74661007102274 | 10.0591708072161 | 9.52658091171867 | 8.69205078073108 | 8.39323380906094 | 4.11707048097479 |
| 2013 | 6.77034808670176 | 10.1388339689869 | 9.70082147658771 | 8.81378716285416 | 8.31004974739585 | 3.76348822609233 |
| 2014 | 6.89385487213333 | 10.1886198217486 | 9.65318249710736 | 8.77695456575694 | 8.31500156037175 | 3.39341343355434 |
| 2015 | 10.9543298646917 | 10.1733402448967 | 9.71805511759555 | 8.64484306004529 | 8.41403028426427 | 3.30301195669149 |
| 2016 | 11.7770517821723 | 10.2844389940535 | 9.72023817621956 | 8.66843203361745 | 8.51084820405814 | 3.43400954109598 |
| 2017 | 12.6938436104848 | 10.2296982167862 | 9.68774079133799 | 8.48714056905183 | 8.42377161077996 | 3.48631067447306 |
| 2018 | 12.4403019964491 | 10.3073338963998 | 9.83492482328492 | 8.45145531774725 | 8.41656906367453 | 3.53376537407619 |
Ireland's CFC as a percentage of Output (and GVA) showed a marked increase following the 2015 national accounts 'level shift' from 7% in 2014 to 11% in 2015. Ireland reported the highest percentage (12%) among EU Member States for 2018, while the lowest percentage (4%) was reported by Luxembourg.
| X-axis label | Consumption of Fixed Capital (CFC) |
|---|---|
| Cyprus | 5.83411234809212 |
| Greece | 6.74150057024928 |
| Luxembourg | 7.85608186169335 |
| Latvia | 9.298374947915 |
| United Kingdom | 9.7100848513938 |
| Portugal | 10.2209898091324 |
| Malta | 11.5520860666492 |
| Croatia | 11.70764814841 |
| Netherlands | 11.8771658245653 |
| Estonia | 13.146124523507 |
| Lithuania | 13.1499466478578 |
| France | 13.9195914335241 |
| Belgium | 16.530491646921 |
| Denmark | 16.7070010023681 |
| Finland | 18.1321771736583 |
| Sweden | 18.6695890823908 |
| Bulgaria | 18.6860243814619 |
| Germany | 19.0608002549566 |
| Austria | 19.1467335827285 |
| Italy | 20.2735669504542 |
| Romania | 20.7204422249513 |
| Slovakia | 21.2379574829481 |
| Poland | 22.7382929259382 |
| Czechia | 23.0009821763873 |
| Slovenia | 23.6491705382567 |
| Hungary | 23.8943590081338 |
| Ireland | 51.2211122030482 |
Ireland's manufacturing CFC as a percentage of total CFC was the highest of reporting EU Member States for 2018 at 51%. This was much higher than the second highest figure of 24% reported by Hungary. The EU Member State with the lowest reported percentage for 2018 was Cyprus at 6%.
Learn about our data and confidentiality safeguards, and the steps we take to produce statistics that can be trusted by all.