
| 3.7 Deaths and death rates, 1916 and 20141 | ||||
| per 1,000 population | per 1,000 population | |||
| Area | 1916 | 2014 | ||
| Total deaths | Death rate | Total deaths | Death rate | |
| Ireland | 50,627 | 16.1 | 29,095 | 6.3 |
| Leinster | 20,977 | 18.1 | 14,561 | 5.8 |
| Carlow | 579 | 16.0 | 363 | 6.6 |
| Dublin City | 7,241 | 23.8 | 4,035 | 7.8 |
| Dublin County | 2,600 | 15.1 | 3,577 | 4.7 |
| Kildare | 1,023 | 15.4 | 926 | 4.4 |
| Kilkenny | 1,205 | 16.1 | 555 | 5.8 |
| Laois | 907 | 16.6 | 436 | 5.3 |
| Longford | 748 | 17.1 | 255 | 6.4 |
| Louth | 1,094 | 17.2 | 724 | 5.8 |
| Meath | 1,051 | 16.1 | 877 | 4.7 |
| Offaly | 859 | 15.1 | 444 | 5.7 |
| Westmeath | 917 | 15.3 | 600 | 6.9 |
| Wexford | 1,835 | 17.9 | 994 | 6.8 |
| Wicklow | 918 | 15.1 | 775 | 5.6 |
| Munster | 15,911 | 15.4 | 8,734 | 7.0 |
| Clare | 1,327 | 12.7 | 797 | 6.8 |
| Cork | 6,242 | 15.9 | 3,378 | 6.5 |
| Kerry | 2,003 | 12.5 | 1,151 | 8.0 |
| Limerick | 2,506 | 17.5 | 1,401 | 7.3 |
| Tipperary North | 972 | 15.5 | 560 | 7.8 |
| Tipperary South | 1,464 | 16.3 | 623 | 7.0 |
| Waterford | 1,397 | 16.6 | 824 | 7.2 |
| Connacht | 8,240 | 13.5 | 3,785 | 7.0 |
| Galway | 2,575 | 14.1 | 1,502 | 6.1 |
| Leitrim | 818 | 12.9 | 240 | 7.4 |
| Mayo | 2,442 | 12.7 | 1,065 | 8.1 |
| Roscommon | 1,220 | 13.0 | 490 | 7.6 |
| Sligo | 1,185 | 15.0 | 488 | 7.5 |
| Ulster (part of) | 5,499 | 16.6 | 2,015 | 6.8 |
| Cavan | 1,470 | 16.1 | 502 | 6.8 |
| Donegal | 2,767 | 16.4 | 1,083 | 6.7 |
| Monaghan | 1,262 | 17.7 | 430 | 7.0 |
| Source: Registrar-General Annual Report for 1916, Vital Statistics CSO | ||||
| 1 Data for 2014 is provisional. | ||||
| 3.8 Deaths by cause, 1916 | |||||||||
| Area | Infectious diseases & influenza | TB | Cancer | Heart diseases | Pregnancy related | Violent deaths | Bronchitis & pneumonia | Other | Total deaths |
| Ireland | 2,092 | 6,471 | 2,679 | 5,373 | 372 | 1,616 | 6,708 | 25,316 | 50,627 |
| Leinster | 834 | 2,941 | 1,196 | 2,236 | 118 | 935 | 2,987 | 9,730 | 20,977 |
| Carlow | 30 | 76 | 28 | 81 | 7 | 14 | 57 | 286 | 579 |
| Dublin City | 299 | 1,067 | 388 | 635 | 39 | 539 | 1,328 | 2,946 | 7,241 |
| Dublin County | 111 | 577 | 189 | 316 | 7 | 97 | 340 | 963 | 2,600 |
| Kildare | 30 | 134 | 67 | 132 | 4 | 31 | 124 | 501 | 1,023 |
| Kilkenny | 68 | 133 | 58 | 134 | 14 | 28 | 138 | 632 | 1,205 |
| Laois | 28 | 107 | 32 | 95 | 6 | 25 | 96 | 518 | 907 |
| Longford | 45 | 58 | 25 | 40 | 3 | 25 | 82 | 470 | 748 |
| Louth | 32 | 104 | 84 | 107 | 7 | 34 | 136 | 590 | 1,094 |
| Meath | 26 | 134 | 62 | 157 | 3 | 32 | 124 | 513 | 1,051 |
| Offaly | 34 | 115 | 50 | 71 | 9 | 22 | 97 | 461 | 859 |
| Westmeath | 23 | 105 | 59 | 102 | 4 | 24 | 119 | 481 | 917 |
| Wexford | 54 | 230 | 98 | 245 | 13 | 36 | 244 | 915 | 1,835 |
| Wicklow | 54 | 101 | 56 | 121 | 2 | 28 | 102 | 454 | 918 |
| Munster | 563 | 2,125 | 813 | 1,947 | 120 | 396 | 1,987 | 7,960 | 15,911 |
| Clare | 30 | 158 | 58 | 135 | 9 | 19 | 146 | 772 | 1,327 |
| Cork | 204 | 911 | 358 | 849 | 47 | 173 | 821 | 2,879 | 6,242 |
| Kerry | 45 | 280 | 79 | 194 | 20 | 44 | 230 | 1,111 | 2,003 |
| Limerick | 127 | 312 | 97 | 270 | 27 | 51 | 345 | 1,277 | 2,506 |
| Tipperary North | 40 | 104 | 53 | 113 | 5 | 27 | 108 | 522 | 972 |
| Tipperary South | 46 | 183 | 85 | 232 | 4 | 42 | 171 | 701 | 1,464 |
| Waterford | 71 | 177 | 83 | 154 | 8 | 40 | 166 | 698 | 1,397 |
| Connacht | 319 | 914 | 368 | 613 | 85 | 173 | 1,025 | 4,743 | 8,240 |
| Galway | 82 | 335 | 122 | 216 | 31 | 63 | 289 | 1,437 | 2,575 |
| Leitrim | 36 | 70 | 40 | 62 | 5 | 18 | 142 | 445 | 818 |
| Mayo | 106 | 266 | 91 | 158 | 29 | 48 | 335 | 1,409 | 2,442 |
| Roscommon | 27 | 118 | 53 | 101 | 12 | 26 | 144 | 739 | 1,220 |
| Sligo | 68 | 125 | 62 | 76 | 8 | 18 | 115 | 713 | 1,185 |
| Ulster (part of) | 376 | 491 | 302 | 577 | 49 | 112 | 709 | 2,883 | 5,499 |
| Cavan | 70 | 106 | 85 | 186 | 9 | 22 | 209 | 783 | 1,470 |
| Donegal | 243 | 297 | 145 | 241 | 36 | 65 | 316 | 1,424 | 2,767 |
| Monaghan | 63 | 88 | 72 | 150 | 4 | 25 | 184 | 676 | 1,262 |
| Source: Registrar-General Annual Report for 1916 | |||||||||
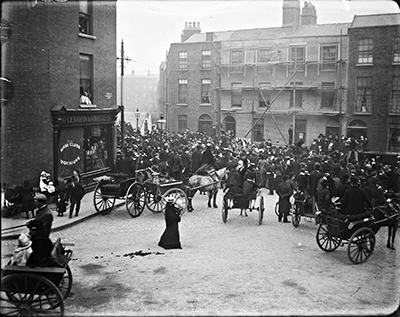
Photo: Funeral procession passing through Berkeley Street Dublin circa 1904
| 3.9 Deaths by cause, 20141 | ||||||
| Area | Malignant Neoplasms | Diseases of the Circulatory system | Diseases of the Respiratory system | External causes | All other causes | Total deaths |
| Ireland | 8,880 | 8,899 | 3,388 | 1,560 | 6,368 | 29,095 |
| Leinster | 4,571 | 4,271 | 1,690 | 773 | 3,256 | 14,561 |
| Carlow | 119 | 108 | 36 | 25 | 75 | 363 |
| Dublin City | 1,226 | 1,198 | 455 | 219 | 937 | 4,035 |
| Dublin County | 1,186 | 955 | 386 | 189 | 861 | 3,577 |
| Kildare | 273 | 293 | 119 | 54 | 187 | 926 |
| Kilkenny | 172 | 166 | 67 | 22 | 128 | 555 |
| Laois | 123 | 152 | 53 | 12 | 96 | 436 |
| Longford | 76 | 69 | 44 | 13 | 53 | 255 |
| Louth | 235 | 188 | 85 | 48 | 168 | 724 |
| Meath | 273 | 263 | 115 | 46 | 180 | 877 |
| Offaly | 136 | 150 | 51 | 21 | 86 | 444 |
| Westmeath | 174 | 206 | 63 | 30 | 127 | 600 |
| Wexford | 333 | 295 | 123 | 59 | 184 | 994 |
| Wicklow | 245 | 228 | 93 | 35 | 174 | 775 |
| Munster | 2,608 | 2,797 | 979 | 472 | 1,878 | 8,734 |
| Clare | 236 | 257 | 105 | 35 | 164 | 797 |
| Cork | 973 | 1,088 | 351 | 208 | 758 | 3,378 |
| Kerry | 323 | 389 | 123 | 56 | 260 | 1,151 |
| Limerick | 409 | 457 | 168 | 82 | 285 | 1,401 |
| Tipperary North | 173 | 185 | 52 | 32 | 118 | 560 |
| Tipperary South | 185 | 183 | 88 | 31 | 136 | 623 |
| Waterford | 309 | 238 | 92 | 28 | 157 | 824 |
| Connacht | 1,132 | 1,170 | 464 | 209 | 810 | 3,785 |
| Galway | 465 | 457 | 176 | 89 | 315 | 1,502 |
| Leitrim | 67 | 78 | 28 | 15 | 52 | 240 |
| Mayo | 313 | 318 | 134 | 57 | 243 | 1,065 |
| Roscommon | 153 | 154 | 59 | 23 | 101 | 490 |
| Sligo | 134 | 163 | 67 | 25 | 99 | 488 |
| Ulster (part of) | 569 | 661 | 255 | 106 | 424 | 2,015 |
| Cavan | 140 | 167 | 52 | 36 | 107 | 502 |
| Donegal | 318 | 353 | 149 | 44 | 219 | 1,083 |
| Monaghan | 111 | 141 | 54 | 26 | 98 | 430 |
| Source: Vital Statistics, CSO | ||||||
| 1 Data is provisional. | ||||||
| 3.10 Cause of death, 1916 and 2014 | ||||
| Cause of death | 1916 | Cause of death | 2014 | |
| Total deaths | 50,627 | Total deaths: | 29,095 | |
| of which: | of which: | |||
| Measles | 218 | Measles | 0 | |
| Scarlet fever | 184 | Scarlet fever | 0 | |
| Whooping cough | 525 | Whooping cough | 0 | |
| Diptheria | 200 | Diptheria | 0 | |
| Influenza | 712 | Influenza | 27 | |
| Tuberculosis | 6,471 | Tuberculosis | 25 | |
| Carcinoma, Sarcoma, Cancer, Malignant Disease | 2,679 | Malignant neoplasms | 8,880 | |
| Diabetes | 239 | Diabetes | 474 | |
| Meningitis and Encephalitis | 446 | Meningitis | 7 | |
| Heart disease | 5,373 | Heart diseases | 5,779 | |
| Bronchitis | 4,164 | Bronchitis | 22 | |
| Pneumonia | 2,544 | Pneumonia | 965 | |
| Accidents of pregnancy and chidbirth, puerperal septic diseases | 372 | Complications of pregnancy, childbirth and puerperium | 2 | |
| Homicide | 24 | Homicide | 31 | |
| Suicide | 68 | Suicide | 459 | |
| Execution | 4 | Execution | 0 | |
| Other violent deaths | 1,520 | Other external causes of injury and poisoning | 1,070 | |
| Source: Registrar-General Annual Report for 1916, Vital Statistics CSO | ||||
| 1 Data for 2014 is provisional. | ||||
This table compares causes of deaths where the classifications are similar in 1916 and 2014 but caution should be exercised in looking at these comparisons given that the classifications systems used for cause of death have radically altered between 1916 and 2014.
However even with this very important caveat some comparisons are possible.
| 3.11 Deaths by age group, 1916 and 2014 | |||||
| number | % | ||||
| Age group | 1916 | 2014 | 1916 | 2014 | |
| Under 1 | 5,271 | 249 | 10.4 | 0.9 | |
| 1-4 | 2,869 | 38 | 5.7 | 0.1 | |
| 5-14 | 1,847 | 56 | 3.6 | 0.2 | |
| 15-24 | 2,724 | 202 | 5.4 | 0.7 | |
| 25-34 | 2,983 | 419 | 5.9 | 1.4 | |
| 35-44 | 3,557 | 663 | 7.0 | 2.3 | |
| 45-54 | 3,898 | 1,383 | 7.7 | 4.8 | |
| 55-64 | 5,303 | 2,816 | 10.5 | 9.7 | |
| 65-74 | 9,715 | 5,217 | 19.2 | 17.9 | |
| 75-84 | 9,343 | 8,513 | 18.5 | 29.3 | |
| 85 and over | 3,117 | 9,539 | 6.2 | 32.8 | |
| Total deaths | 50,627 | 29,095 | 100.0 | 100.0 | |
| Source: Registrar-General Annual Report for 1916, Vital Statistics CSO | |||||
| 1 Data for 2014 is provisional. | |||||
| 1916 | 2014 | |
| Under 1 | 5271 | 249 |
| 1-4 | 2869 | 38 |
| 5-14 | 1847 | 56 |
| 15-24 | 2724 | 202 |
| 25-34 | 2983 | 419 |
| 35-44 | 3557 | 663 |
| 45-54 | 3898 | 1383 |
| 55-64 | 5303 | 2816 |
| 65-74 | 9715 | 5217 |
| 75-84 | 9343 | 8513 |
| 85 and over | 3117 | 9539 |
| 3.12 Life expectancy by age, 1911 and 2011 | ||||||
| years | ||||||
| Age | Male | Female | Increase in life expectancy | |||
| 1911 | 2011 | 1911 | 2011 | Males | Females | |
| 0 | 53.6 | 78.3 | 54.1 | 82.7 | 24.7 | 28.6 |
| 15 | 49.2 | 63.7 | 49.4 | 68.1 | 14.5 | 18.7 |
| 25 | 41.0 | 54.1 | 41.4 | 58.2 | 13.1 | 16.8 |
| 35 | 33.5 | 44.6 | 33.8 | 48.4 | 11.1 | 14.6 |
| 45 | 25.9 | 35.1 | 26.4 | 38.7 | 9.2 | 12.3 |
| 55 | 18.9 | 26.0 | 19.2 | 29.4 | 7.1 | 10.2 |
| 65 | 13.0 | 17.6 | 13.4 | 20.6 | 4.6 | 7.2 |
| 75 | 8.0 | 10.6 | 8.2 | 12.7 | 2.6 | 4.5 |
| Source: Irish Life Tables, CSO | ||||||
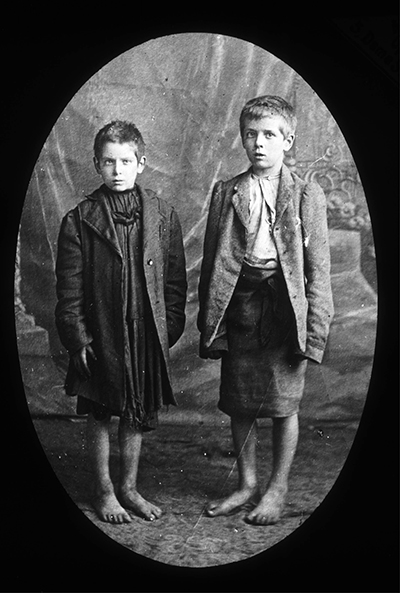
Photo: Children Co. Dublin
| Males 1911 | Females 1911 | Males 2011 | Females 2011 | |
| Age 0 | 53.6 | 54.1 | 78.3 | 82.7 |
| Age 15 | 49.2 | 49.4 | 63.7 | 68.1 |
| Age 45 | 25.9 | 26.4 | 35.1 | 38.7 |
| Age 65 | 13 | 13.4 | 17.6 | 20.6 |
Go to next Theme >>> Economy
Learn about our data and confidentiality safeguards, and the steps we take to produce statistics that can be trusted by all.