
This release was compiled during the COVID-19 pandemic. For further information see our Information Note on Implications of COVID-19 on the Live Register and the Monthly Unemployment Estimates and the Press Statement Live Register April 2020.
| Live Register Total | Seasonally Adjusted | Pandemic Unemployment Payment | Temporary COVID-19 Wage Subsidy Scheme | |
| April 2019 | 193,118 | 195,100 | - | - |
| March 2020 | 205,209 | 209,400 | 283,129 | 25,104 |
| April 2020 | 214,741 | 216,900 | 602,107 | 425,204 |
| Change in month | - | 7,500 | 318,978 | 400,100 |
| Change in year | 21,623 | - | - | - |
A range of measures have been introduced by the Government in relation to providing income support for those whose employment has been affected due to the COVID-19 pandemic in Ireland. The available schemes are being administered by the Department of Employment Affairs and Social Protection (DEASP) and the Revenue Commissioners.
At the end of April 2020, the majority of those whose income from employment has been affected due to COVID-19 were still being facilitated through the COVID-19 Pandemic Unemployment Payment (602,107 persons) which is administered by the DEASP while a smaller cohort were being facilitated through the Revenue Temporary COVID-19 Wage Subsidy Scheme (425,204 persons). See table A2.
The Central Statistics Office (CSO) has worked to identify the detail available from the different sources and how the different schemes should be classified for statistical purposes. There might be some duplication between those who meet the criteria to be included on the Live Register and those who are benefitting from the COVID-19 income support schemes.
As users will be aware, the Live Register is a series which is available back to 1967 on the CSO’s StatBank tabular data service. The Live Register series is of immense historical value and the CSO is keen to protect the continuity of the series, while also trying to make as much information as possible available to users, charting the labour market effects of COVID-19 at this time.
The CSO published an information note on April 1st, 2020 for users on the implications of the COVID-19 emergency payment measures on the Live Register and the Monthly Unemployment Estimates release. That information note is available here Information Note on Implications of COVID-19 on the Live Register and the Monthly Unemployment Estimates. The information note outlines why those in receipt of the COVID-19 income support payments are not included on the Live Register unless they meet the usual criteria to be included on the Live Register. Thus, the Live Register has been compiled in the traditional way and the usual tables are included below. The detailed commentary usually provided on the Live Register tables has not been included here but can be made available to users on request to labour@cso.ie.
The unadjusted number of persons on the Live Register in April 2020 published here includes a small number of applicants for the Pandemic Unemployment Payment who have been advised to apply for jobseekers benefits if they have a dependant adult and at least one child, or four or more children in the case of no dependant adult. At this stage is not possible for the CSO to quantify the number of those claimants; the Live Register totals for April 2020 may be revised should more information become available later.
|
The Live Register is not designed to measure unemployment. It includes part-time workers (those who work up to three days a week), seasonal and casual workers entitled to Jobseeker’s Benefit (JB) or Jobseeker’s Allowance (JA). Unemployment is measured by the Labour Force Survey. The Monthly Unemployment Rate (seasonally adjusted) is published in the Monthly Unemployment release. |
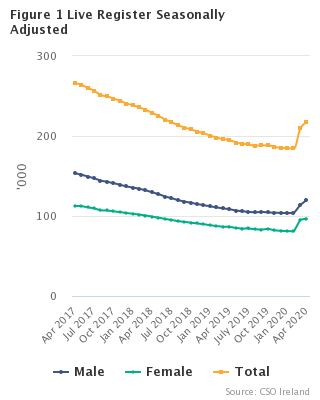
The unadjusted Live Register total for April 2020 was 214,741 persons; this consisted of 119,232 males (55.5%) and 95,509 females (44.5%). Of those on the Live Register for April 2020, 25,598, or 11.9%, are under 25 years of age, while 189,143, or 88.1%, are 25 years of age and over. See table 1a.
On an adjusted basis, the number of male and female claimants on the Live Register were 120,100 and 96,800 representing 55.4% and 44.6% of the seasonally adjusted Live Register total respectively. See table 2a.
A total of 602,107 persons were in receipt of the Pandemic Unemployment Payment for the last week of April 2020; this consisted of 344,043 males (57.1%) and 258,064 females (42.9%). Of those claiming the Pandemic Unemployment Payment, 122,214, or 20.3%, are under 25 years of age, while 479,893, or 79.7%, are 25 years of age and over. See table A2.
There were 425,204 persons benefitting from the Temporary COVID-19 Wage Subsidy Scheme at the end of April 2020 with 251,706 males and 173,498 females representing 59.2% and 40.8% of the total respectively. Of those benefitting from the Temporary Covid-19 Wage Subsidy Scheme, 58,084 (13.7%) are under 25 years of age, while 367,120 (86.3%) are 25 years of age and over. See table A2.
The Central Statistics Office (CSO) have worked with both the Department of Employment Affairs and Social Protection (DEASP) and the Revenue Commissioners to meet user needs for availability of more detailed aggregates for the recipients of both the Pandemic Unemployment Payment and the Temporary Wage Subsidy Scheme respectively. Tables providing the breakdowns of the numbers receiving the Pandemic Unemployment Payment each week by sex, age group, county and nationality grouping are being made available today at the following link: Detailed COVID-19 Tables. This link will be updated with corresponding tables for those in receipt of the Temporary Wage Subsidy Scheme as soon as the data is finalised. The CSO will continue to work with both DEASP and the Revenue Commissioners to update the breakdowns for both schemes on a weekly basis going forward and to make any additional relevant breakdowns relating to the schemes available at the link above. Please continue to check the link above for updates.
The Labour Market Analysis area of the CSO are compiling a mailing list of users who wish to register their interest in being kept informed of Labour Market related updates from the CSO. These email updates will include advising users of any updates to the aggregate tables available at the link above. If you wish to be included in this mailing list please email labour@cso.ie and ask for your email address to be included on the mailing list.
| Duration | Less than one year | One year or more |
|---|---|---|
| April 2018 | 130893 | 92709 |
| May 2018 | 128805 | 94697 |
| June 2018 | 133287 | 94778 |
| July 2018 | 140923 | 93522 |
| August 2018 | 133189 | 91969 |
| September 2018 | 119324 | 86406 |
| October 2018 | 116249 | 82998 |
| November 2018 | 115704 | 80557 |
| December 2018 | 120127 | 79542 |
| January 2019 | 120617 | 79010 |
| February 2019 | 119521 | 77413 |
| March 2019 | 116300 | 76107 |
| April 2019 | 118178 | 74940 |
| May 2019 | 113629 | 76238 |
| June 2019 | 119916 | 77192 |
| July 2019 | 129738 | 76658 |
| August 2019 | 123288 | 75805 |
| September 2019 | 112189 | 71594 |
| October 2019 | 111313 | 69146 |
| November 2019 | 109552 | 68002 |
| December 2019 | 114438 | 67558 |
| January 2020 | 116050 | 67705 |
| February 2020 | 115745 | 66871 |
| March 2020 | 138244 | 66965 |
| April 2020 | 146291 | 68450 |
| Under 25 years | 25 years and over | |
| April 2018 | 24121 | 199481 |
| April 2019 | 19949 | 173169 |
| April 2020 | 25598 | 189143 |
| Broad Occupational Group | April 2018 | April 2019 | April 2020 |
|---|---|---|---|
| 1 | 11153 | 9952 | 11442 |
| 2 | 12966 | 12031 | 13947 |
| 3 | 7203 | 6492 | 7415 |
| 4 | 23639 | 23258 | 22161 |
| 5 | 39454 | 32220 | 35618 |
| 6 | 29502 | 25363 | 32552 |
| 7 | 23285 | 19359 | 19932 |
| 8 | 35079 | 29173 | 31466 |
| 9 | 27615 | 23431 | 26076 |
| 10 | 13706 | 11839 | 14132 |
| KEY | |
| 1- | Managers and administrators |
| 2- | Professional |
| 3- | Associate professional and technical |
| 4- | Clerical and secretarial |
| 5- | Craft and related |
| 6- | Personal and Protective service |
| 7- | Sales |
| 8- | Plant and machine operatives |
| 9- | Other occupation |
| 10- | No occupation |
| Table 1(a) Total persons on the Live Register | |||||
| Category | April 2019 | March 2020 | April 2020 | Monthly change | Annual change |
| Males | |||||
| JB Claims | 17,022 | 25,549 | 28,335 | +2,786 | +11,313 |
| JA Applications | 83,248 | 81,229 | 84,476 | +3,247 | +1,228 |
| Other Registrants | 7,495 | 6,490 | 6,421 | -69 | -1,074 |
| Total | 107,765 | 113,268 | 119,232 | +5,964 | +11,467 |
| Females | |||||
| JB Claims | 19,997 | 28,443 | 29,665 | +1,222 | +9,668 |
| JA Applications | 49,283 | 49,067 | 51,462 | +2,395 | +2,179 |
| Other Registrants | 16,073 | 14,431 | 14,382 | -49 | -1,691 |
| Total | 85,353 | 91,941 | 95,509 | +3,568 | +10,156 |
| All Persons | |||||
| JB Claims | 37,019 | 53,992 | 58,000 | +4,008 | +20,981 |
| JA Applications | 132,531 | 130,296 | 135,938 | +5,642 | +3,407 |
| Other Registrants | 23,568 | 20,921 | 20,803 | -118 | -2,765 |
| Total | 193,118 | 205,209 | 214,741 | +9,532 | +21,623 |
| Table 1(b) Persons under 25 years of age on the Live Register | |||||
| Category | April 2019 | March 2020 | April 2020 | Monthly change | Annual change |
| Males | |||||
| JB Claims | 1,155 | 1,848 | 2,091 | +243 | +936 |
| JA Applications | 10,466 | 11,187 | 12,153 | +966 | +1,687 |
| Other Registrants | 57 | 39 | 37 | -2 | -20 |
| Total | 11,678 | 13,074 | 14,281 | +1,207 | +2,603 |
| Females | |||||
| JB Claims | 1,091 | 2,428 | 2,618 | +190 | +1,527 |
| JA Applications | 7,131 | 7,851 | 8,658 | +807 | +1,527 |
| Other Registrants | 49 | 44 | 41 | -3 | -8 |
| Total | 8,271 | 10,323 | 11,317 | +994 | +3,046 |
| All Persons | |||||
| JB Claims | 2,246 | 4,276 | 4,709 | +433 | +2,463 |
| JA Applications | 17,597 | 19,038 | 20,811 | +1,773 | +3,214 |
| Other Registrants | 106 | 83 | 78 | -5 | -28 |
| Total | 19,949 | 23,397 | 25,598 | +2,201 | +5,649 |
| Table 1(c) Persons 25 years of age and over on the Live Register | |||||
| Category | April 2019 | March 2020 | April 2020 | Monthly change | Annual change |
| Males | |||||
| JB Claims | 15,867 | 23,701 | 26,244 | +2,543 | +10,377 |
| JA Applications | 72,782 | 70,042 | 72,323 | +2,281 | -459 |
| Other Registrants | 7,438 | 6,451 | 6,384 | -67 | -1,054 |
| Total | 96,087 | 100,194 | 104,951 | +4,757 | +8,864 |
| Females | |||||
| JB Claims | 18,906 | 26,015 | 27,047 | +1,032 | +8,141 |
| JA Applications | 42,152 | 41,216 | 42,804 | +1,588 | +652 |
| Other Registrants | 16,024 | 14,387 | 14,341 | -46 | -1,683 |
| Total | 77,082 | 81,618 | 84,192 | +2,574 | +7,110 |
| All Persons | |||||
| JB Claims | 34,773 | 49,716 | 53,291 | +3,575 | +18,518 |
| JA Applications | 114,934 | 111,258 | 115,127 | +3,869 | +193 |
| Other Registrants | 23,462 | 20,838 | 20,725 | -113 | -2,737 |
| Total | 173,169 | 181,812 | 189,143 | +7,331 | +15,974 |
| Table 2(a) Total persons on the Live Register - Unadjusted and Seasonally Adjusted | ||||||||
| Unadjusted Series | Seasonally Adjusted Series¹ | |||||||
| Month | Males | Females | All Persons | Males | Females | All Persons | ||
| 2018 | April | 128,349 | 95,253 | 223,602 | 129,600 | 99,200 | 228,700 | |
| May | 127,699 | 95,803 | 223,502 | 127,200 | 97,900 | 225,100 | ||
| June | 126,981 | 101,084 | 228,065 | 124,300 | 96,300 | 220,600 | ||
| July | 126,252 | 108,193 | 234,445 | 122,200 | 95,000 | 217,200 | ||
| August | 123,354 | 101,804 | 225,158 | 119,800 | 93,600 | 213,400 | ||
| September | 115,890 | 89,840 | 205,730 | 118,000 | 92,600 | 210,600 | ||
| October | 112,397 | 86,850 | 199,247 | 116,500 | 91,700 | 208,200 | ||
| November | 110,836 | 85,425 | 196,261 | 114,900 | 90,700 | 205,600 | ||
| December | 112,414 | 87,255 | 199,669 | 113,500 | 89,700 | 203,300 | ||
| 2019 | January | 113,154 | 86,473 | 199,627 | 112,100 | 88,500 | 200,500 | |
| February | 111,317 | 85,617 | 196,934 | 110,700 | 87,400 | 198,000 | ||
| March | 109,130 | 83,277 | 192,407 | 109,500 | 86,600 | 196,000 | ||
| April | 107,765 | 85,353 | 193,118 | 108,500 | 86,600 | 195,100 | ||
| May | 107,018 | 82,849 | 189,867 | 106,800 | 85,000 | 191,800 | ||
| June | 108,273 | 88,835 | 197,108 | 105,900 | 84,300 | 190,300 | ||
| July | 108,936 | 97,460 | 206,396 | 105,100 | 84,400 | 189,400 | ||
| August | 107,849 | 91,244 | 199,093 | 104,500 | 83,400 | 187,900 | ||
| September | 103,548 | 80,235 | 183,783 | 105,200 | 83,000 | 188,300 | ||
| October | 100,961 | 79,498 | 180,459 | 104,400 | 84,000 | 188,400 | ||
| November | 100,659 | 76,895 | 177,554 | 104,200 | 82,000 | 186,200 | ||
| December | 102,878 | 79,118 | 181,996 | 103,800 | 81,500 | 185,300 | ||
| 2020 | January | 104,605 | 79,150 | 183,755 | 103,700 | 81,100 | 184,800 | |
| February | 103,596 | 79,020 | 182,616 | 103,600 | 80,800 | 184,400 | ||
| March | 113,268 | 91,941 | 205,209 | 113,900 | 95,400 | 209,400 | ||
| April | 119,232 | 95,509 | 214,741 | 120,100 | 96,800 | 216,900 | ||
| ¹ Table contains revised figures | ||||||||
| Table 2(b) Persons under 25 years of age on the Live Register - Unadjusted and Seasonally Adjusted | ||||||||
| Unadjusted Series | Seasonally Adjusted Series¹ | |||||||
| Month | Males | Females | All Persons | Males | Females | All Persons | ||
| 2018 | April | 14,337 | 9,784 | 24,121 | 14,600 | 10,300 | 24,900 | |
| May | 14,489 | 10,146 | 24,635 | 14,400 | 10,200 | 24,600 | ||
| June | 14,658 | 10,790 | 25,448 | 14,000 | 9,900 | 23,900 | ||
| July | 14,619 | 11,369 | 25,988 | 13,800 | 9,800 | 23,500 | ||
| August | 14,583 | 11,050 | 25,633 | 13,500 | 9,600 | 23,100 | ||
| September | 13,275 | 9,395 | 22,670 | 13,200 | 9,300 | 22,500 | ||
| October | 12,392 | 8,663 | 21,055 | 13,000 | 9,200 | 22,200 | ||
| November | 11,832 | 8,180 | 20,012 | 12,700 | 9,100 | 21,900 | ||
| December | 11,798 | 8,123 | 19,921 | 12,500 | 9,000 | 21,600 | ||
| 2019 | January | 12,308 | 8,569 | 20,877 | 12,400 | 9,000 | 21,300 | |
| February | 12,244 | 8,624 | 20,868 | 12,200 | 8,800 | 21,000 | ||
| March | 12,030 | 8,420 | 20,450 | 12,100 | 8,700 | 20,800 | ||
| April | 11,678 | 8,271 | 19,949 | 11,900 | 8,600 | 20,600 | ||
| May | 11,891 | 8,456 | 20,347 | 11,800 | 8,500 | 20,300 | ||
| June | 12,293 | 9,255 | 21,548 | 11,800 | 8,500 | 20,300 | ||
| July | 12,500 | 9,990 | 22,490 | 11,800 | 8,500 | 20,300 | ||
| August | 12,726 | 9,745 | 22,471 | 11,800 | 8,400 | 20,200 | ||
| September | 11,949 | 8,393 | 20,342 | 11,900 | 8,300 | 20,200 | ||
| October | 11,199 | 7,719 | 18,918 | 11,700 | 8,300 | 20,000 | ||
| November | 11,000 | 7,362 | 18,362 | 11,800 | 8,200 | 20,000 | ||
| December | 11,100 | 7,369 | 18,469 | 11,800 | 8,200 | 20,000 | ||
| 2020 | January | 11,738 | 7,853 | 19,591 | 11,800 | 8,200 | 20,000 | |
| February | 11,699 | 8,033 | 19,732 | 11,600 | 8,200 | 19,900 | ||
| March | 13,074 | 10,323 | 23,397 | 13,100 | 10,700 | 23,800 | ||
| April | 14,281 | 11,317 | 25,598 | 14,600 | 11,800 | 26,400 | ||
| ¹ Table contains revised figures | ||||||||
| Table 2(c) Persons 25 years of age and over on the Live Register - Unadjusted and Seasonally Adjusted | ||||||||
| Unadjusted Series | Seasonally Adjusted Series¹ | |||||||
| Month | Males | Females | All Persons | Males | Females | All Persons | ||
| 2018 | April | 114,012 | 85,469 | 199,481 | 114,900 | 88,900 | 203,800 | |
| May | 113,210 | 85,657 | 198,867 | 112,800 | 87,700 | 200,500 | ||
| June | 112,323 | 90,294 | 202,617 | 110,300 | 86,400 | 196,700 | ||
| July | 111,633 | 96,824 | 208,457 | 108,500 | 85,300 | 193,700 | ||
| August | 108,771 | 90,754 | 199,525 | 106,300 | 84,000 | 190,300 | ||
| September | 102,615 | 80,445 | 183,060 | 104,800 | 83,300 | 188,100 | ||
| October | 100,005 | 78,187 | 178,192 | 103,500 | 82,400 | 185,900 | ||
| November | 99,004 | 77,245 | 176,249 | 102,200 | 81,600 | 183,800 | ||
| December | 100,616 | 79,132 | 179,748 | 101,000 | 80,700 | 181,700 | ||
| 2019 | January | 100,846 | 77,904 | 178,750 | 99,700 | 79,500 | 179,200 | |
| February | 99,073 | 76,993 | 176,066 | 98,500 | 78,500 | 177,000 | ||
| March | 97,100 | 74,857 | 171,957 | 97,400 | 77,800 | 175,300 | ||
| April | 96,087 | 77,082 | 173,169 | 96,600 | 78,000 | 174,500 | ||
| May | 95,127 | 74,393 | 169,520 | 95,000 | 76,500 | 171,400 | ||
| June | 95,980 | 79,580 | 175,560 | 94,100 | 75,800 | 170,000 | ||
| July | 96,436 | 87,470 | 183,906 | 93,300 | 75,800 | 169,100 | ||
| August | 95,123 | 81,499 | 176,622 | 92,700 | 75,000 | 167,700 | ||
| September | 91,599 | 71,842 | 163,441 | 93,400 | 74,700 | 168,100 | ||
| October | 89,762 | 71,779 | 161,541 | 92,700 | 75,700 | 168,400 | ||
| November | 89,659 | 69,533 | 159,192 | 92,400 | 73,800 | 166,200 | ||
| December | 91,778 | 71,749 | 163,527 | 92,000 | 73,300 | 165,300 | ||
| 2020 | January | 92,867 | 71,297 | 164,164 | 91,900 | 72,900 | 164,800 | |
| February | 91,897 | 70,987 | 162,884 | 91,900 | 72,600 | 164,600 | ||
| March | 100,194 | 81,618 | 181,812 | 100,800 | 84,700 | 185,600 | ||
| April | 104,951 | 84,192 | 189,143 | 105,500 | 85,000 | 190,500 | ||
| ¹ Table contains revised figures | ||||||||
| Table 3 Summary of flows on and off the Live Register¹ | |||||||||||||||
| Males | Females | All Claimants | |||||||||||||
| Live Register | Joined Live Register | Stayed on Live Register | Left Live Register | Live Register | Joined Live Register | Stayed on Live Register | Left Live Register | Live Register | Joined Live Register | Stayed on Live Register | Left Live Register | ||||
| JB Claims | |||||||||||||||
| 2019 | April | 17,022 | 3,623 | 13,399 | 3,074 | 19,997 | 5,557 | 14,440 | 2,791 | 37,019 | 9,180 | 27,839 | 5,865 | ||
| May | 15,951 | 3,750 | 12,201 | 4,305 | 17,273 | 3,603 | 13,670 | 5,856 | 33,224 | 7,353 | 25,871 | 10,161 | |||
| June | 16,588 | 3,686 | 12,902 | 2,678 | 20,997 | 6,487 | 14,510 | 2,272 | 37,585 | 10,173 | 27,412 | 4,950 | |||
| July | 17,590 | 4,113 | 13,477 | 2,619 | 27,595 | 9,401 | 18,194 | 2,355 | 45,185 | 13,514 | 31,671 | 4,974 | |||
| August | 17,188 | 3,863 | 13,325 | 3,718 | 22,949 | 3,691 | 19,258 | 7,791 | 40,137 | 7,554 | 32,583 | 11,509 | |||
| September | 16,656 | 3,818 | 12,838 | 3,908 | 17,235 | 3,184 | 14,051 | 8,522 | 33,891 | 7,002 | 26,889 | 12,430 | |||
| October | 16,623 | 4,598 | 12,025 | 4,011 | 18,453 | 5,326 | 13,127 | 3,573 | 35,076 | 9,924 | 25,152 | 7,584 | |||
| November | 16,867 | 4,058 | 12,809 | 3,357 | 17,204 | 3,373 | 13,831 | 4,280 | 34,071 | 7,431 | 26,640 | 7,637 | |||
| December | 18,309 | 3,855 | 14,454 | 1,922 | 19,118 | 4,033 | 15,085 | 1,765 | 37,427 | 7,888 | 29,539 | 3,687 | |||
| 2020 | January | 19,511 | 5,348 | 14,163 | 3,557 | 19,174 | 4,626 | 14,548 | 4,190 | 38,685 | 9,974 | 28,711 | 7,747 | ||
| February | 19,320 | 3,782 | 15,538 | 3,505 | 19,387 | 3,423 | 15,964 | 2,836 | 38,707 | 7,205 | 31,502 | 6,341 | |||
| March | 25,549 | 9,385 | 16,164 | 2,678 | 28,443 | 12,116 | 16,327 | 2,697 | 53,992 | 21,501 | 32,491 | 5,375 | |||
| April | 28,335 | 6,201 | 22,134 | 2,666 | 29,665 | 4,995 | 24,670 | 3,124 | 58,000 | 11,196 | 46,804 | 5,790 | |||
| JA Applications | |||||||||||||||
| 2019 | April | 83,248 | 4,109 | 79,139 | 5,930 | 49,283 | 2,990 | 46,293 | 3,700 | 132,531 | 7,099 | 125,432 | 9,630 | ||
| May | 83,725 | 7,473 | 76,252 | 7,447 | 49,862 | 5,148 | 44,714 | 4,907 | 133,587 | 12,621 | 120,966 | 12,354 | |||
| June | 84,395 | 6,347 | 78,048 | 6,008 | 51,882 | 5,151 | 46,731 | 3,451 | 136,277 | 11,498 | 124,779 | 9,459 | |||
| July | 84,082 | 5,004 | 79,078 | 5,748 | 53,325 | 4,624 | 48,701 | 3,476 | 137,407 | 9,628 | 127,779 | 9,224 | |||
| August | 83,524 | 5,492 | 78,032 | 6,535 | 52,143 | 3,617 | 48,526 | 5,162 | 135,667 | 9,109 | 126,558 | 11,697 | |||
| September | 79,927 | 5,664 | 74,263 | 9,656 | 47,551 | 3,379 | 44,172 | 8,242 | 127,478 | 9,043 | 118,435 | 17,898 | |||
| October | 77,448 | 5,895 | 71,553 | 8,905 | 45,641 | 3,939 | 41,702 | 6,205 | 123,089 | 9,834 | 113,255 | 15,110 | |||
| November | 77,048 | 5,228 | 71,820 | 6,041 | 44,694 | 3,069 | 41,625 | 4,260 | 121,742 | 8,297 | 113,445 | 10,301 | |||
| December | 77,836 | 4,078 | 73,758 | 3,728 | 44,974 | 2,547 | 42,427 | 2,529 | 122,810 | 6,625 | 116,185 | 6,257 | |||
| 2020 | January | 78,451 | 5,583 | 72,868 | 5,530 | 45,212 | 3,670 | 41,542 | 3,733 | 123,663 | 9,253 | 114,410 | 9,263 | ||
| February | 77,654 | 4,554 | 73,100 | 5,772 | 44,951 | 2,959 | 41,992 | 3,484 | 122,605 | 7,513 | 115,092 | 9,256 | |||
| March | 81,229 | 7,573 | 73,656 | 4,445 | 49,067 | 6,509 | 42,558 | 2,698 | 130,296 | 14,082 | 116,214 | 7,143 | |||
| April | 84,476 | 5,302 | 79,174 | 2,756 | 51,462 | 3,919 | 47,543 | 2,033 | 135,938 | 9,221 | 126,717 | 4,789 | |||
| Other Registrants | |||||||||||||||
| 2019 | April | 7,495 | 162 | 7,333 | 253 | 16,073 | 480 | 15,593 | 462 | 23,568 | 642 | 22,926 | 715 | ||
| May | 7,342 | 139 | 7,203 | 354 | 15,714 | 308 | 15,406 | 803 | 23,056 | 447 | 22,609 | 1,157 | |||
| June | 7,290 | 126 | 7,164 | 219 | 15,956 | 497 | 15,459 | 425 | 23,246 | 623 | 22,623 | 644 | |||
| July | 7,264 | 197 | 7,067 | 283 | 16,540 | 871 | 15,669 | 441 | 23,804 | 1,068 | 22,736 | 724 | |||
| August | 7,137 | 155 | 6,982 | 342 | 16,152 | 322 | 15,830 | 895 | 23,289 | 477 | 22,812 | 1,237 | |||
| September | 6,965 | 129 | 6,836 | 347 | 15,449 | 263 | 15,186 | 1,072 | 22,414 | 392 | 22,022 | 1,419 | |||
| October | 6,890 | 195 | 6,695 | 358 | 15,404 | 498 | 14,906 | 723 | 22,294 | 693 | 21,601 | 1,081 | |||
| November | 6,744 | 132 | 6,612 | 322 | 14,997 | 277 | 14,720 | 782 | 21,741 | 409 | 21,332 | 1,104 | |||
| December | 6,733 | 149 | 6,584 | 213 | 15,026 | 344 | 14,682 | 407 | 21,759 | 493 | 21,266 | 620 | |||
| 2020 | January | 6,643 | 167 | 6,476 | 284 | 14,764 | 295 | 14,469 | 636 | 21,407 | 462 | 20,945 | 920 | ||
| February | 6,622 | 122 | 6,500 | 192 | 14,682 | 258 | 14,424 | 448 | 21,304 | 380 | 20,924 | 640 | |||
| March | 6,490 | 96 | 6,394 | 257 | 14,431 | 235 | 14,196 | 546 | 20,921 | 331 | 20,590 | 803 | |||
| April | 6,421 | 87 | 6,334 | 203 | 14,382 | 192 | 14,190 | 382 | 20,803 | 279 | 20,524 | 585 | |||
| All Schemes | |||||||||||||||
| 2019 | April | 107,765 | 7,894 | 99,871 | 9,257 | 85,353 | 9,027 | 76,326 | 6,953 | 193,118 | 16,921 | 176,197 | 16,210 | ||
| May | 107,018 | 11,362 | 95,656 | 12,106 | 82,849 | 9,059 | 73,790 | 11,566 | 189,867 | 20,421 | 169,446 | 23,672 | |||
| June | 108,273 | 10,159 | 98,114 | 8,905 | 88,835 | 12,135 | 76,700 | 6,148 | 197,108 | 22,294 | 174,814 | 15,053 | |||
| July | 108,936 | 9,314 | 99,622 | 8,650 | 97,460 | 14,896 | 82,564 | 6,272 | 206,396 | 24,210 | 182,186 | 14,922 | |||
| August | 107,849 | 9,510 | 98,339 | 10,595 | 91,244 | 7,630 | 83,614 | 13,848 | 199,093 | 17,140 | 181,953 | 24,443 | |||
| September | 103,548 | 9,611 | 93,937 | 13,911 | 80,235 | 6,826 | 73,409 | 17,836 | 183,783 | 16,437 | 167,346 | 31,747 | |||
| October | 100,961 | 10,688 | 90,273 | 13,274 | 79,498 | 9,763 | 69,735 | 10,501 | 180,459 | 20,451 | 160,008 | 23,775 | |||
| November | 100,659 | 9,418 | 91,241 | 9,720 | 76,895 | 6,719 | 70,176 | 9,322 | 177,554 | 16,137 | 161,417 | 19,042 | |||
| December | 102,878 | 8,082 | 94,796 | 5,863 | 79,118 | 6,924 | 72,194 | 4,701 | 181,996 | 15,006 | 166,990 | 10,564 | |||
| 2020 | January | 104,605 | 11,098 | 93,507 | 9,371 | 79,150 | 8,591 | 70,559 | 8,559 | 183,755 | 19,689 | 164,066 | 17,930 | ||
| February | 103,596 | 8,458 | 95,138 | 9,469 | 79,020 | 6,640 | 72,380 | 6,768 | 182,616 | 15,098 | 167,518 | 16,237 | |||
| March | 113,268 | 17,054 | 96,214 | 7,380 | 91,941 | 18,860 | 73,081 | 5,941 | 205,209 | 35,914 | 169,295 | 13,321 | |||
| April | 119,232 | 11,590 | 107,642 | 5,625 | 95,509 | 9,106 | 86,403 | 5,539 | 214,741 | 20,696 | 194,045 | 11,164 | |||
| 1 Flow analysis: inflows and outflows published in this table do not take account of inter-scheme activity within the Live Register. For example, if a claimant exhausts his/her entitlement to JB and opens a new JA claim this is counted as an outflow in JB and an inflow in JA. | |||||||||||||||
| Table 4 Persons on the Live Register classified by region | |||||||
| NUTS2 and NUTS3 Regions¹ | April 2019 | March 2020 | April 2020 | Monthly change | Annual change | Under 25 years | 25 years & over |
| Males | |||||||
| Northern and Western | 21,540 | 21,582 | 22,354 | +772 | +814 | 2,502 | 19,852 |
| Border | 11,139 | 11,217 | 11,756 | +539 | +617 | 1,368 | 10,388 |
| West | 10,401 | 10,365 | 10,598 | +233 | +197 | 1,134 | 9,464 |
| Southern | 36,202 | 36,944 | 38,583 | +1,639 | +2,381 | 4,516 | 34,067 |
| Mid-West | 11,298 | 11,589 | 12,026 | +437 | +728 | 1,458 | 10,568 |
| South-East | 12,323 | 12,492 | 12,829 | +337 | +506 | 1,652 | 11,177 |
| South-West | 12,581 | 12,863 | 13,728 | +865 | +1,147 | 1,406 | 12,322 |
| Eastern and Midland | 49,885 | 49,689 | 51,657 | +1,968 | +1,772 | 5,945 | 45,712 |
| Dublin | 27,785 | 27,480 | 28,558 | +1,078 | +773 | 3,083 | 25,475 |
| Mid-East | 13,984 | 14,054 | 14,688 | +634 | +704 | 1,777 | 12,911 |
| Midland | 8,116 | 8,155 | 8,411 | +256 | +295 | 1,085 | 7,326 |
| Total | 107,765 | 113,268 | 119,232 | +5,964 | +11,467 | 14,281 | 104,951 |
| Females | |||||||
| Northern and Western | 17,820 | 18,066 | 18,430 | +364 | +610 | 2,021 | 16,409 |
| Border | 9,163 | 9,153 | 9,415 | +262 | +252 | 1,145 | 8,270 |
| West | 8,657 | 8,913 | 9,015 | +102 | +358 | 876 | 8,139 |
| Southern | 28,868 | 29,437 | 30,337 | +900 | +1,469 | 3,449 | 26,888 |
| Mid-West | 8,493 | 8,725 | 8,931 | +206 | +438 | 1,081 | 7,850 |
| South-East | 9,799 | 9,701 | 9,733 | +32 | -66 | 1,182 | 8,551 |
| South-West | 10,576 | 11,011 | 11,673 | +662 | +1,097 | 1,186 | 10,487 |
| Eastern and Midland | 38,538 | 37,652 | 38,650 | +998 | +112 | 4,009 | 34,641 |
| Dublin | 19,337 | 19,139 | 19,778 | +639 | +441 | 1,889 | 17,889 |
| Mid-East | 12,125 | 11,802 | 12,102 | +300 | -23 | 1,229 | 10,873 |
| Midland | 7,076 | 6,711 | 6,770 | +59 | -+306 | 891 | 5,879 |
| Total | 85,353 | 91,941 | 95,509 | +3,568 | +10,156 | 11,317 | 84,192 |
| All Persons | |||||||
| Northern and Western | 39,360 | 39,648 | 40,784 | +1,136 | +1,424 | 4,523 | 36,261 |
| Border | 20,302 | 20,370 | 21,171 | +801 | +869 | 2,513 | 18,658 |
| West | 19,058 | 19,278 | 19,613 | +335 | +555 | 2,010 | 17,603 |
| Southern | 65,070 | 66,381 | 68,920 | +2,539 | +3,850 | 7,965 | 60,955 |
| Mid-West | 19,791 | 20,314 | 20,957 | +643 | +1,166 | 2,539 | 18,418 |
| South-East | 22,122 | 22,193 | 22,562 | +369 | +440 | 2,834 | 19,728 |
| South-West | 23,157 | 23,874 | 25,401 | +1,527 | +2,244 | 2,592 | 22,809 |
| Eastern and Midland | 88,423 | 87,341 | 90,307 | +2,966 | +1,884 | 9,954 | 80,353 |
| Dublin | 47,122 | 46,619 | 48,336 | +1,717 | +1,214 | 4,972 | 43,364 |
| Mid-East | 26,109 | 25,856 | 26,790 | +934 | +681 | 3,006 | 23,784 |
| Midland | 15,192 | 14,866 | 15,181 | +315 | -11 | 1,976 | 13,205 |
| Total2 | 193,118 | 205,209 | 214,741 | +9,532 | +21,623 | 25,598 | 189,143 |
| 1The composition of the regions is described in the Background Notes | |||||||
| 2 From January 2018, registrations which have yet not being assigned to a DEASP local office of registration are included in the Live Register Totals. These registrations are not included in individual NUTS3/ NUTS2 totals in this table | |||||||
| Table 5 Persons on the Live Register classified by last held occupation | |||||||
| Broad occupational group | April 2019 | March 2020 | April 2020 | Monthly change | Annual change | Under 25 years | 25 years & over |
| Males | |||||||
| Managers and administrators | 5,532 | 5,773 | 6,041 | +268 | +509 | 166 | 5,875 |
| Professional | 5,004 | 5,482 | 6,011 | +529 | +1,007 | 353 | 5,658 |
| Associate professional and technical | 3,540 | 3,699 | 3,953 | +254 | +413 | 287 | 3,666 |
| Clerical and secretarial | 5,912 | 5,681 | 5,924 | +243 | +12 | 590 | 5,334 |
| Craft and related | 27,117 | 27,896 | 29,453 | +1,557 | +2,336 | 2,515 | 26,938 |
| Personal and protective service | 8,372 | 10,235 | 10,834 | +599 | +2,462 | 1,299 | 9,535 |
| Sales | 6,970 | 7,004 | 7,349 | +345 | +379 | 1,746 | 5,603 |
| Plant and machine operatives | 21,093 | 21,786 | 22,402 | +616 | +1,309 | 2,636 | 19,766 |
| Other occupation | 17,220 | 18,080 | 18,920 | +840 | +1,700 | 2,418 | 16,502 |
| No occupation¹ | 7,005 | 7,632 | 8,345 | +713 | +1,340 | 2,271 | 6,074 |
| Total | 107,765 | 113,268 | 119,232 | +5,964 | +11,467 | 14,281 | 104,951 |
| Females | |||||||
| Managers and administrators | 4,420 | 5,189 | 5,401 | +212 | +981 | 131 | 5,270 |
| Professional | 7,027 | 7,363 | 7,936 | +573 | +909 | 459 | 7,477 |
| Associate professional and technical | 2,952 | 3,242 | 3,462 | +220 | +510 | 194 | 3,268 |
| Clerical and secretarial | 17,346 | 15,796 | 16,237 | +441 | -1,109 | 828 | 15,409 |
| Craft and related | 5,103 | 5,994 | 6,165 | +171 | +1,062 | 806 | 5,359 |
| Personal and protective service | 16,991 | 21,352 | 21,718 | +366 | +4,727 | 2,824 | 18,894 |
| Sales | 12,389 | 12,170 | 12,583 | +413 | +194 | 2,090 | 10,493 |
| Plant and machine operatives | 8,080 | 8,824 | 9,064 | +240 | +984 | 1,346 | 7,718 |
| Other occupation | 6,211 | 6,766 | 7,156 | +390 | +945 | 1,138 | 6,018 |
| No occupation¹ | 4,834 | 5,245 | 5,787 | +542 | +953 | 1,501 | 4,286 |
| Total | 85,353 | 91,941 | 95,509 | +3,568 | +10,156 | 11,317 | 84,192 |
| All Persons | |||||||
| Managers and administrators | 9,952 | 10,962 | 11,442 | +480 | +1,490 | 297 | 11,145 |
| Professional | 12,031 | 12,845 | 13,947 | +1,102 | +1,916 | 812 | 13,135 |
| Associate professional and technical | 6,492 | 6,941 | 7,415 | +474 | +923 | 481 | 6,934 |
| Clerical and secretarial | 23,258 | 21,477 | 22,161 | +684 | -1,097 | 1,418 | 20,743 |
| Craft and related | 32,220 | 33,890 | 35,618 | +1,728 | +3,398 | 3,321 | 32,297 |
| Personal and protective service | 25,363 | 31,587 | 32,552 | +965 | +7,189 | 4,123 | 28,429 |
| Sales | 19,359 | 19,174 | 19,932 | +758 | +573 | 3,836 | 16,096 |
| Plant and machine operatives | 29,173 | 30,610 | 31,466 | +856 | +2,293 | 3,982 | 27,484 |
| Other occupation | 23,431 | 24,846 | 26,076 | +1,230 | +2,645 | 3,556 | 22,520 |
| No occupation¹ | 11,839 | 12,877 | 14,132 | +1,255 | +2,293 | 3,772 | 10,360 |
| Total | 193,118 | 205,209 | 214,741 | +9,532 | +21,623 | 25,598 | 189,143 |
| ¹ Includes those who never worked and those who have no stated occupation | |||||||
| Table 6 Persons on the Live Register classified by duration of continuous registration | |||||||
| Duration | April 2019 | March 2020 | April 2020 | Monthly change | Annual change | Under 25 years | 25 years & over |
| Males | |||||||
| Less than one year | 63,441 | 73,961 | 78,897 | +4,936 | +15,456 | 11,570 | 67,327 |
| One year or more | 44,324 | 39,307 | 40,335 | +1,028 | -3,989 | 2,711 | 37,624 |
| Total | 107,765 | 113,268 | 119,232 | +5,964 | +11,467 | 14,281 | 104,951 |
| Females | |||||||
| Less than one year | 54,737 | 64,283 | 67,394 | +3,111 | +12,657 | 9,637 | 57,757 |
| One year or more | 30,616 | 27,658 | 28,115 | +457 | -2,501 | 1,680 | 26,435 |
| Total | 85,353 | 91,941 | 95,509 | +3,568 | +10,156 | 11,317 | 84,192 |
| All Persons | |||||||
| Less than one year | 118,178 | 138,244 | 146,291 | +8,047 | +28,113 | 21,207 | 125,084 |
| One year or more | 74,940 | 66,965 | 68,450 | +1,485 | -6,490 | 4,391 | 64,059 |
| Total | 193,118 | 205,209 | 214,741 | +9,532 | +21,623 | 25,598 | 189,143 |
| Table 7 Casual and part-time workers on the Live Register | |||||||||
| Males | Monthly change | Females | Monthly change | All Persons | Monthly change | ||||
| 2018 | April | 24,188 | -721 | 23,939 | -618 | 48,127 | -1,339 | ||
| May | 23,493 | -695 | 23,424 | -515 | 46,917 | -1,210 | |||
| June | 22,872 | -621 | 23,116 | -308 | 45,988 | -929 | |||
| July | 22,290 | -582 | 22,855 | -261 | 45,145 | -843 | |||
| August | 21,492 | -798 | 22,102 | -753 | 43,594 | -1,551 | |||
| September | 20,719 | -773 | 21,405 | -697 | 42,124 | -1,470 | |||
| October | 20,309 | -410 | 21,344 | -61 | 41,653 | -471 | |||
| November | 20,286 | -23 | 21,473 | +129 | 41,759 | +106 | |||
| December | 20,348 | +62 | 21,403 | -70 | 41,751 | -08 | |||
| 2019 | January | 20,079 | -269 | 21,161 | -242 | 41,240 | -511 | ||
| February | 20,090 | +11 | 21,174 | +13 | 41,264 | +24 | |||
| March | 19,803 | -287 | 20,956 | -218 | 40,759 | -505 | |||
| April | 19,280 | -523 | 20,403 | -553 | 39,683 | -1,076 | |||
| May | 18,502 | -778 | 19,894 | -509 | 38,396 | -1,287 | |||
| June | 18,259 | -243 | 19,856 | -38 | 38,115 | -281 | |||
| July | 17,915 | -344 | 19,671 | -185 | 37,586 | -529 | |||
| August | 17,543 | -372 | 19,236 | -435 | 36,779 | -807 | |||
| September | 17,408 | -135 | 18,703 | -533 | 36,111 | -668 | |||
| October | 17,320 | -88 | 18,629 | -74 | 35,949 | -162 | |||
| November | 17,562 | +242 | 18,964 | +335 | 36,526 | +577 | |||
| December | 17,754 | +192 | 19,062 | +98 | 36,816 | +290 | |||
| 2020 | January | 17,561 | -193 | 18,794 | -268 | 36,355 | -461 | ||
| February | 17,661 | +100 | 18,945 | +151 | 36,606 | +251 | |||
| March | 17,689 | +28 | 18,918 | -27 | 36,607 | 1 | |||
| April | 17,436 | -253 | 18,861 | -57 | 36,297 | -310 | |||
| Table 8 Persons on the Live Register classified by nationality grouping | |||||||||
| Nationality grouping | |||||||||
| Non-Irish nationals | |||||||||
| United Kingdom | EU14_2020 excl. IRL 1 | EU15-EU27_2020 1 | Other | Non-Irish nationals | Irish nationals | All Persons | |||
| 2018 | April | 8,695 | 2,646 | 21,834 | 6,699 | 39,874 | 183,728 | 223,602 | |
| May | 8,755 | 2,647 | 21,370 | 7,024 | 39,796 | 183,706 | 223,502 | ||
| June | 8,826 | 2,630 | 21,102 | 7,335 | 39,893 | 188,172 | 228,065 | ||
| July | 8,946 | 2,610 | 21,028 | 7,312 | 39,896 | 194,549 | 234,445 | ||
| August | 8,645 | 2,600 | 20,193 | 7,149 | 38,587 | 186,571 | 225,158 | ||
| September | 7,965 | 2,426 | 18,910 | 6,504 | 35,805 | 169,925 | 205,730 | ||
| October | 7,796 | 2,428 | 18,601 | 6,107 | 34,932 | 164,315 | 199,247 | ||
| November | 7,787 | 2,505 | 18,632 | 5,983 | 34,907 | 161,354 | 196,261 | ||
| December | 7,904 | 2,497 | 19,211 | 6,003 | 35,615 | 164,054 | 199,669 | ||
| 2019 | January | 7,869 | 2,588 | 19,450 | 6,020 | 35,927 | 163,700 | 199,627 | |
| February | 7,765 | 2,595 | 19,238 | 5,948 | 35,546 | 161,388 | 196,934 | ||
| March | 7,557 | 2,438 | 18,873 | 5,948 | 34,816 | 157,591 | 192,407 | ||
| April | 7,472 | 2,436 | 18,481 | 5,953 | 34,342 | 158,776 | 193,118 | ||
| May | 7,404 | 2,393 | 18,027 | 6,232 | 34,056 | 155,811 | 189,867 | ||
| June | 7,590 | 2,467 | 18,060 | 6,545 | 34,662 | 162,446 | 197,108 | ||
| July | 7,820 | 2,554 | 18,126 | 6,735 | 35,235 | 171,161 | 206,396 | ||
| August | 7,667 | 2,492 | 17,788 | 6,696 | 34,643 | 164,450 | 199,093 | ||
| September | 7,053 | 2,372 | 17,417 | 6,538 | 33,380 | 150,403 | 183,783 | ||
| October | 6,958 | 2,265 | 16,785 | 5,921 | 31,929 | 148,530 | 180,459 | ||
| November | 6,935 | 2,318 | 16,835 | 5,837 | 31,925 | 145,629 | 177,554 | ||
| December | 7,140 | 2,395 | 17,368 | 5,890 | 32,793 | 149,203 | 181,996 | ||
| 2020 | January | 7,155 | 2,488 | 17,873 | 6,031 | 33,547 | 150,208 | 183,755 | |
| February | 7,108 | 2,469 | 17,835 | 6,050 | 33,462 | 149,154 | 182,616 | ||
| March | 7,764 | 3,545 | 21,078 | 8,983 | 41,370 | 163,839 | 205,209 | ||
| April | 8,081 | 3,827 | 22,174 | 10,196 | 44,278 | 170,463 | 214,741 | ||
| 1 In light of the United Kingdom (UK) leaving the European Union with effect from 1 February 2020, the EU classification has been updated. | |||||||||
| EU14_2020 excl. IRL before February 2020 was formally classified as EU15 excl. IRL & UK. | |||||||||
| EU15-EU27_2020 before February 2020 was formally classified as EU15 to EU28 States. | |||||||||
| Annex Table A1 - Number of persons availing of Activation Programmes | |||
| March 2019 | February 2020 | March 2020 | |
| Back to Work Schemes | |||
| Back to Work Enterprise allowance scheme -self employed strand | 5,764 | 3,930 | 3,786 |
| Short-term Enterprise Allowance1 | 310 | 271 | 276 |
| Total Back to Work payments | 6,074 | 4,201 | 4,062 |
| Other Activation Programmes | |||
| DSP Part-time Job Incentive | 272 | 177 | 158 |
| TUS - Community Work Placement Initiative (2011) | 6,303 | 5,502 | 5,339 |
| Total Other Activation Programmes | 6,575 | 5,679 | 5,497 |
| Community Employment Schemes (excluding Supervisors) | 21,479 | 21,131 | 21,132 |
| SOLAS (FAS) Full Time Training for Unemployed People | 5,641 | 7,880 | 11,191 |
| Back to Education Courses | |||
| Vocational Training Opportunities Scheme (VTOS)2 | 2,947 | 2,704 | 2,704 |
| Back to Education Allowance (BTEA) | 8,633 | 6,867 | 6,847 |
| Total Back to Education Courses3 | 11,580 | 9,571 | 9,551 |
| Total Activation Programmes | 51,349 | 48,462 | 51,433 |
| 1 This scheme was introduced from 1st May 2009. It provides immediate support for someone in receipt of Jobseekers Benefit who wants to start a business. | |||
| 2 Starting from January 2019, VTOS figures for 2018 and 2019 are being supplied directly from the new SOLAS computer system PLSS. VTOS figures were estimated at 5,000 per month to December 2017. | |||
| 3 BTEA figures include all schemes but participants from JA & JB are not entitled to BTEA during the summer holidays. Includes MOMENTUM participants from February 2013. | |||
| Table A2 Number of persons on the Live Register and number in receipt of the Pandemic Unemployment Payment, and the Temporary COVID-19 Wage Subsidy Scheme | ||||
| Category | Live Register | Pandemic Unemployment Payment | Temporary COVID-19 Wage Subsidy Scheme | |
| April 2020 | Males | |||
| Under 25 years of age | 14,281 | 63,286 | 30,982 | |
| 25 years of age and over | 104,951 | 280,757 | 220,724 | |
| Total | 119,232 | 344,043 | 251,706 | |
| Females | ||||
| Under 25 years of age | 11,317 | 58,928 | 27,102 | |
| 25 years of age and over | 84,192 | 199,136 | 146,396 | |
| Total | 95,509 | 258,064 | 173,498 | |
| All Persons | ||||
| Under 25 years of age | 25,598 | 122,214 | 58,084 | |
| 25 years of age and over | 189,143 | 479,893 | 367,120 | |
| Total | 214,741 | 602,107 | 425,204 | |
| March 20201 | Males | |||
| Under 25 years of age | 13,074 | 28,405 | 2,932 | |
| 25 years of age and over | 100,194 | 107,583 | 9,540 | |
| Total | 113,268 | 135,988 | 12,472 | |
| Females | ||||
| Under 25 years of age | 10,323 | 36,641 | 6,281 | |
| 25 years of age and over | 81,618 | 110,500 | 6,351 | |
| Total | 91,941 | 147,141 | 12,632 | |
| All Persons | ||||
| Under 25 years of age | 23,397 | 65,046 | 9,213 | |
| 25 years of age and over | 181,812 | 218,083 | 15,891 | |
| Total | 205,209 | 283,129 | 25,104 | |
| Source: Department of Employment Affairs and Social Protection and Revenue Commissioners | ||||
| 1Revised | ||||
The Live Register is compiled from returns made for each local office to the Central Statistics Office by the Department of Employment Affairs and Social Protection (DEASP). It comprises of persons under 65 years of age in the following classes:
The Live Register excludes those claimants on Jobseeker schemes who are 65 years of age and over. There was no change to this exclusion criterion with the removal of the State Pension (Transition) Scheme from 1st January 2014. Persons aged 65 years can remain on a Jobseeker scheme up to their next birthday but are not included in the Live Register.
Prior to January 2017, the DEASP provided tabulated claimant counts directly to the CSO to facilitate production of the Live Register. These claimant counts were grouped by age, gender, occupation, nationality, duration, region, county and local welfare office. Data provided in this fashion is available from 1967 to December 2016.
Beginning with January 2017, the Live Register has been produced using claimant microdata from the DEASP Integrated Short Term Scheme (ISTS) database. Claimants are determined to be on the Live Register if they fulfil the Live Register criteria and such persons are summarised and cross-tabulated to produce the counts published in the Live Register release.
As claimant count microdata was retrospectively available to January 2012, previously published Live Register data for this period were revised with data produced from the claimant microdata. These revisions were generally minor in nature and are included in this release as well as all relevant Statbank tables.
The reference periods for the Live Register results are as follows
April 2020 – 29th March 2020 to 2nd May 2020
March 2020 - 1st March 2020 to 28th March 2020
April 2019 - 31st March 2019 to 27th April 2019
From May 2015 (reference period) the reference period refers to the week of the last Thursday in the month, previously the reference period referred to the week of the last Friday in the month.
The Live Register is not designed to measure unemployment. It includes part-time (those who work up to three days a week), seasonal and casual workers entitled to Jobseekers Allowance and or Jobseekers Benefit. Monthly unemployment is measured by the Monthly Unemployment release and quarterly unemployment is measured by the Labour Force Survey (formerly the Quarterly National Household Survey).
The Standardised Unemployment Rate (SUR) series, previously in Table 3, has been discontinued from May 2015. It has been replaced by the Monthly Unemployment series, which is published two days before the Live Register.
The Labour Force Survey (LFS), was launched in January 2018 with the publication of Quarter 3 2017 data (Q3 2017). The Labour Force survey replaced the Quarterly National Household Survey (QNHS).
The LFS provides quarterly estimates of the unemployment rate.
The calendar reference quarters for survey results are:
Q1 - January to March, Q2 - April to June, Q3 - July to September and Q4 - October to December.
Since January 2011 the seasonal adjustment of the Live Register is completed by applying the X-12-ARIMA model, developed by the U.S. Census Bureau. Seasonal adjustment is conducted using the indirect approach, where each individual series is independently adjusted (male under 25 years, female under 25 years, male 25 years and over and female 25 years and over). To preserve consistency between the individual and aggregate series, the series for gender, age group and total Live Register are then created from these four component series.
The X-12 ARIMA method has the X-11 moving averages process at its core, but builds on this by providing options for pre-treating the series using a regARIMA approach for prior adjustment and series extension. In essence this methodology will estimate seasonal factors while taking account of temporary changes, outliers, level shifts and calendar effects (e.g timing of Easter).
All Live Register series are updated monthly with the latest three years of seasonally adjusted data as part of the concurrent approach. The comprehensive annual review contains revisions to the entire series. Revisions to the series are typically very minor in scale.
Seasonally adjusting the Live Register series during the Covid-19 crisis period will be challenging until the scale and shape of its impact on the time series is better understood. This initial seasonally adjusted result might be revised for some months ahead as future observations become available. Users should be aware that there is increases uncertainty around the seasonally adjusted figures during this period.
For additional information on the use of X-12-ARIMA see detailed note in the January 2011 Live Register release.
Prior to 19 January 2004 Jobseeker’s Benefit was payable for 15 months (390 days).
From 19 January 2004, Jobseeker’s Benefit could be paid for a maximum of 15 months (390 days) to people who had at least 260 paid PRSI contributions. Jobseeker’s Benefit could be paid for a maximum of 12 months (312 days) to people who had less than 260 paid contributions (Refers to new claims).
From 15 October 2008, Jobseeker’s Benefit could be paid for a maximum of 12 months (312 days) to people who had at least 260 paid PRSI contributions. Jobseeker’s Benefit could be paid for a maximum of 9 months (234 days) to people who had less than 260 paid contributions.
As of 3 April 2013, Jobseeker’s Benefit can be paid for a maximum of 9 months (234 days) to people who have 260 paid PRSI contributions. Jobseeker’s Benefit can be paid for a maximum of 6 months (156 days) to people who have less than 260 paid contributions (Refers to new claims).
Claimants getting Jobseeker’s Benefit for 6 months or more on 3 April 2013 (or 3 months for people with fewer than 260 contributions) will not be affected.
The One-Parent Family Payment is a social welfare payment for men and women who are younger than 66 and bring up children without the support of a partner and meet certain other criteria. Claimants on this scheme are not counted as part of the Live Register.
From July 2013 new rules came into operation reducing the age limits for the One-Parent Family Payment. This means that some people no longer qualify for the payment and may avail of other schemes or supports.
As a consequence, approximately 2,800 people in July 2013, 1,300 people in July 2014 and 2,786 people in July 2015, previously receiving the One-Parent Family Payment, made a claim for Jobseekers Allowance (JA) and will therefore appear on the Live Register.
For information on the age-related changes to the OFP scheme from July 2013, please see the following link to the DEASP website:
http://www.welfare.ie/en/Pages/278_One-Parent-Family-Payment.aspx
Live Register flows are calculated by analysing persons on the Live Register in the reference week of the reference month compared to those on the Live Register in the reference week of the previous month. The flows are calculated as follows:
Joined Live Register: Persons on the Live Register in the reference week of the current month who were not present on the Live Register in the reference week of the previous month.
Stayed on Live Register: Persons on the Live Register in the reference week of the current month who were also present on the Live Register in the reference week of the previous month.
Left Live Register: Persons not on the Live Register in the reference week of the current month who were present on the Live Register in the reference week of the previous month.
Inflows and outflows published in this release relate to persons moving on or off the Live Register. Inter-scheme movement is not counted as a Live Register flow. For example, if a claimant exhausts his/her entitlement to JB and opens a new JA claim, this is not counted as an outflow in JB and an inflow in JA. The person has moved scheme but has not joined nor left the Live Register. Thus, those persons who move schemes from one month to the next are counted as “Stayed on the Live Register”.
The basis of the area analysis in Live Register statistics is the DEASP local office of registration. The areas served by Local Employment Offices do not correspond to specific geographic boundaries. Therefore, registrants at a given local office do not necessarily come from a particular region or area which can be precisely delineated e.g. data for the Cork City Local Offices of Registration refers to all persons signing on in Cork City but may include persons not resident in Cork City.
From January 2018, registrations which have yet not being assigned to a DEASP local office of registration are included in the Live Register totals. Therefore as these registrations are not included in the regional breakdowns, the sum of these regions may not add to the Live Register totals.
The latest available Live Register data by Province, County and Local Office of Registration are published on the CSO website, through the CSO StatBank, on the publication of this release, see link here.
The regional classifications in this release is based on the NUTS (Nomenclature of Territorial Units) classification used by Eurostat. Until Q4 2017, the NUTS3 regions corresponded to the eight Regional Authorities established under the Local Government Act, 1991 (Regional Authorities) (Establishment) Order, 1993, which came into operation on 1 January 1994 while the NUTS2 regions, which were proposed by Government and agreed by Eurostat in 1999, were groupings of those historic NUTS3 regions.
However, the NUTS3 boundaries were amended on 21st of November 2016 under Regulation (EC) No. 2066/2016 and have come into force from Q1 2018. These new groupings are reflected in the LFS results from Q1 2018 onwards. The changes resulting from the amendment are that County Louth has moved from the Border to the Mid-East and what was formerly South Tipperary has moved from the South-East to the Mid-West, resulting in the new NUTS2 and NUTS3 regions:
| Northern & Western NUTS2 Region | Southern NUTS2 Region | Eastern & Midland NUTS2 Region | |||
| Border | Cavan | Mid-West | Clare | Dublin | Dublin City |
| Donegal | Limerick City & County | Dun Laoghaire-Rathdown | |||
| Leitrim | Tipperary | Fingal | |||
| Monaghan | South Dublin | ||||
| Sligo | |||||
| South-East | Carlow | Mid-East | Kildare | ||
| West | Galway City | Kilkenny | Meath | ||
| Galway County | Waterford City & County | Wicklow | |||
| Mayo | Wexford | Louth | |||
| Roscommon | |||||
| Midland | Laois | ||||
| South-West | Cork City | Longford | |||
| Cork County | Offaly | ||||
| Kerry | Westmeath | ||||
Live Register occupational data is sourced from information collected by the DEASP on the most recent occupation of claimants when they sign on the Live Register. The classification used is based on the UK Standard Occupational Classification (SOC). “No occupation” is an additional category and includes those who have never worked and those who have no stated occupation.
Detailed tables relating to regional and scheme data are available on the CSO website through the CSO Main Data Dissemination Service, StatBank, to see these please click here
The number of claimants on the Live Register who work on a casual and /or part-time basis is supplied by the DEASP. People who work for part of a week may be eligible for Jobseeker’s Benefit or Jobseeker’s Allowance and may also be included on the Live Register, if the DEASP is satisfied that they are not in full-time employment, are available for work and are looking for full-time employment.
Data in the nationality grouping table is sourced from information collected by the DEASP on the nationality of claimants when they first sign on the Live Register.
For further information or assistance use the contact details below or e-mail labour@cso.ie
 Hide Background Notes
Scan the QR code below to view this release online or go to
http://www.cso.ie/en/releasesandpublications/er/lr/liveregisterapril2020/
 Show Table 1(a) Total persons on the Live Register
 Hide Table 1(a) Total persons on the Live Register