
| Households with internet access | ||||||||
| % of households | ||||||||
| 2010 | 2011 | 2012 | 2013 | 2014 | 2015 | 2016 | 2017 | 2018 |
| 72 | 78 | 81 | 82 | 82 | 85 | 87 | 89 | 89 |
Summary of main findings:
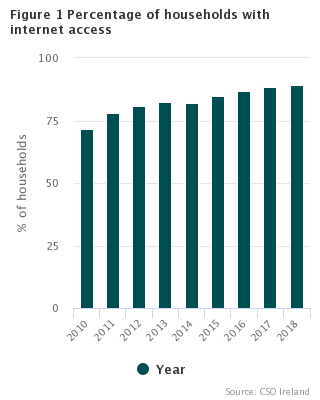
In 2018, 89% of households have an internet connection, unchanged from 2017, but an increase of seventeen percentage points since 2010. Data for 2018 indicates that fixed broadband is the most common type of internet access in the household (82% compared with 52% using mobile broadband). Internet access via narrow broadband connection was just 1%. Note that more than one type of internet connection may be used in households. See tables 1a and 1b and figure 1.
Fixed broadband connection is highest in the Dublin region at 90%, compared with the Border and Midlands regions, at 69% and 67% respectively. See table 1b and figure 2.
There is a notable difference in fixed broadband connection between deprivation quintiles. Fixed broadband connection is most common for households in the Fifth quintile - very affluent deprivation quintile and its prevalence gradually decreases as the level of deprivation increases. Just over three quarters (76%) of households in the First quintile - very disadvantaged deprivation quintile with internet access have fixed broadband connection. Mobile broadband internet connection is most common in households with internet access in the lower deprivation quintiles - 63% and 60% respectively for households with internet access in the First quintile - very disadvantaged and Second quintile - disadvantaged deprivation quintiles. By comparison, mobile broadband connection for households in the Fifth quintile - very affluent deprivation quintile is just 41%. See table 1b.
In 2018, of the 11% of households with no internet access, 40% reported that the reason for no household internet access was that they Do not need internet, while for three in every ten (30%), this was due to a Lack of skills and 8% have Access to the internet elsewhere. Other barriers reported included Broadband internet not available in the area (6%), Equipment costs too high (5%) and Access costs too high (3%). See table 1c.
| Table 1(a) Households with internet access, 2010 to 2018 | |||||||||||||||||||
| % of households | |||||||||||||||||||
| 2010 | 2011 | 2012 | 2013 | 2014 | 2015 | 2016 | 2017 | 2018 | |||||||||||
| % | Unweighted sample | % | Unweighted sample | % | Unweighted sample | % | Unweighted sample | % | Unweighted sample | % | Unweighted sample | % | Unweighted sample | % | Unweighted sample | % | Unweighted sample | ||
| State | 72 | 7,826 | 78 | 6,365 | 81 | 10,018 | 82 | 10,283 | 82 | 9,629 | 85 | 9,150 | 87 | 8,261 | 89 | 7,885 | 89 | 5,291 | |
| Household composition | |||||||||||||||||||
| 1 adult, no dependent children | 42 | 1,478 | 51 | 1,169 | 55 | 1,714 | 55 | 1,810 | 56 | 1,731 | 60 | 1,702 | 66 | 1,631 | 66 | 1,424 | 68 | 1,296 | |
| 2 adults no dependent children | 66 | 2,139 | 72 | 1,727 | 74 | 2,771 | 78 | 2,686 | 76 | 2,879 | 81 | 2,475 | 85 | 1,714 | 86 | 1,609 | 87 | 1,501 | |
| 3 or more adults no dependent children | 85 | 1,214 | 88 | 1,033 | 90 | 1,576 | 92 | 1,534 | 94 | 1,624 | 95 | 1,463 | 87 | 1,295 | 90 | 1,301 | 97 | 644 | |
| 1 adult with dependent children | 61 | 404 | 76 | 336 | 78 | 500 | 82 | 532 | 86 | 404 | 88 | 361 | 93 | 530 | 95 | 494 | 96 | 190 | |
| 2 adults with dependent children | 87 | 1,945 | 93 | 1,592 | 95 | 2,551 | 95 | 2,775 | 96 | 2,205 | 97 | 2,314 | 98 | 2,487 | 99 | 2,429 | 99 | 1,275 | |
| 3 or more adults with dependent children | 90 | 646 | 95 | 508 | 96 | 906 | 95 | 946 | 95 | 786 | 96 | 835 | 97 | 604 | 98 | 628 | 99 | 385 | |
| Region | |||||||||||||||||||
| Border | 60 | 874 | 66 | 602 | 75 | 1,205 | 75 | 1,154 | 75 | 1,090 | 83 | 910 | 82 | 988 | 83 | 875 | 85 | 795 | |
| Midlands | 66 | 448 | 79 | 321 | 74 | 593 | 82 | 626 | 80 | 622 | 84 | 568 | 85 | 494 | 86 | 398 | 86 | 362 | |
| West | 70 | 890 | 79 | 670 | 82 | 896 | 81 | 970 | 78 | 877 | 79 | 731 | 84 | 662 | 84 | 755 | 88 | 602 | |
| Dublin | 78 | 1,642 | 84 | 1,486 | 86 | 2,132 | 87 | 2,390 | 88 | 2,642 | 90 | 2,617 | 91 | 2,383 | 94 | 2,304 | 94 | 1,301 | |
| Mid-East | 81 | 843 | 87 | 545 | 87 | 776 | 86 | 1,062 | 86 | 1,008 | 87 | 1,039 | 89 | 575 | 92 | 846 | 92 | 377 | |
| Mid-West | 73 | 874 | 77 | 759 | 79 | 1,085 | 80 | 1,025 | 80 | 762 | 86 | 797 | 87 | 789 | 86 | 682 | 88 | 523 | |
| South-East | 65 | 1,087 | 71 | 902 | 79 | 1,424 | 81 | 1,301 | 79 | 1,069 | 80 | 968 | 85 | 848 | 87 | 937 | 86 | 547 | |
| South-West | 70 | 1,168 | 76 | 1,080 | 78 | 1,907 | 81 | 1,755 | 80 | 1,559 | 82 | 1,520 | 86 | 1,522 | 88 | 1,088 | 88 | 784 | |
| Note 1: Data are subject to sampling and other survey errors, which are relatively greater in respect of smaller values. | |||||||||||||||||||
| Note 2: Households represent all private households with at least one occupant aged 16-74. | |||||||||||||||||||
| Region | Fixed broadband | Mobile broadband | Narrowband connection |
|---|---|---|---|
| Border | 69.34 | 54.92 | 0.67 |
| Midlands | 67.42 | 49.37 | 1.36 |
| West | 70.88 | 46.36 | 3.38 |
| Dublin | 89.64 | 54.82 | 0.73 |
| Mid-East | 85.79 | 60.99 | 1.47 |
| Mid-West | 78.41 | 63.34 | 0.27 |
| South-East | 81.79 | 39.85 | 1.16 |
| South-West | 82.36 | 49.74 | 0.18 |
| Table 1(b) Households with internet access classified by type of internet access and characteristics of the household, 2018 | |||||||
| % of households | |||||||
| Fixed broadband1 | Mobile broadband2 | Narrowband connection3 | Type of connection unknown | Unweighted sample | |||
| State | 82 | 52 | 1 | 0 | 4,410 | ||
| Household composition | |||||||
| 1 adult, no dependent children | 76 | 51 | 1 | 1 | 740 | ||
| 2 adults no dependent children | 80 | 51 | 1 | 0 | 1,238 | ||
| 3 or more adults no dependent children | 82 | 56 | 1 | 0 | 614 | ||
| 1 adult with dependent children | 76 | 57 | . | 0 | 179 | ||
| 2 adults with dependent children | 85 | 52 | 1 | 0 | 1,258 | ||
| 3 or more adults with dependent children | 86 | 52 | 1 | 0 | 381 | ||
| Deprivation quintile | |||||||
| First quintile - very disadvataged | 76 | 63 | 2 | 0 | 885 | ||
| Second quintile - disadvantaged | 78 | 60 | 0 | 1 | 829 | ||
| Third quintile - average | 81 | 45 | 0 | 0 | 887 | ||
| Fourth quintile - affluent | 82 | 52 | 2 | 0 | 977 | ||
| Fifth quintile - very affluent | 90 | 41 | 0 | 0 | 832 | ||
| Region | |||||||
| Border | 69 | 55 | 1 | 0 | 600 | ||
| Midlands | 67 | 49 | 1 | 0 | 283 | ||
| West | 71 | 46 | 3 | 1 | 479 | ||
| Dublin | 90 | 55 | 1 | 0 | 1,191 | ||
| Mid-East | 86 | 61 | 1 | 0 | 329 | ||
| Mid-West | 78 | 63 | 0 | 0 | 438 | ||
| South-East | 82 | 40 | 1 | 1 | 440 | ||
| South-West | 82 | 50 | 0 | 0 | 650 | ||
| 1Examples include e.g. DSL, ADSL, VDSL, cable, optical fibre, satellite, public Wi-Fi connections. | |||||||
| 2Connection via mobile phone network with minimum 3G. e.g. UMTS, using (SIM) or USB key, mobile phone or smartphone as modem. | |||||||
| 3Either mobile or fixed connection. Examples include less than 3G, GPRS, dial-up access over older type telephone. | |||||||
| Note 1: Data are subject to sampling and other survey errors, which are relatively greater in respect of smaller values. | |||||||
| Note 2: Households represent all private households with at least one occupant aged 16-74. | |||||||
| Note 3: More than one type of internet access may be given by households. | |||||||
| Table 1(c) Households without internet access classified by reasons for not having household internet access, 2018 | |||||||||||||
| Do not need internet | Lack of skills | Access to internet elsewhere | Broadband internet not available in the area | Equipment costs too high | Access costs too high | Privacy/ security concerns | Other | Unweighted sample | |||||
| State | 40 | 30 | 8 | 6 | 5 | 3 | 1 | 7 | 881 | ||||
| Household composition | |||||||||||||
| 1 adult, no dependent children | 39 | 34 | 8 | 4 | 3 | 4 | 1 | 7 | 556 | ||||
| 2 adults no dependent children | 44 | 27 | 10 | 8 | 4 | 1 | 0 | 6 | 263 | ||||
| 3 or more adults no dependent children | * | * | * | * | * | * | * | * | 29 | ||||
| 1 adult with dependent children | * | * | * | * | * | * | * | * | 12 | ||||
| 2 adults with dependent children | 35 | 26 | 14 | 2 | 14 | 9 | . | 1 | 17 | ||||
| 3 or more adults with dependent children | * | * | * | * | * | * | * | * | 4 | ||||
| Deprivation quintile | |||||||||||||
| First quintile - very disadvataged | 46 | 33 | 2 | 1 | 6 | 3 | 1 | 9 | 288 | ||||
| Second quintile - disadvantaged | 41 | 28 | 11 | 8 | 2 | 1 | 0 | 8 | 221 | ||||
| Third quintile - average | 44 | 30 | 3 | 7 | 4 | 5 | 2 | 6 | 190 | ||||
| Fourth quintile - affluent | 21 | 31 | 21 | 9 | 8 | 5 | 0 | 5 | 127 | ||||
| Fifth quintile - very affluent | 47 | 31 | 7 | 2 | 3 | 0 | 0 | 11 | 55 | ||||
| Region | |||||||||||||
| Border | 48 | 16 | 7 | 10 | 7 | 3 | 0 | 10 | 195 | ||||
| Midlands | 50 | 25 | 0 | 5 | 4 | 5 | 0 | 12 | 79 | ||||
| West | 61 | 5 | 2 | 15 | 3 | 4 | 0 | 10 | 123 | ||||
| Dublin | 30 | 25 | 25 | 5 | 5 | 1 | 1 | 8 | 110 | ||||
| Mid-East | [27] | [40] | [9] | [8] | [4] | [7] | [0] | [5] | 48 | ||||
| Mid-West | 59 | 4 | 12 | 0 | 7 | 0 | 0 | 19 | 85 | ||||
| South-East | 43 | 22 | 4 | 4 | 11 | 6 | 0 | 11 | 107 | ||||
| South-West | 31 | 50 | 7 | 4 | 3 | 3 | 2 | 2 | 134 | ||||
| Note 1: Data are subject to sampling and other survey errors, which are relatively greater in respect of smaller values. | |||||||||||||
| Note 2: Households represent all private households with at least one occupant aged 16-74. | |||||||||||||
| Note 3: More than one reason may have been given by respondents. | |||||||||||||
| Note 4: * Sample occurrence too small for estimation, i.e., less than 30. | |||||||||||||
| Note 5: Figures in parentheses [ ] indicate percentages based on small numbers (sample size 30 to 49), and are, therefore, subject to a wide margin of error. | |||||||||||||
In 2018, an estimated 82% of individuals used the internet in the three months prior to the interview, while 16% of individuals have never used the internet. See table 2a and figure 3.
The percentage of individuals in the 16 to 29 and 30 to 44 years age groups who recently used the internet (within the previous three months) was twice the corresponding figure for persons aged 60 to 74 years - 97% compared with 48% respectively. Marginally more females than males used the internet with the three months prior to interview - 83% compared with 82% of males. This follows the same trend as in previous years. See table 2a.
| Table 2(a) Individuals' use of the internet classified by broad frequency of use, 2012 to 2018 | ||||||||||||||||||||||||||
| % of individuals | ||||||||||||||||||||||||||
| Used within last 3 months | Used but not in the last 3 months | Never used the internet | ||||||||||||||||||||||||
| 2012 | 2013 | 2014 | 2015 | 2016 | 2017 | 2018 | 2012 | 2013 | 2014 | 2015 | 2016 | 2017 | 2018 | 2012 | 2013 | 2014 | 2015 | 2016 | 2017 | 2018 | ||||||
| State | 77 | 78 | 80 | 80 | 82 | 81 | 82 | 5 | 4 | 4 | 3 | 3 | 3 | 2 | 18 | 18 | 16 | 17 | 15 | 16 | 16 | |||||
| Sex | ||||||||||||||||||||||||||
| Male | 77 | 78 | 78 | 79 | 81 | 79 | 82 | 5 | 4 | 4 | 3 | 3 | 3 | 2 | 18 | 18 | 18 | 18 | 16 | 17 | 17 | |||||
| Female | 77 | 79 | 81 | 81 | 83 | 83 | 83 | 5 | 4 | 4 | 4 | 3 | 3 | 3 | 18 | 17 | 15 | 15 | 14 | 14 | 14 | |||||
| Age group | ||||||||||||||||||||||||||
| 16-29 | 92 | 93 | 96 | 95 | 96 | 95 | 97 | 4 | 3 | 2 | 2 | 1 | 1 | 1 | 3 | 5 | 2 | 3 | 2 | 4 | 2 | |||||
| 30-44 | 89 | 90 | 92 | 92 | 94 | 93 | 97 | 4 | 4 | 3 | 3 | 1 | 2 | 1 | 7 | 6 | 5 | 5 | 4 | 5 | 2 | |||||
| 45-59 | 70 | 76 | 74 | 75 | 76 | 79 | 85 | 6 | 5 | 6 | 4 | 4 | 4 | 3 | 24 | 19 | 20 | 21 | 20 | 17 | 12 | |||||
| 60-74 | 40 | 46 | 43 | 45 | 52 | 48 | 48 | 7 | 5 | 6 | 6 | 7 | 6 | 4 | 53 | 49 | 51 | 49 | 41 | 46 | 48 | |||||
| Principal economic status | ||||||||||||||||||||||||||
| At work | 88 | 88 | 88 | 89 | 89 | 89 | 93 | 3 | 3 | 3 | 2 | 2 | 2 | 1 | 9 | 9 | 10 | 9 | 9 | 9 | 6 | |||||
| Unemployed | 73 | 76 | 76 | 76 | 76 | 79 | 88 | 8 | 6 | 8 | 4 | 6 | 3 | 5 | 19 | 18 | 16 | 19 | 19 | 18 | 7 | |||||
| Student | 94 | 98 | 99 | 99 | 99 | 96 | 100 | 3 | 1 | 1 | 0 | 0 | 1 | 0 | 4 | 2 | 0 | 1 | 1 | 3 | 0 | |||||
| Home duties | 63 | 66 | 64 | 64 | 70 | 69 | 72 | 8 | 5 | 7 | 6 | 5 | 4 | 4 | 30 | 29 | 29 | 30 | 25 | 27 | 23 | |||||
| Retired | 50 | 49 | 52 | 51 | 60 | 49 | 49 | 7 | 7 | 6 | 7 | 7 | 7 | 5 | 43 | 44 | 42 | 42 | 33 | 44 | 47 | |||||
| Other | 50 | 51 | 50 | 53 | 57 | 60 | 55 | 8 | 8 | 9 | 6 | 6 | 7 | 7 | 42 | 41 | 41 | 41 | 37 | 33 | 38 | |||||
| Region | ||||||||||||||||||||||||||
| Border | 72 | 70 | 73 | 77 | 75 | 75 | 77 | 6 | 6 | 5 | 4 | 5 | 4 | 3 | 22 | 24 | 22 | 19 | 21 | 21 | 20 | |||||
| Midland | 69 | 76 | 77 | 78 | 80 | 81 | 80 | 5 | 5 | 3 | 3 | 2 | 3 | 4 | 27 | 19 | 19 | 19 | 18 | 17 | 16 | |||||
| West | 75 | 75 | 75 | 75 | 76 | 76 | 81 | 5 | 4 | 5 | 3 | 5 | 3 | 1 | 20 | 21 | 20 | 22 | 20 | 21 | 18 | |||||
| Dublin | 82 | 85 | 87 | 86 | 87 | 87 | 90 | 6 | 4 | 3 | 3 | 2 | 3 | 2 | 13 | 11 | 10 | 11 | 10 | 10 | 8 | |||||
| Mid-East | 84 | 80 | 83 | 82 | 84 | 78 | 85 | 3 | 3 | 2 | 2 | 2 | 3 | 1 | 13 | 17 | 15 | 17 | 14 | 20 | 14 | |||||
| Mid-West | 74 | 76 | 79 | 80 | 83 | 82 | 83 | 6 | 4 | 5 | 4 | 3 | 3 | 2 | 20 | 21 | 16 | 16 | 14 | 15 | 15 | |||||
| South-East | 73 | 75 | 75 | 76 | 82 | 82 | 82 | 5 | 4 | 6 | 4 | 3 | 3 | 3 | 22 | 22 | 20 | 19 | 15 | 15 | 15 | |||||
| South-West | 75 | 78 | 76 | 77 | 80 | 80 | 84 | 6 | 4 | 5 | 4 | 3 | 2 | 2 | 20 | 19 | 20 | 20 | 17 | 17 | 15 | |||||
| Type of household internet connection | ||||||||||||||||||||||||||
| Broadband | 90 | 91 | 91 | 91 | 91 | 91 | 93 | 3 | 2 | 3 | 2 | 2 | 2 | 2 | 8 | 7 | 7 | 7 | 7 | 7 | 5 | |||||
| Narrowband | * | * | * | * | * | * | * | * | * | * | * | * | * | * | * | * | * | * | * | * | * | |||||
| No internet | 18 | 19 | 19 | 13 | 14 | 14 | 16 | 16 | 13 | 11 | 10 | 10 | 10 | 8 | 67 | 69 | 70 | 77 | 77 | 76 | 76 | |||||
| Unknown internet | * | * | * | * | * | * | * | * | * | * | * | * | * | * | * | * | * | * | * | * | * | |||||
| Note 1: Data are subject to sampling and other survey errors, which are relatively greater in respect of smaller values. | ||||||||||||||||||||||||||
| Note 2: Individuals represent all individuals aged 16-74. | ||||||||||||||||||||||||||
| 2016 | 2017 | 2018 | |
| Used within last 3 months | 82.2 | 81.2 | 82.1 |
| Used but not in the last 3 months | 3 | 2.8 | 2.4 |
| Never used the internet | 14.9 | 15.9 | 15.5 |
Almost three quarters (74%) of internet users used the internet every day, an increase of nine percentage points since 2014. Three quarters (75%) of female internet users used the internet daily, compared with 73% of males. Over six out of every ten persons (62%) whose principal economic status was Home duties accessed the internet daily, compared with 51% in 2017. Frequency of internet use increased for all age groups in 2018. Of the 16 to 29 years age category, most internet users (96%) accessed the internet every day - nearly three times the number of daily internet users in the 60 to 74 years age group (33%), although daily internet use of this age cohort had increased marginally by two percentage points from 31% in 2017. By comparison, 92% of internet users in the 30 to 44 years age group accessed the internet daily, an increase of eight percentage points when compared with the same age cohort in 2017. Over half (52%) of internet users in the 60 to 74 years age group did not use the internet within the three months prior to interview. See table 2b.
Daily internet use internet use increased for all regions in 2018. The Dublin region has the highest daily internet use - 84% of individuals accessed the internet every day, an increase of five percentage points on 2017. In the Border over two thirds of internet users accessed the internet daily, an increase of eleven percentage points on the same period in 2017. See table 2b.
In 2018, respondents who used the internet daily were asked if they used the internet several times during the day. Over two thirds (68%) use the internet several times a day. Students were the most frequent users of the internet - 98% of all Students accessed the internet several times during the day. By comparison, just over one quarter (26%) of Retired persons accessed the internet many times a day. Nearly four fifths (78%) of individuals who used the internet several times a day, have a broadband household internet connection. See table 2b.
| Table 2(b) Individuals' use of the internet classified by detailed frequency of use, 2014 to 2018 | |||||||||||||||||||||||||||
| % of individuals | |||||||||||||||||||||||||||
| Several times a day1 | Every day | At least once a week (but not every day) | At least once a month (but not every week) | Didn't use in last 3 months | |||||||||||||||||||||||
| 2018 | 2014 | 2015 | 2016 | 2017 | 2018 | 2014 | 2015 | 2016 | 2017 | 2018 | 2014 | 2015 | 2016 | 2017 | 2018 | 2014 | 2015 | 2016 | 2017 | 2018 | |||||||
| State | 68 | 65 | 67 | 70 | 70 | 74 | 12 | 11 | 10 | 9 | 6 | 3 | 3 | 3 | 2 | 2 | 21 | 20 | 18 | 19 | 18 | ||||||
| Sex | |||||||||||||||||||||||||||
| Male | 68 | 64 | 66 | 69 | 69 | 73 | 12 | 11 | 9 | 8 | 7 | 3 | 3 | 3 | 2 | 2 | 21 | 21 | 19 | 21 | 19 | ||||||
| Female | 69 | 66 | 68 | 70 | 71 | 75 | 12 | 11 | 10 | 9 | 5 | 4 | 2 | 3 | 3 | 3 | 19 | 19 | 17 | 17 | 18 | ||||||
| Age group | |||||||||||||||||||||||||||
| 16-29 | 94 | 86 | 90 | 92 | 92 | 96 | 7 | 4 | 4 | 3 | 1 | 2 | 1 | 1 | 1 | 0 | 4 | 5 | 4 | 5 | 3 | ||||||
| 30-44 | 87 | 77 | 79 | 84 | 84 | 92 | 12 | 11 | 9 | 7 | 4 | 3 | 2 | 1 | 2 | 1 | 8 | 8 | 6 | 7 | 4 | ||||||
| 45-59 | 65 | 54 | 56 | 59 | 63 | 72 | 15 | 15 | 13 | 13 | 10 | 5 | 4 | 4 | 4 | 3 | 26 | 25 | 24 | 21 | 15 | ||||||
| 60-74 | 26 | 26 | 29 | 32 | 31 | 33 | 12 | 12 | 13 | 12 | 9 | 4 | 4 | 7 | 5 | 6 | 57 | 55 | 48 | 52 | 52 | ||||||
| Principal economic status | |||||||||||||||||||||||||||
| At work | 81 | 74 | 76 | 79 | 80 | 86 | 11 | 11 | 9 | 8 | 5 | 3 | 2 | 2 | 2 | 1 | 12 | 11 | 11 | 11 | 7 | ||||||
| Unemployed | 74 | 56 | 61 | 61 | 65 | 80 | 16 | 13 | 11 | 9 | 8 | 5 | 3 | 4 | 4 | 0 | 24 | 24 | 24 | 21 | 12 | ||||||
| Student | 98 | 94 | 98 | 96 | 94 | 99 | 4 | 1 | 2 | 2 | 0 | 1 | 0 | 0 | 0 | 0 | 1 | 1 | 1 | 4 | 0 | ||||||
| Home duties | 55 | 45 | 47 | 52 | 51 | 62 | 15 | 14 | 13 | 14 | 9 | 5 | 3 | 5 | 4 | 6 | 36 | 36 | 30 | 31 | 51 | ||||||
| Retired | 26 | 34 | 34 | 37 | 32 | 34 | 15 | 13 | 15 | 12 | 8 | 4 | 5 | 7 | 5 | 3 | 48 | 49 | 41 | 51 | 28 | ||||||
| Other | 42 | 31 | 40 | 40 | 47 | 46 | 13 | 9 | 12 | 9 | 7 | 7 | 3 | 5 | 5 | 2 | 50 | 47 | 43 | 40 | 45 | ||||||
| Region | |||||||||||||||||||||||||||
| Border | 64 | 55 | 60 | 57 | 57 | 68 | 13 | 14 | 13 | 12 | 6 | 6 | 4 | 5 | 6 | 3 | 27 | 23 | 25 | 25 | 23 | ||||||
| Midland | 65 | 64 | 66 | 67 | 66 | 73 | 10 | 7 | 10 | 13 | 5 | 4 | 5 | 3 | 2 | 2 | 23 | 23 | 20 | 19 | 20 | ||||||
| West | 67 | 60 | 59 | 61 | 65 | 73 | 13 | 13 | 13 | 10 | 5 | 2 | 3 | 2 | 2 | 2 | 25 | 25 | 24 | 24 | 20 | ||||||
| Dublin | 81 | 74 | 76 | 77 | 79 | 84 | 10 | 8 | 7 | 6 | 5 | 3 | 2 | 3 | 2 | 1 | 13 | 14 | 13 | 13 | 10 | ||||||
| Mid-East | 69 | 65 | 68 | 72 | 65 | 75 | 14 | 12 | 9 | 10 | 10 | 4 | 2 | 3 | 3 | 2 | 17 | 19 | 16 | 22 | 13 | ||||||
| Mid-West | 71 | 61 | 64 | 69 | 68 | 75 | 13 | 13 | 11 | 11 | 7 | 5 | 3 | 3 | 4 | 2 | 21 | 20 | 17 | 18 | 17 | ||||||
| South-East | 70 | 61 | 62 | 70 | 73 | 74 | 11 | 12 | 9 | 7 | 6 | 3 | 2 | 3 | 2 | 2 | 25 | 24 | 18 | 18 | 18 | ||||||
| South-West | 71 | 62 | 65 | 68 | 72 | 77 | 11 | 10 | 10 | 7 | 5 | 3 | 2 | 2 | 2 | 2 | 24 | 24 | 20 | 20 | 16 | ||||||
| Type of internet connection | |||||||||||||||||||||||||||
| Broadband | 78 | 75 | 77 | 77 | 77 | 84 | 13 | 12 | 11 | 11 | 7 | 3 | 3 | 3 | 3 | 2 | 9 | 9 | 9 | 10 | 7 | ||||||
| Narrowband | * | 67 | 70 | 69 | 71 | * | 16 | 15 | 14 | 17 | * | 2 | 5 | 4 | 4 | * | 15 | 10 | 15 | 8 | * | ||||||
| No internet | 11 | 9 | 7 | 8 | 8 | 12 | 6 | 4 | 4 | 3 | 2 | 5 | 2 | 2 | 3 | 1 | 81 | 87 | 86 | 86 | 84 | ||||||
| Unknown internet | * | 26 | 20 | * | * | * | 14 | 12 | * | * | * | 5 | 1 | * | * | * | 55 | 67 | * | * | * | ||||||
| 1This was a new question introduced in 2018 for persons who use the internet every day so there is no corresponding data for previous years. | |||||||||||||||||||||||||||
| Note 1: Data are subject to sampling and other survey errors, which are relatively greater in respect of smaller values. | |||||||||||||||||||||||||||
| Note 2: Individuals represent all individuals aged 16-74 who use the internet. | |||||||||||||||||||||||||||
| Note 3: * Sample occurrence too small for estimation, i.e., less than 30. | |||||||||||||||||||||||||||
Mobile phones or smartphones were used to access the internet by 86% of individuals in 2018, with over 93% of individuals aged 16 to 44 years doing so versus just 56% of persons in the 60 to 74 years age group. In the Dublin region, 93% of individuals who used the internet in the last three months, used a mobile phone or smartphone. Use of tablets for internet access has increased six percentage points since 2016 - 43% in 2018 compared with 37% in 2016. Nearly one quarter (24%) of individuals who recently used the internet (in the previous three months) used a desktop computer. Note that respondents may use multiple devices to access the internet. See table 2c.
| Table 2(c) Individuals who recently used the internet (in the last 3 months) classified by type of device used, 2016 and 2018 | |||||||||||||||||||||
| % of individuals | |||||||||||||||||||||
| Desktop computer | Laptop | Tablet | Mobile phone or smartphone | Other mobile devices1 | Smart TV2 | ||||||||||||||||
| 2016 | 2018 | 2016 | 2018 | 2016 | 2018 | 2016 | 2018 | 2016 | 2018 | 2016 | 2018 | Sample 2018 | |||||||||
| State | 25 | 24 | 67 | 56 | 37 | 43 | 84 | 86 | 5 | 10 | 8 | 20 | 4,044 | ||||||||
| Sex | |||||||||||||||||||||
| Male | 29 | 27 | 70 | 62 | 36 | 42 | 84 | 86 | 7 | 12 | 9 | 21 | 1,713 | ||||||||
| Female | 22 | 22 | 65 | 52 | 39 | 44 | 84 | 86 | 3 | 8 | 6 | 18 | 2,331 | ||||||||
| Age group | |||||||||||||||||||||
| 16-29 | 18 | 22 | 68 | 56 | 33 | 36 | 96 | 93 | 6 | 15 | 7 | 22 | 465 | ||||||||
| 30-44 | 27 | 25 | 68 | 58 | 43 | 50 | 92 | 95 | 6 | 12 | 10 | 26 | 1,396 | ||||||||
| 45-59 | 30 | 27 | 68 | 56 | 36 | 43 | 75 | 83 | 4 | 7 | 6 | 16 | 1,244 | ||||||||
| 60-74 | 28 | 22 | 62 | 54 | 34 | 40 | 52 | 56 | 2 | 4 | 3 | 6 | 939 | ||||||||
| Region | |||||||||||||||||||||
| Border | 17 | 22 | 65 | 55 | 38 | 39 | 79 | 85 | 3 | 8 | 7 | 14 | 536 | ||||||||
| Midland | 23 | 17 | 69 | 46 | 41 | 43 | 89 | 82 | 6 | 8 | 5 | 12 | 264 | ||||||||
| West | 22 | 30 | 71 | 57 | 35 | 42 | 82 | 88 | 3 | 9 | 8 | 21 | 444 | ||||||||
| Dublin | 31 | 33 | 70 | 70 | 42 | 49 | 88 | 93 | 8 | 16 | 12 | 27 | 1,071 | ||||||||
| Mid-East | 23 | 22 | 64 | 59 | 41 | 43 | 84 | 88 | 7 | 10 | 6 | 18 | 320 | ||||||||
| Mid-West | 24 | 30 | 66 | 62 | 28 | 41 | 84 | 85 | 3 | 12 | 4 | 26 | 408 | ||||||||
| South-East | 20 | 26 | 65 | 58 | 31 | 46 | 83 | 88 | 2 | 13 | 4 | 30 | 412 | ||||||||
| South-West | 28 | 30 | 66 | 65 | 34 | 43 | 81 | 86 | 3 | 10 | 4 | 23 | 589 | ||||||||
| 1Examples include media or games player, e-book reader, smart watch, etc. | |||||||||||||||||||||
| 2TV that is directly connected to the internet e.g. via WI‐Fi and not connected via a separate internet enabled device | |||||||||||||||||||||
| Note 1: Data are subject to sampling and other survey errors, which are relatively greater in respect of smaller values. | |||||||||||||||||||||
| Note 2: Individuals represent all individuals aged 16-74 who used the internet in the last 3 months. | |||||||||||||||||||||
| Note 3: More than one type of device used may have been given by respondents. | |||||||||||||||||||||
Mobile phones or smartphones were used to access the internet away from home or work by 85% of individuals in 2018, either via the mobile phone network and/or a the wireless network. The most common form of accessing the internet by mobile phone or smartphone when away from home or work was via the mobile phone network (72%), access via a wireless network (such as Wi-Fi) was 60%. This follows a similar trend for portable computers. When using laptops or tablets to access the internet, the wireless network is the more common option, with 18% of individuals access the internet on laptops using the wireless network, compared with 14% of internet users using tablets. Note that respondents may use multiple devices to access the internet away from home or work. See table 2d.
Just 11% of internet users did not access the internet via any mobile device when away from home or work. See table 2d.
| Table 2(d) Individuals who recently used the internet (in the last 3 months) away from home or work classified by type of device used, 2018 | |||||||||||||||||
| % of individuals | |||||||||||||||||
| Mobile phone (or smartphone) | Mobile phone (or smartphone) via mobile phone network | Mobile phone (or smartphone) via wireless network | Laptop | Laptop via mobile phone network | Laptop via wireless network | Tablet | Tablet via mobile phone network | Tablet via wireless network | Other devices | Didn't access the internet via mobile device away from home or work | Unweighted sample | ||||||
| State | 85 | 72 | 60 | 20 | 7 | 18 | 16 | 5 | 14 | 3 | 11 | 4,044 | |||||
| Sex | |||||||||||||||||
| Male | 86 | 75 | 62 | 25 | 10 | 21 | 17 | 6 | 14 | 3 | 11 | 1,713 | |||||
| Female | 83 | 70 | 59 | 16 | 5 | 14 | 15 | 5 | 14 | 3 | 12 | 2,331 | |||||
| Age group | |||||||||||||||||
| 16-29 | 94 | 82 | 71 | 26 | 8 | 25 | 9 | 2 | 8 | 4 | 3 | 465 | |||||
| 30-44 | 94 | 80 | 65 | 20 | 8 | 17 | 20 | 7 | 17 | 3 | 5 | 1,396 | |||||
| 45-59 | 80 | 68 | 56 | 17 | 7 | 15 | 18 | 6 | 17 | 3 | 15 | 1,244 | |||||
| 60-74 | 53 | 43 | 37 | 14 | 6 | 11 | 16 | 7 | 14 | 2 | 37 | 939 | |||||
| Region | |||||||||||||||||
| Border | 87 | 69 | 61 | 13 | 6 | 11 | 11 | 4 | 10 | 2 | 10 | 536 | |||||
| Midland | 82 | 74 | 44 | 17 | 8 | 13 | 16 | 7 | 13 | 2 | 13 | 264 | |||||
| West | 83 | 68 | 61 | 22 | 6 | 21 | 17 | 4 | 16 | 3 | 12 | 444 | |||||
| Dublin | 92 | 88 | 83 | 34 | 10 | 32 | 24 | 7 | 23 | 9 | 6 | 1,071 | |||||
| Mid-East | 86 | 83 | 76 | 21 | 9 | 20 | 15 | 6 | 14 | 3 | 10 | 320 | |||||
| Mid-West | 84 | 75 | 71 | 17 | 6 | 16 | 14 | 7 | 13 | 3 | 13 | 408 | |||||
| South-East | 85 | 64 | 69 | 21 | 7 | 19 | 17 | 4 | 15 | 4 | 12 | 412 | |||||
| South-West | 83 | 64 | 53 | 26 | 8 | 22 | 15 | 5 | 13 | 2 | 12 | 589 | |||||
| Note 1: Data are subject to sampling and other survey errors, which are relatively greater in respect of smaller values. | |||||||||||||||||
| Note 2: Individuals represent all individuals aged 16-74 who used the internet in the last 3 months. | |||||||||||||||||
| Note 3: More than one type of device used may have been given by respondents. | |||||||||||||||||
Of the internet activities surveyed in 2018, the most popular activity was Finding information on goods and services (88%). The next most common internet activity was E-mail (84%), followed by Social networking and Reading or downloading online news, both 73%. Internet banking was used by seven out of every ten (70%) users of the internet in the previous three months. See table 3a and figure 4.
There were notable differences in type of internet activity between individuals in different deprivation quintiles. Online banking was used by 84% of individuals in the Fifth quintile - very affluent deprivation quintile, compared with 57% of internet users in the First quintile - very disadvantaged deprivation quintile. Nearly one fifth (19%) of persons in the fifth (very affluent) deprivation quintile went online to make an appointment with a health practitioner. This figure compares with just 7% of persons in the first (very disadvantaged) deprivation quintile. Over one quarter (27%) of persons in fifth (very affluent) deprivation quintile used the internet for Buying or renewing existing insurance policies, compared with 18% of individuals in the First quintile - very disadvantaged deprivation quintile. See table 3a.
Online activities analysed by age group shows that Finding information on goods and services and E-mail (sending/receiving e-mails) were the top two activities carried out by all internet users 30 years or older. Those aged 30 to 44 reported the highest use of E-mail at 89%, while 72% of the 60 to 74 years age group used E-mail. Almost eight out of every ten (79%) internet users aged 60 to 74 years used the internet in the previous three months for the purposes of Finding information on goods and services. See table 3a.
Individuals aged 16 to 29 years were more likely to engage in online leisure or recreation activities, such as Social networking (92%), when compared to other age groups. Similarly, over six in every ten (61%) of this age group used the internet in Uploading self-created content (including uploading text, photos, music, videos, software, to any webiste to be shared). This compares with just under one quarter (24%) of the 60 to 74 years age group. See table 3a.
| Table 3(a) Individuals who recently used the internet (in the last 3 months) classified by types of internet activities, 2018 | ||||||||||||||||||
| % of individuals | ||||||||||||||||||
| Finding information on goods and services | E-mail1 | Social networking2 | Reading or downloading online news | Internet banking | Services related to travel3 | Seeking health related information | Internet telephoning/ video calls | Uploading self created content4 | Selling of goods or services | Buying or renewing existing insurance policies | Making appointment with health practitioner | Arranging credit with financial institutions5 | Buying or selling of investment services6 | Unweighted sample | ||||
| State | 88 | 84 | 73 | 73 | 70 | 62 | 57 | 46 | 46 | 29 | 23 | 9 | 4 | 2 | 4,044 | |||
| Sex | ||||||||||||||||||
| Male | 88 | 84 | 79 | 72 | 71 | 61 | 49 | 49 | 50 | 32 | 25 | 8 | 4 | 3 | 1,713 | |||
| Female | 89 | 83 | 67 | 75 | 70 | 62 | 65 | 43 | 41 | 27 | 21 | 10 | 4 | 2 | 2,331 | |||
| Age group | ||||||||||||||||||
| 16-29 | 93 | 85 | 92 | 71 | 67 | 60 | 55 | 54 | 61 | 29 | 18 | 12 | 5 | 2 | 465 | |||
| 30-44 | 91 | 89 | 81 | 81 | 83 | 70 | 63 | 53 | 50 | 37 | 30 | 10 | 5 | 3 | 1,396 | |||
| 45-59 | 86 | 81 | 61 | 70 | 67 | 61 | 56 | 35 | 37 | 27 | 25 | 7 | 3 | 3 | 1,244 | |||
| 60-74 | 79 | 72 | 42 | 63 | 50 | 46 | 47 | 34 | 24 | 17 | 11 | 5 | 0 | 0 | 939 | |||
| Principal economic status | ||||||||||||||||||
| At work | 91 | 88 | 76 | 79 | 81 | 70 | 60 | 47 | 47 | 34 | 31 | 10 | 5 | 3 | 2,315 | |||
| Unemployed | 86 | 76 | 73 | 70 | 53 | 47 | 51 | 41 | 49 | 36 | 10 | 10 | 0 | 1 | 172 | |||
| Student | 77 | 64 | 58 | 51 | 61 | 57 | 47 | 27 | 34 | 22 | 8 | 13 | 6 | 3 | 184 | |||
| Home duties | 79 | 75 | 41 | 65 | 51 | 47 | 47 | 34 | 59 | 14 | 17 | 5 | 1 | 1 | 576 | |||
| Retired | 94 | 85 | 89 | 63 | 57 | 51 | 62 | 55 | 19 | 25 | 12 | 5 | 0 | 0 | 647 | |||
| Other | 76 | 80 | 71 | 68 | 52 | 48 | 52 | 57 | 47 | 25 | 15 | 9 | 0 | 1 | 150 | |||
| Region | ||||||||||||||||||
| Border | 88 | 79 | 75 | 60 | 72 | 66 | 66 | 42 | 28 | 33 | 19 | 7 | 2 | 1 | 536 | |||
| Midland | 91 | 80 | 72 | 70 | 82 | 71 | 68 | 43 | 45 | 27 | 23 | 17 | 2 | 2 | 264 | |||
| West | 87 | 90 | 74 | 77 | 72 | 60 | 53 | 46 | 49 | 28 | 27 | 11 | 4 | 3 | 444 | |||
| Dublin | 88 | 91 | 75 | 83 | 67 | 59 | 55 | 60 | 47 | 28 | 32 | 5 | 6 | 6 | 1,071 | |||
| Mid-East | 88 | 83 | 73 | 75 | 65 | 54 | 43 | 48 | 41 | 33 | 20 | 8 | 2 | 3 | 320 | |||
| Mid-West | 90 | 85 | 70 | 75 | 72 | 66 | 56 | 49 | 52 | 24 | 20 | 8 | 5 | 2 | 408 | |||
| South-East | 85 | 81 | 77 | 77 | 71 | 65 | 58 | 45 | 57 | 26 | 27 | 14 | 5 | 3 | 412 | |||
| South-West | 87 | 91 | 72 | 77 | 72 | 60 | 61 | 47 | 44 | 36 | 15 | 12 | 6 | 2 | 589 | |||
| Type of household Internet connection | ||||||||||||||||||
| Broadband | 89 | 85 | 74 | 74 | 71 | 63 | 58 | 47 | 47 | 30 | 23 | 9 | 4 | 2 | 3,931 | |||
| Narrowband | * | * | * | * | * | * | * | * | * | * | * | * | * | * | 18 | |||
| No internet | 79 | 85 | 34 | 58 | 45 | 24 | 39 | 27 | 52 | 14 | 11 | 6 | 2 | 2 | 79 | |||
| Unknown internet | * | * | * | * | * | * | * | * | * | * | * | * | * | * | 16 | |||
| Household composition | ||||||||||||||||||
| 1 adult, no dependent children | 81 | 80 | 63 | 69 | 79 | 66 | 64 | 41 | 38 | 33 | 19 | 9 | 2 | 2 | 680 | |||
| 2 adults no dependent children | 88 | 78 | 64 | 73 | 64 | 56 | 55 | 42 | 38 | 25 | 21 | 7 | 4 | 2 | 1,040 | |||
| 3 or more adults no dependent children | 90 | 88 | 80 | 71 | 66 | 63 | 52 | 47 | 46 | 34 | 17 | 8 | 1 | 3 | 551 | |||
| 1 adult with dependent children | 83 | 82 | 80 | 58 | 66 | 60 | 54 | 50 | 48 | 27 | 21 | 9 | 1 | 1 | 182 | |||
| 2 adults with dependent children | 92 | 87 | 78 | 80 | 55 | 47 | 49 | 49 | 52 | 29 | 29 | 10 | 5 | 3 | 1,230 | |||
| 3 or more adults with dependent children | 89 | 86 | 79 | 68 | 73 | 66 | 55 | 48 | 54 | 26 | 24 | 10 | 7 | 3 | 361 | |||
| Deprivation quintile | ||||||||||||||||||
| First quintile - very disadvataged | 86 | 82 | 75 | 69 | 57 | 52 | 54 | 44 | 50 | 32 | 18 | 7 | 5 | 1 | 776 | |||
| Second quintile - disadvantaged | 86 | 83 | 70 | 69 | 68 | 62 | 55 | 44 | 43 | 34 | 22 | 10 | 3 | 2 | 740 | |||
| Third quintile - average | 90 | 80 | 71 | 70 | 73 | 61 | 52 | 41 | 42 | 30 | 28 | 4 | 2 | 1 | 799 | |||
| Fourth quintile - affluent | 89 | 86 | 76 | 78 | 75 | 66 | 59 | 47 | 47 | 21 | 21 | 11 | 4 | 3 | 943 | |||
| Fifth quintile - very affluent | 94 | 92 | 76 | 86 | 84 | 73 | 73 | 62 | 50 | 33 | 27 | 19 | 8 | 6 | 786 | |||
| 1Sending/receiving e-mails. | ||||||||||||||||||
| 2Examples include creating user profiles, posting messages or other contributions to Facebook, Twitter, etc. | ||||||||||||||||||
| 3Includes travel related accommodation. | ||||||||||||||||||
| 4Includes uploading text, photos, music, videos, software, etc. to any website to be shared. | ||||||||||||||||||
| 5Includes taking a loan or mortgage or arranging credit from banks or other financial providers. | ||||||||||||||||||
| 6Includes buying or selling shares, bonds, funds or other investment services. | ||||||||||||||||||
| Note 1: Data are subject to sampling and other survey errors, which are relatively greater in respect of smaller values. | ||||||||||||||||||
| Note 2: Individuals represent all individuals aged 16-74 who used the internet in the previous 3 months. | ||||||||||||||||||
| Note 3: * Sample occurrence too small for estimation, i.e., less than 30. | ||||||||||||||||||
| Type of internet activity | |
| Finding information on goods and services | 88 |
| 84 | |
| Social networking | 73 |
| Reading or downloading online news | 73 |
| Internet banking | 70 |
| Services related to travel | 62 |
| Seeking health related information | 57 |
| Internet telephoning/ video calls | 46 |
| Uploading self created content | 46 |
| Selling of goods or services | 29 |
| Buying or renewing existing insurance policies | 23 |
| Making appointment with health practitioner | 9 |
| Arranging credit with financial institutions | 4 |
| Buying or selling of investment services | 2 |
In 2018, over half of internet users (52%) Obtained information from websites or apps of public authorities or public services, while 43% Downloaded or printed official forms from their websites or apps. Submitting completed forms online was carried out by six out of every ten (60%) of internet users. Nearly three quarters (73%) of internet users aged 30 to 44 years submitted completed forms online, compared with just 42% of internet users in the 16 to 29 years age category. Nearly three quarters (74%) of internet users in this age group who did not submit any completed official forms online cited the reason Did not have to submit official forms at all. For 21% of internet users, another person such as a consultant, tax adviser, relative or family member filled it in on their behalf, while 7% said that they found the process too complicated and cited Lack of skills or knowledge. See tables 3b and 3c.
| Table 3(b) Individuals' contact over the internet with public authorities and public services in the last 12 months, 2016 to 2018 | ||||||||||||||
| % of individuals | ||||||||||||||
| Obtaining information from websites or apps | Downloading/printing official forms | Submitting completed forms online | Unweighted sample 2018 | |||||||||||
| 2016 | 2017 | 2018 | 2016 | 2017 | 2018 | 2016 | 2017 | 2018 | ||||||
| State | 49 | 51 | 52 | 46 | 45 | 43 | 58 | 63 | 60 | 4,088 | ||||
| Sex | ||||||||||||||
| Male | 52 | 53 | 50 | 48 | 46 | 43 | 60 | 64 | 60 | 1,727 | ||||
| Female | 46 | 49 | 53 | 43 | 45 | 42 | 56 | 62 | 60 | 2,361 | ||||
| Age group | ||||||||||||||
| 16-29 | 31 | 40 | 38 | 29 | 36 | 30 | 37 | 47 | 42 | 466 | ||||
| 30-44 | 57 | 60 | 62 | 54 | 54 | 54 | 67 | 73 | 73 | 1,404 | ||||
| 45-59 | 54 | 52 | 54 | 51 | 45 | 42 | 67 | 68 | 64 | 1,257 | ||||
| 60-74 | 51 | 47 | 48 | 44 | 39 | 37 | 57 | 58 | 55 | 961 | ||||
| Principal economic status | ||||||||||||||
| At work | 58 | 59 | 62 | 55 | 53 | 52 | 70 | 74 | 72 | 2,326 | ||||
| Unemployed | 31 | 35 | 32 | 24 | 30 | 20 | 37 | 43 | 45 | 173 | ||||
| Student | 25 | 37 | 26 | 24 | 34 | 23 | 29 | 41 | 28 | 184 | ||||
| Home duties | 38 | 38 | 43 | 34 | 32 | 37 | 45 | 47 | 52 | 587 | ||||
| Retired | 54 | 47 | 50 | 48 | 39 | 38 | 62 | 58 | 57 | 658 | ||||
| Other | 38 | 36 | 41 | 36 | 29 | 28 | 42 | 41 | 37 | 160 | ||||
| Region | ||||||||||||||
| Border | 46 | 46 | 43 | 36 | 39 | 33 | 55 | 58 | 55 | 549 | ||||
| Midlands | 49 | 46 | 47 | 46 | 39 | 42 | 55 | 59 | 58 | 268 | ||||
| West | 47 | 52 | 57 | 41 | 45 | 42 | 51 | 62 | 65 | 450 | ||||
| Dublin | 54 | 57 | 63 | 52 | 50 | 55 | 64 | 67 | 76 | 1,078 | ||||
| Mid-East | 52 | 54 | 50 | 51 | 52 | 53 | 61 | 66 | 65 | 320 | ||||
| Mid-West | 47 | 54 | 59 | 41 | 43 | 48 | 51 | 64 | 65 | 411 | ||||
| South-East | 49 | 53 | 53 | 47 | 50 | 39 | 57 | 62 | 53 | 419 | ||||
| South-West | 38 | 39 | 49 | 38 | 34 | 39 | 55 | 60 | 57 | 593 | ||||
| Type of household internet connection | ||||||||||||||
| Broadband | 50 | 55 | 53 | 47 | 49 | 44 | 61 | 68 | 61 | 3,960 | ||||
| Narrowband | 58 | * | 53 | 52 | * | 49 | 53 | * | * | 18 | ||||
| No internet | 29 | 31 | 18 | 27 | 20 | 11 | 30 | 33 | 24 | 94 | ||||
| Unknown internet | * | * | 34 | * | * | 19 | * | * | * | 16 | ||||
| Household composition | ||||||||||||||
| 1 Adult no dependent children | 49 | 52 | 52 | 44 | 44 | 42 | 56 | 63 | 56 | 695 | ||||
| 2 Adults no dependent children | 56 | 54 | 50 | 50 | 48 | 38 | 65 | 67 | 59 | 1,059 | ||||
| 3 or more adults no dependent children | 41 | 51 | 47 | 40 | 44 | 38 | 49 | 57 | 54 | 553 | ||||
| 1 Adult with dependent children | 38 | 44 | 41 | 36 | 36 | 31 | 46 | 49 | 49 | 182 | ||||
| 2 Adults with dependent children | 54 | 53 | 58 | 51 | 48 | 52 | 64 | 70 | 71 | 1,236 | ||||
| 3 or more adults with dependent children | 39 | 43 | 47 | 37 | 41 | 37 | 49 | 55 | 48 | 363 | ||||
| Note 1: Data are subject to sampling and other survey errors, which are relatively greater in respect of smaller values. | ||||||||||||||
| Note 2: Individuals represent all individuals aged 16-74 who used the internet in the previous 12 months. | ||||||||||||||
| Note 3: Contacts through manually typed e-mails are excluded. | ||||||||||||||
| Note 4: Respondents may have selected more than one option. | ||||||||||||||
| Note 5: * Sample occurrence too small for estimation, i.e., less than 30. | ||||||||||||||
| Table 3(c) Individuals who did not submit completed official forms online by their reasons for not doing so, 2016 to 2018 | |||||||||||||||||||||||||||
| % of individuals | |||||||||||||||||||||||||||
| Did not have to submit official forms at all | No such website service available | Lack of skills or knowledge | Concerns about protection/ security of personal data | Another person did it on my behalf1 | Other reason | Unweighted sample 2018 | |||||||||||||||||||||
| 2016 | 2017 | 2018 | 2016 | 2017 | 2018 | 2016 | 2017 | 2018 | 2016 | 2017 | 2018 | 2016 | 2017 | 2018 | 2016 | 2017 | 2018 | ||||||||||
| State | 44 | 49 | 46 | 1 | 1 | 1 | 6 | 7 | 7 | 3 | 5 | 8 | 25 | 23 | 21 | 22 | 15 | 20 | 1,377 | ||||||||
| Sex | |||||||||||||||||||||||||||
| Male | 45 | 49 | 49 | 1 | 1 | 2 | 6 | 7 | 7 | 2 | 6 | 8 | 23 | 22 | 22 | 24 | 17 | 19 | 568 | ||||||||
| Female | 43 | 49 | 43 | 1 | 1 | 1 | 7 | 8 | 8 | 4 | 5 | 8 | 28 | 24 | 21 | 20 | 14 | 21 | 809 | ||||||||
| Age group | |||||||||||||||||||||||||||
| 16-29 | 64 | 72 | 74 | 1 | 1 | 1 | 2 | 2 | 1 | 1 | 2 | 3 | 14 | 9 | 12 | 19 | 13 | 16 | 221 | ||||||||
| 30-44 | 41 | 47 | 34 | 1 | 1 | 1 | 5 | 7 | 8 | 3 | 6 | 15 | 27 | 21 | 23 | 23 | 18 | 20 | 346 | ||||||||
| 45-59 | 25 | 31 | 28 | 0 | 1 | 3 | 11 | 13 | 10 | 3 | 7 | 9 | 36 | 37 | 28 | 25 | 15 | 25 | 404 | ||||||||
| 60-74 | 19 | 23 | 21 | 0 | 1 | 0 | 15 | 13 | 18 | 9 | 10 | 9 | 39 | 41 | 32 | 21 | 19 | 24 | 406 | ||||||||
| Principal economic status | |||||||||||||||||||||||||||
| At work | 39 | 46 | 36 | 1 | 2 | 1 | 7 | 6 | 6 | 3 | 5 | 10 | 29 | 25 | 21 | 23 | 16 | 27 | 584 | ||||||||
| Unemployed | 53 | 48 | 39 | 0 | 1 | 3 | 6 | 10 | 10 | 1 | 8 | 18 | 19 | 14 | 13 | 21 | 22 | 20 | 82 | ||||||||
| Student | 67 | 78 | 87 | 1 | 1 | 2 | 0 | 0 | 1 | 1 | 0 | 1 | 11 | 10 | 12 | 19 | 9 | 9 | 93 | ||||||||
| Home duties | 31 | 37 | 36 | 1 | 1 | 1 | 8 | 11 | 9 | 4 | 6 | 8 | 37 | 31 | 31 | 20 | 17 | 17 | 261 | ||||||||
| Retired | 19 | 26 | 23 | 0 | 1 | 2 | 15 | 13 | 17 | 10 | 11 | 9 | 33 | 38 | 31 | 26 | 17 | 23 | 260 | ||||||||
| Other | 46 | 50 | 33 | 0 | 0 | 1 | 10 | 11 | 12 | 1 | 7 | 7 | 21 | 21 | 25 | 24 | 16 | 19 | 97 | ||||||||
| Region | |||||||||||||||||||||||||||
| Border | 34 | 37 | 50 | 0 | 1 | 0 | 12 | 10 | 9 | 4 | 3 | 3 | 30 | 30 | 21 | 21 | 22 | 17 | 221 | ||||||||
| Midlands | 33 | 43 | 45 | 1 | 1 | 1 | 14 | 12 | 6 | 7 | 11 | 15 | 18 | 14 | 18 | 31 | 20 | 18 | 109 | ||||||||
| West | 51 | 58 | 38 | 1 | 2 | 1 | 6 | 8 | 7 | 3 | 5 | 6 | 19 | 16 | 21 | 20 | 12 | 30 | 147 | ||||||||
| Dublin | 55 | 61 | 52 | 2 | 1 | 1 | 5 | 6 | 6 | 3 | 5 | 3 | 23 | 19 | 27 | 14 | 10 | 13 | 268 | ||||||||
| Mid-East | 33 | 51 | 38 | 0 | 1 | 2 | 3 | 4 | 6 | 1 | 6 | 10 | 28 | 24 | 22 | 36 | 15 | 27 | 92 | ||||||||
| Mid-West | 54 | 50 | 51 | 1 | 3 | 1 | 6 | 12 | 10 | 2 | 6 | 6 | 20 | 20 | 23 | 19 | 11 | 13 | 134 | ||||||||
| South-East | 41 | 36 | 44 | 0 | 0 | 3 | 3 | 5 | 8 | 3 | 7 | 3 | 30 | 30 | 26 | 23 | 24 | 24 | 188 | ||||||||
| South-West | 36 | 42 | 50 | 1 | 1 | 1 | 5 | 6 | 6 | 3 | 3 | 7 | 32 | 30 | 21 | 24 | 16 | 20 | 218 | ||||||||
| Household composition | |||||||||||||||||||||||||||
| 1 Adult no dependent children | 44 | 48 | 39 | 1 | 2 | 1 | 13 | 13 | 12 | 3 | 7 | 8 | 12 | 14 | 23 | 29 | 19 | 20 | 295 | ||||||||
| 2 Adults no dependent children | 31 | 35 | 41 | 2 | 3 | 1 | 11 | 12 | 9 | 6 | 7 | 6 | 33 | 29 | 23 | 21 | 16 | 22 | 393 | ||||||||
| 3 or more adults no dependent children | 58 | 57 | 58 | 0 | 1 | 0 | 3 | 4 | 4 | 3 | 5 | 5 | 19 | 18 | 15 | 17 | 17 | 20 | 202 | ||||||||
| 1 Adult with dependent children | 54 | 56 | 53 | 1 | 1 | 1 | 7 | 7 | 11 | 2 | 4 | 9 | 11 | 16 | 21 | 26 | 18 | 23 | 66 | ||||||||
| 2 Adults with dependent children | 35 | 49 | 40 | 1 | 1 | 2 | 4 | 6 | 5 | 2 | 5 | 13 | 39 | 28 | 26 | 21 | 12 | 19 | 291 | ||||||||
| 3 or more adults with dependent children | 52 | 48 | 54 | 1 | 0 | 2 | 4 | 5 | 4 | 4 | 2 | 7 | 21 | 28 | 17 | 20 | 14 | 18 | 130 | ||||||||
| 1Examples include consultant, tax adviser, relative, family member, etc. | |||||||||||||||||||||||||||
| Note 1: Data are subject to sampling and other survey errors, which are relatively greater in respect of smaller values. | |||||||||||||||||||||||||||
| Note 2: Individuals represent all individuals aged 16-74 who used the internet in the previous 12 months. | |||||||||||||||||||||||||||
| Note 3: Respondents may have selected more than one option. | |||||||||||||||||||||||||||
In 2018, 28% of internet users said that they had arranged accommodation (such as a room, apartment, house, holiday cottage, etc.) from another private individual via a dedicated website or app, such as AIRBNB, an increase of seven percentage points on 2017. One in ten internet users had arranged accommodation in such a way via other websites or apps (including social networks such as Facebook, etc.), while 69% had not arranged accommodation online from another private individual in the previous twelve months. See table 3d.
Use of a dedicated website or app was also the preferred option for using shared economy in arranging transport from another private individual with 14% of internet users using a dedicated website or app (such as UBER, HAILO, etc.) to arrange a transport service (such as car, etc.) from another private individual in the previous twelve months, compared with just 3% who had done so via other websites or apps and 84% had not arranged a transport service online from another private individual in the last twelve months. See Table 3d.
Note that respondents may have arranged accommodation and/or transport from another private individual via both dedicated websites or apps and other websites or apps.
| Table 3(d) Individuals who used any website or app to arrange accommodation or transport service from another private individual in the last 12 months, 2017 to 2018 | ||||||||||||||||||
| % of individuals | ||||||||||||||||||
| Arranged accommodation1 from another private individual online | Arranged transport4 from another private individual online | |||||||||||||||||
| Via dedicated website or app2 | Via other website or app3 | Did not use any website or app | Via dedicated website or app5 | Via other website or app3 | Did not use any website or app | |||||||||||||
| 2017 | 2018 | 2017 | 2018 | 2017 | 2018 | 2017 | 2018 | 2017 | 2018 | 2017 | 2018 | Sample 2018 | ||||||
| State | 21 | 28 | 10 | 10 | 74 | 69 | 19 | 14 | 4 | 3 | 79 | 84 | 4,088 | |||||
| Sex | ||||||||||||||||||
| Male | 21 | 28 | 11 | 10 | 74 | 69 | 20 | 15 | 4 | 3 | 78 | 83 | 1,727 | |||||
| Female | 21 | 29 | 9 | 9 | 74 | 69 | 17 | 13 | 4 | 2 | 80 | 85 | 2,361 | |||||
| Age group | ||||||||||||||||||
| 16-29 | 19 | 34 | 10 | 13 | 76 | 63 | 27 | 26 | 4 | 4 | 71 | 73 | 466 | |||||
| 30-44 | 25 | 33 | 12 | 12 | 69 | 63 | 22 | 14 | 5 | 3 | 76 | 84 | 1,404 | |||||
| 45-59 | 20 | 23 | 9 | 7 | 76 | 74 | 12 | 10 | 3 | 2 | 87 | 89 | 1,257 | |||||
| 60-74 | 12 | 15 | 6 | 4 | 83 | 83 | 6 | 4 | 2 | 2 | 92 | 95 | 961 | |||||
| Principal economic status | ||||||||||||||||||
| At work | 26 | 34 | 12 | 11 | 69 | 63 | 23 | 15 | 5 | 3 | 75 | 84 | 2,326 | |||||
| Unemployed | 10 | 18 | 7 | 9 | 85 | 79 | 9 | 15 | 5 | 2 | 88 | 83 | 173 | |||||
| Student | 12 | 30 | 7 | 12 | 84 | 68 | 23 | 29 | 1 | 3 | 75 | 70 | 184 | |||||
| Home duties | 17 | 20 | 8 | 5 | 79 | 78 | 7 | 8 | 2 | 3 | 91 | 90 | 587 | |||||
| Retired | 13 | 15 | 6 | 6 | 83 | 82 | 6 | 5 | 3 | 2 | 92 | 94 | 658 | |||||
| Other | 12 | 12 | 5 | 3 | 86 | 85 | 9 | 4 | 3 | 1 | 88 | 94 | 160 | |||||
| Region | ||||||||||||||||||
| Border | 15 | 22 | 6 | 5 | 80 | 74 | 8 | 13 | 2 | 3 | 89 | 84 | 549 | |||||
| Midlands | 16 | 28 | 6 | 8 | 80 | 71 | 7 | 8 | 1 | 2 | 93 | 90 | 268 | |||||
| West | 28 | 32 | 14 | 9 | 66 | 64 | 23 | 13 | 8 | 3 | 73 | 85 | 450 | |||||
| Dublin | 24 | 32 | 12 | 14 | 70 | 65 | 35 | 40 | 5 | 7 | 64 | 59 | 1,078 | |||||
| Mid-East | 20 | 24 | 6 | 8 | 78 | 74 | 10 | 14 | 0 | 3 | 90 | 85 | 320 | |||||
| Mid-West | 25 | 29 | 16 | 8 | 65 | 68 | 19 | 15 | 3 | 1 | 80 | 84 | 411 | |||||
| South-East | 16 | 26 | 10 | 15 | 80 | 67 | 6 | 10 | 5 | 2 | 91 | 89 | 419 | |||||
| South-West | 18 | 33 | 8 | 12 | 78 | 64 | 10 | 25 | 4 | 3 | 86 | 75 | 593 | |||||
| Type of household internet connection | ||||||||||||||||||
| Broadband | 22 | 29 | 10 | 10 | 73 | 68 | 18 | 15 | 4 | 3 | 80 | 84 | 3,960 | |||||
| Narrowband | * | * | * | * | * | * | * | * | * | * | * | * | 18 | |||||
| No internet | 9 | 6 | 5 | 3 | 89 | 93 | 8 | 5 | 2 | 2 | 92 | 95 | 94 | |||||
| Unknown internet | * | * | * | * | * | * | * | * | * | * | * | * | 16 | |||||
| Household composition | ||||||||||||||||||
| 1 Adult no dependent children | 21 | 19 | 10 | 8 | 76 | 78 | 19 | 12 | 4 | 5 | 79 | 85 | 695 | |||||
| 2 Adults no dependent children | 24 | 29 | 12 | 11 | 70 | 68 | 22 | 16 | 5 | 3 | 76 | 84 | 1,059 | |||||
| 3 or more adults no dependent children | 23 | 31 | 12 | 11 | 71 | 66 | 29 | 24 | 5 | 3 | 70 | 75 | 553 | |||||
| 1 Adult with dependent children | 12 | 21 | 5 | 3 | 85 | 78 | 10 | 10 | 3 | 0 | 88 | 90 | 182 | |||||
| 2 Adults with dependent children | 21 | 31 | 10 | 10 | 73 | 65 | 14 | 11 | 3 | 3 | 84 | 87 | 1,236 | |||||
| 3 or more adults with dependent children | 17 | 29 | 7 | 10 | 79 | 69 | 17 | 15 | 3 | 2 | 80 | 84 | 363 | |||||
| 1Examples include room, apartment, house, holiday cottage, etc | ||||||||||||||||||
| 2Examples include AIRBNB, etc. | ||||||||||||||||||
| 3Includes social networks such as Facebook, etc. | ||||||||||||||||||
| 4Examples include car, etc. | ||||||||||||||||||
| 5Examples include UBER , HAILO, etc. | ||||||||||||||||||
| Note 1: Data are subject to sampling and other survey errors, which are relatively greater in respect of smaller values. | ||||||||||||||||||
| Note 2: Individuals represent all individuals aged 16-74 who used the internet in the previous 12 months. | ||||||||||||||||||
| Note 3: Respondents may have selected more than one option. | ||||||||||||||||||
| Note 4: * Sample occurrence too small for estimation, i.e., less than 30. | ||||||||||||||||||
Clothes or sports goods were the most popular online purchase in 2018, purchased by half (50%) of internet users. The next most common types of internet purchases made by individuals in the last twelve months (prior to interview) were Holiday accommodation (44%) and Other travel arrangements (includes travel tickets, car hire, etc.) (41%), followed closely by Tickets for events at 39%. See table 4a and figure 5.
There are clear differences between age groups in the types of goods and services bought online. The largest difference was for Clothes or sports goods, with 63% of individuals aged 16 to 29 years purchasing these, compared with just 18% of those aged 60 to 74. See table 4a.
There were also notable differences between deprivation quintiles in the types of goods and services bought online. Six out of every ten (60%) internet users in the deprivation quintile Fifth quintile - very affluent purchased clothes and/or sports goods online, compared with just 47% of internet users in the First quintile - very disadvantaged group. Similarly, 59% of persons in the Fifth quintile - very affluent deprivation quintile purchased or ordered online Holiday accommodation, compared with 35% of internet users in the first deprivation quintile (very disadvantaged). Twice as many internet users in the fifth deprivation quintile (very affluent) purchased Other travel arrangements and Tickets for events online, compared with internet users in the First quintile - very disadvantaged category. The trend is similar for other purchases made online. Almost twice as many persons in the Fifth quintile - very affluent category purchased Food and groceries online, compared with internet users in the First quintile - very disadvantaged deprivation quintile. The differences between deprivation quintiles for purchases made online, were less notable for purchases of Video games, software and software upgrades, Computer software downloaded or accessed from websites or apps and Computer hardware, for example, 14% of persons in the First quintile - very disadvantaged bought Video games, software and software upgrades online, compared with 16% of the Fifth quintile - very affluent category. See table 4a.
For internet users whose principal economic status was 'At work', 56% purchased Holiday accommodation online compared with just under one quarter (24%) of internet users in the Unemployed category. A half of all persons who purchased online in the previous twelve months, whose principal economic status was At work used the internet to buy or order Other travel arrangements (such as travel tickets, car hire, etc.) online. See table 4a.
Six out of every ten households with dependent children bought Clothes or sports goods online. This figure compares with 37% of households comprising one adult only. See table 4a.
| Table 4(a) Individuals who use the internet classified by types of purchases made online during the last 12 months, 2018 | |||||||||||||
| % of individuals | |||||||||||||
| Clothes or sports goods | Holiday accommodation | Other travel arrangements1 | Tickets for events | Household goods | Electronic equipment2 | Books, magazines and newspapers3 | E-books4 | E-magazines/ e-newspapers4 | Telecommunication services | ||||
| State | 50 | 44 | 41 | 39 | 27 | 22 | 21 | 10 | 3 | 18 | |||
| Sex | |||||||||||||
| Male | 42 | 42 | 42 | 37 | 26 | 29 | 20 | 9 | 4 | 22 | |||
| Female | 58 | 45 | 40 | 40 | 29 | 17 | 22 | 11 | 3 | 15 | |||
| Age group | |||||||||||||
| 16-29 | 63 | 42 | 39 | 43 | 23 | 23 | 17 | 7 | 2 | 18 | |||
| 30-44 | 60 | 55 | 52 | 48 | 41 | 30 | 26 | 13 | 5 | 25 | |||
| 45-59 | 42 | 42 | 39 | 35 | 22 | 20 | 21 | 8 | 4 | 16 | |||
| 60-74 | 18 | 23 | 21 | 16 | 11 | 10 | 17 | 8 | 1 | 4 | |||
| Principal economic status | |||||||||||||
| At work | 57 | 56 | 50 | 48 | 32 | 27 | 25 | 12 | 4 | 23 | |||
| Unemployed | 31 | 24 | 28 | 20 | 23 | 21 | 10 | 4 | 2 | 11 | |||
| Student | 62 | 29 | 38 | 42 | 17 | 20 | 15 | 10 | 2 | 15 | |||
| Home duties | 47 | 32 | 26 | 29 | 32 | 15 | 18 | 7 | 4 | 12 | |||
| Retired | 21 | 26 | 24 | 15 | 10 | 12 | 17 | 8 | 1 | 6 | |||
| Other | 29 | 23 | 22 | 13 | 22 | 18 | 11 | 3 | 4 | 9 | |||
| Region | |||||||||||||
| Border | 49 | 38 | 37 | 35 | 19 | 19 | 18 | 8 | 3 | 13 | |||
| Midland | 46 | 41 | 34 | 28 | 28 | 20 | 18 | 8 | 3 | 18 | |||
| West | 56 | 43 | 45 | 48 | 24 | 20 | 21 | 10 | 5 | 18 | |||
| Dublin | 58 | 57 | 60 | 54 | 31 | 27 | 31 | 17 | 5 | 26 | |||
| Mid-East | 50 | 43 | 36 | 44 | 32 | 19 | 24 | 10 | 3 | 18 | |||
| Mid-West | 53 | 46 | 43 | 41 | 25 | 29 | 21 | 12 | 4 | 19 | |||
| South-East | 52 | 45 | 44 | 40 | 30 | 27 | 19 | 7 | 3 | 20 | |||
| South-West | 49 | 49 | 47 | 42 | 30 | 23 | 28 | 12 | 3 | 16 | |||
| Type of household internet connection | |||||||||||||
| Broadband | 51 | 45 | 43 | 40 | 28 | 23 | 22 | 10 | 3 | 19 | |||
| Narrowband | * | * | * | * | * | * | * | * | * | * | |||
| No internet | 33 | 8 | 5 | 5 | 11 | 4 | 6 | 4 | 0 | 2 | |||
| Unknown internet | * | * | * | * | * | * | * | * | * | * | |||
| Household composition | |||||||||||||
| 1 adult, no dependent children | 37 | 35 | 31 | 25 | 15 | 14 | 16 | 7 | 4 | 12 | |||
| 2 adults no dependent children | 40 | 41 | 39 | 34 | 20 | 19 | 21 | 11 | 4 | 15 | |||
| 3 or more adults no dependent children | 51 | 40 | 43 | 41 | 18 | 26 | 23 | 11 | 3 | 18 | |||
| 1 adult with dependent children | 60 | 30 | 26 | 27 | 38 | 17 | 13 | 6 | 1 | 11 | |||
| 2 adults with dependent children | 59 | 53 | 47 | 47 | 42 | 28 | 25 | 11 | 4 | 23 | |||
| 3 or more adults with dependent children | 60 | 47 | 46 | 43 | 22 | 23 | 16 | 7 | 3 | 23 | |||
| Deprivation quintile | |||||||||||||
| First quintile - very disadvataged | 47 | 35 | 32 | 33 | 24 | 20 | 17 | 7 | 2 | 15 | |||
| Second quintile - disadvantaged | 46 | 42 | 40 | 34 | 26 | 24 | 16 | 8 | 4 | 16 | |||
| Third quintile - average | 51 | 45 | 37 | 38 | 28 | 21 | 19 | 8 | 2 | 19 | |||
| Fourth quintile - affluent | 49 | 44 | 42 | 37 | 25 | 21 | 25 | 11 | 4 | 18 | |||
| Fifth quintile - very affluent | 60 | 59 | 63 | 58 | 37 | 30 | 32 | 20 | 6 | 24 | |||
| 1Includes travel tickets, car hire, etc. Excludes holiday accommodation. | |||||||||||||
| 2Includes cameras, audio-visual equipment, etc. | |||||||||||||
| 3Includes all online purchases of books, magazines and newspapers. Includes e-books, e-magazines and e-newspapers downloaded or accessed from websites or apps. | |||||||||||||
| 4Downloaded or accessed from websites or apps | |||||||||||||
| Note 1: Data are subject to sampling and other survey errors, which are relatively greater in respect of smaller values. | |||||||||||||
| Note 2: Individuals represent all individuals aged 16-74 who made purchases online in the last 12 months. | |||||||||||||
| Note 3: More than one type of purchase may be given by respondents. | |||||||||||||
| Table 4(a) contd. Individuals who use the internet classified by types of purchases made online during the last 12 months, 2018 | |||||||||||||
| % of individuals | |||||||||||||
| Food and groceries | Films/music5 | Films/music downloaded or accessed from websites/apps | Video games, software and software upgrades6 | Computer software7 downloaded or accessed from websites/apps | Computer hardware | E-learning material | Medicine | Other | Unweighted sample | ||||
| State | 8 | 17 | 13 | 14 | 5 | 6 | 5 | 2 | 11 | 4,088 | |||
| Sex | |||||||||||||
| Male | 7 | 20 | 15 | 18 | 7 | 10 | 5 | 2 | 14 | 1,727 | |||
| Female | 8 | 15 | 11 | 10 | 3 | 3 | 5 | 2 | 9 | 2,361 | |||
| Age group | |||||||||||||
| 16-29 | 4 | 21 | 17 | 22 | 6 | 8 | 5 | 1 | 14 | 466 | |||
| 30-44 | 13 | 24 | 17 | 17 | 7 | 8 | 7 | 3 | 11 | 1,404 | |||
| 45-59 | 7 | 13 | 9 | 8 | 3 | 5 | 3 | 2 | 10 | 1,257 | |||
| 60-74 | 3 | 3 | 2 | 2 | 0 | 2 | 3 | 1 | 11 | 961 | |||
| Principal economic status | |||||||||||||
| At work | 10 | 22 | 17 | 14 | 6 | 8 | 6 | 3 | 12 | 2,326 | |||
| Unemployed | 3 | 11 | 6 | 11 | 3 | 5 | 3 | 1 | 11 | 173 | |||
| Student | 4 | 20 | 18 | 27 | 8 | 12 | 5 | 1 | 18 | 184 | |||
| Home duties | 6 | 12 | 6 | 10 | 2 | 1 | 2 | 1 | 7 | 587 | |||
| Retired | 2 | 3 | 2 | 1 | 0 | 1 | 3 | 1 | 11 | 658 | |||
| Other | 6 | 6 | 4 | 7 | 1 | 2 | 1 | 2 | 9 | 160 | |||
| Region | |||||||||||||
| Border | 5 | 13 | 9 | 9 | 3 | 3 | 6 | 2 | 10 | 549 | |||
| Midland | 6 | 15 | 9 | 14 | 4 | 7 | 4 | 2 | 11 | 268 | |||
| West | 5 | 18 | 13 | 12 | 5 | 6 | 4 | 3 | 10 | 450 | |||
| Dublin | 19 | 24 | 20 | 15 | 6 | 8 | 7 | 4 | 10 | 1,078 | |||
| Mid-East | 11 | 19 | 14 | 15 | 3 | 6 | 3 | 3 | 13 | 320 | |||
| Mid-West | 7 | 22 | 18 | 16 | 7 | 8 | 4 | 2 | 13 | 411 | |||
| South-East | 8 | 17 | 14 | 15 | 6 | 7 | 5 | 1 | 14 | 419 | |||
| South-West | 7 | 17 | 14 | 16 | 6 | 5 | 5 | 2 | 9 | 593 | |||
| Type of household internet connection | |||||||||||||
| Broadband | 8 | 18 | 14 | 14 | 5 | 7 | 5 | 2 | 12 | 3,960 | |||
| Narrowband | * | * | * | * | * | * | * | * | * | 18 | |||
| No internet | 2 | 1 | 1 | 2 | 0 | 3 | 5 | 1 | 8 | 94 | |||
| Unknown internet | * | * | * | * | * | * | * | * | * | 16 | |||
| Household composition | |||||||||||||
| 1 adult, no dependent children | 5 | 10 | 7 | 8 | 2 | 3 | 3 | 1 | 11 | 695 | |||
| 2 adults no dependent children | 6 | 16 | 12 | 9 | 2 | 5 | 4 | 1 | 13 | 1,059 | |||
| 3 or more adults no dependent children | 4 | 21 | 15 | 15 | 7 | 6 | 5 | 2 | 14 | 553 | |||
| 1 adult with dependent children | 3 | 14 | 10 | 19 | 2 | 11 | 5 | 3 | 16 | 182 | |||
| 2 adults with dependent children | 13 | 22 | 16 | 19 | 7 | 8 | 7 | 3 | 10 | 1,236 | |||
| 3 or more adults with dependent children | 5 | 13 | 11 | 11 | 5 | 9 | 4 | 1 | 6 | 363 | |||
| Deprivation quintile | |||||||||||||
| First quintile - very disadvataged | 7 | 16 | 11 | 14 | 5 | 6 | 6 | 1 | 13 | 791 | |||
| Second quintile - disadvantaged | 5 | 16 | 12 | 12 | 5 | 8 | 5 | 2 | 11 | 748 | |||
| Third quintile - average | 5 | 15 | 11 | 13 | 4 | 4 | 2 | 2 | 10 | 810 | |||
| Fourth quintile - affluent | 10 | 18 | 13 | 14 | 5 | 6 | 6 | 3 | 11 | 950 | |||
| Fifth quintile - very affluent | 13 | 28 | 24 | 16 | 6 | 9 | 6 | 3 | 12 | 789 | |||
| 5Films/music downloaded or accessed from websites or apps. | |||||||||||||
| 6Includes computer software downloaded or accessed from websites or apps. | |||||||||||||
| 7Includes computer and video games and software upgrades. | |||||||||||||
| Note 1: Data are subject to sampling and other survey errors, which are relatively greater in respect of smaller values. | |||||||||||||
| Note 2: Individuals represent all individuals aged 16-74 who made purchases online in the last 12 months. | |||||||||||||
| Note 3: More than one type of purchase may be given by respondents. | |||||||||||||
| Type of online purchase | |
| Clothes or sports goods | 50.4 |
| Holiday accommodation | 43.6 |
| Other travel arrangements | 40.7 |
| Tickets for events | 38.6 |
| Household goods | 27.3 |
| Electronic equipment | 22.4 |
| Books, magazines and newspapers | 20.9 |
| Telecommunication services | 18 |
| Food and groceries | 7.5 |
| Films/music | 17.3 |
| Video games, software and software upgrades | 13.7 |
| Computer hardware | 6.4 |
| E-learning material | 4.7 |
| Medicine | 2 |
| Other | 11.4 |
Two thirds (66%) of persons who made purchases online in the previous twelve months did not experience any problems. Nearly one fifth (18%) stated that Speed of delivery was an issue, while Technical failure of the website and Foreign retailer did not sell to Ireland were both given as a reason by 11% of individuals who made purchases online. Just 3% of respondents cited Problems with fraudulent activity while 7% of individuals had problems with Poor customer service and Wrong or damaged goods or services delivered. See table 4b.
| Table 4(b) Individuals who made purchases online in the last 12 months classified by problems encountered when buying online, 2018 | ||||||||||||||
| % of individuals | ||||||||||||||
| Speed of delivery | Technical failure of the website1 | Foreign retailer did not sell to Ireland | Poor customer service | Wrong or damaged goods or services delivered | Final costs higher than indicated | Poor information re guarantees/ other legal rights | Problems with fraudulent activity | Other | No problems encountered | Unweighted sample | ||||
| State | 18 | 11 | 11 | 7 | 7 | 6 | 5 | 3 | 1 | 66 | 2,824 | |||
| Sex | ||||||||||||||
| Male | 19 | 12 | 12 | 8 | 6 | 5 | 5 | 3 | 1 | 65 | 1,143 | |||
| Female | 18 | 11 | 10 | 7 | 7 | 6 | 4 | 3 | 1 | 68 | 1,681 | |||
| Age group | ||||||||||||||
| 16-29 | 25 | 11 | 9 | 5 | 9 | 5 | 5 | 2 | 1 | 63 | 388 | |||
| 30-44 | 17 | 11 | 13 | 9 | 6 | 7 | 5 | 4 | 1 | 67 | 1,150 | |||
| 45-59 | 15 | 11 | 12 | 8 | 5 | 4 | 4 | 4 | 1 | 67 | 846 | |||
| 60-74 | 12 | 8 | 7 | 5 | 3 | 3 | 3 | 3 | 2 | 74 | 440 | |||
| Principal economic status | ||||||||||||||
| At work | 18 | 12 | 12 | 8 | 6 | 6 | 5 | 3 | 1 | 65 | 1,794 | |||
| Unemployed | 9 | 5 | 4 | 6 | 3 | 1 | 1 | 7 | 0 | 80 | 104 | |||
| Student | 27 | 13 | 12 | 9 | 13 | 4 | 7 | 0 | 0 | 59 | 156 | |||
| Home duties | 18 | 9 | 8 | 4 | 6 | 6 | 3 | 6 | 0 | 70 | 380 | |||
| Retired | 9 | 6 | 6 | 3 | 1 | 2 | 3 | 4 | 3 | 77 | 312 | |||
| Other | 26 | 13 | 12 | 8 | 13 | 9 | 2 | 2 | 0 | 65 | 78 | |||
| Region | ||||||||||||||
| Border | 14 | 10 | 5 | 5 | 4 | 3 | 3 | 3 | 2 | 74 | 344 | |||
| Midland | 17 | 11 | 9 | 8 | 7 | 7 | 4 | 3 | 1 | 68 | 169 | |||
| West | 22 | 13 | 10 | 6 | 6 | 6 | 2 | 4 | 0 | 61 | 304 | |||
| Dublin | 17 | 10 | 14 | 9 | 7 | 5 | 5 | 4 | 2 | 66 | 788 | |||
| Mid-East | 15 | 3 | 8 | 5 | 4 | 3 | 2 | 2 | . | 79 | 229 | |||
| Mid-West | 19 | 7 | 8 | 4 | 7 | 4 | 5 | 3 | 0 | 71 | 287 | |||
| South-East | 24 | 21 | 20 | 14 | 10 | 9 | 10 | 3 | 2 | 54 | 293 | |||
| South-West | 18 | 8 | 14 | 5 | 5 | 3 | 4 | 3 | 0 | 64 | 410 | |||
| Type of household internet connection | ||||||||||||||
| Broadband | 18 | 11 | 11 | 7 | 6 | 5 | 5 | 3 | 1 | 66 | 2,779 | |||
| Narrowband | * | * | * | * | * | * | * | * | * | * | 7 | |||
| No internet | * | * | * | * | * | * | * | * | * | * | 28 | |||
| Unknown internet | * | * | * | * | * | * | * | * | * | * | 10 | |||
| Household composition | ||||||||||||||
| 1 adult, no dependent children | 19 | 8 | 14 | 5 | 5 | 6 | 5 | 5 | 1 | 70 | 373 | |||
| 2 adults no dependent children | 13 | 9 | 11 | 8 | 4 | 4 | 5 | 3 | 1 | 67 | 647 | |||
| 3 or more adults no dependent children | 23 | 14 | 12 | 6 | 9 | 9 | 4 | 2 | 1 | 64 | 383 | |||
| 1 adult with dependent children | 22 | 9 | 4 | 7 | 18 | 3 | 2 | 7 | 1 | 53 | 141 | |||
| 2 adults with dependent children | 18 | 13 | 11 | 8 | 6 | 5 | 6 | 3 | 1 | 67 | 1,010 | |||
| 3 or more adults with dependent children | 21 | 8 | 11 | 7 | 7 | 6 | 5 | 2 | 0 | 70 | 270 | |||
| 1During ordering or payment. | ||||||||||||||
| Note 1: Data are subject to sampling and other survey errors, which are relatively greater in respect of smaller values. | ||||||||||||||
| Note 2: Individuals represent all individuals aged 16-74 who made purchases online in the last 12 months. | ||||||||||||||
| Note 3: More than one reason may be given by respondents. | ||||||||||||||
The overall number of purchases made online in 2018 has increased when compared with the same period in 2017. Over one third (34%) of individuals purchased online six or more times in the previous three months, an overall increase of eight percentage points on 2017. Between six and ten internet purchases were made by one fifth (20%) of internet users, while 15% purchased eleven times or more over the internet. Persons purchasing five times or less has decreased on the same quarter in 2017 - 36% had made three to five online purchases, a decrease of five percentage points on 2017, while the number of individuals purchasing only once or twice online fell three percentage points from 33% in 2017 to 30% in the same period in 2018. See table 4c.
| Table 4(c) Individuals who purchased over the internet in the last 3 months classified by number of purchases made in this period, 2016 to 2018 | ||||||||||||||||||||||
| % of individuals | ||||||||||||||||||||||
| 1 to 2 purchases | 3 to 5 purchases | 6 to 10 purchases | More than 10 purchases | |||||||||||||||||||
| 2016 | 2017 | 2018 | 2016 | 2017 | 2018 | 2016 | 2017 | 2018 | 2016 | 2017 | 2018 | Sample 2018 | ||||||||||
| State | 38 | 33 | 30 | 41 | 41 | 36 | 14 | 17 | 20 | 8 | 9 | 15 | 2,507 | |||||||||
| Sex | ||||||||||||||||||||||
| Male | 38 | 33 | 31 | 41 | 42 | 37 | 13 | 17 | 17 | 8 | 8 | 16 | 991 | |||||||||
| Female | 37 | 33 | 29 | 42 | 41 | 35 | 14 | 17 | 22 | 7 | 9 | 14 | 1,516 | |||||||||
| Age group | ||||||||||||||||||||||
| 16-29 | 46 | 32 | 30 | 40 | 45 | 36 | 11 | 17 | 21 | 3 | 7 | 13 | 336 | |||||||||
| 30-44 | 32 | 31 | 24 | 43 | 40 | 38 | 15 | 18 | 20 | 11 | 10 | 18 | 1,070 | |||||||||
| 45-59 | 38 | 36 | 34 | 41 | 39 | 34 | 14 | 16 | 17 | 8 | 9 | 15 | 751 | |||||||||
| 60-74 | 43 | 44 | 46 | 40 | 38 | 34 | 13 | 14 | 16 | 5 | 4 | 4 | 350 | |||||||||
| Principal economic status | ||||||||||||||||||||||
| At work | 34 | 31 | 25 | 43 | 42 | 37 | 14 | 18 | 21 | 9 | 9 | 17 | 1,631 | |||||||||
| Unemployed | 48 | 44 | 30 | 24 | 37 | 45 | 22 | 12 | 9 | 6 | 8 | 17 | 86 | |||||||||
| Student | 53 | 33 | 38 | 35 | 45 | 31 | 9 | 15 | 20 | 3 | 7 | 11 | 137 | |||||||||
| Home duties | 38 | 38 | 37 | 43 | 39 | 35 | 14 | 14 | 16 | 5 | 9 | 12 | 338 | |||||||||
| Retired | 44 | 42 | 46 | 39 | 39 | 33 | 11 | 15 | 18 | 6 | 3 | 4 | 247 | |||||||||
| Other | 39 | 38 | 47 | 41 | 26 | 28 | 8 | 27 | 9 | 12 | 10 | 16 | 68 | |||||||||
| Region | ||||||||||||||||||||||
| Border | 39 | 37 | 33 | 45 | 41 | 37 | 11 | 16 | 18 | 6 | 6 | 13 | 302 | |||||||||
| Midland | 42 | 43 | 30 | 35 | 36 | 39 | 13 | 10 | 21 | 10 | 11 | 10 | 148 | |||||||||
| West | 37 | 35 | 34 | 49 | 40 | 35 | 11 | 17 | 16 | 4 | 7 | 15 | 280 | |||||||||
| Dublin | 33 | 28 | 24 | 42 | 41 | 36 | 16 | 21 | 23 | 10 | 10 | 17 | 692 | |||||||||
| Mid-East | 38 | 40 | 29 | 38 | 38 | 33 | 18 | 14 | 23 | 6 | 9 | 14 | 207 | |||||||||
| Mid-West | 46 | 30 | 30 | 36 | 43 | 37 | 12 | 16 | 14 | 6 | 11 | 19 | 254 | |||||||||
| South-East | 36 | 38 | 27 | 47 | 39 | 33 | 11 | 18 | 17 | 6 | 5 | 22 | 253 | |||||||||
| South-West | 43 | 31 | 28 | 38 | 46 | 35 | 10 | 14 | 24 | 8 | 10 | 13 | 371 | |||||||||
| Type of household internet connection | ||||||||||||||||||||||
| Broadband | 38 | 33 | 30 | 41 | 41 | 36 | 14 | 17 | 19 | 8 | 9 | 15 | 2,475 | |||||||||
| Narrowband | * | * | * | * | * | * | * | * | * | * | * | * | 5 | |||||||||
| Unknown internet | * | * | * | * | * | * | * | * | * | * | * | * | 19 | |||||||||
| No internet | 0 | 0 | * | 0 | 0 | * | 0 | 0 | * | 0 | 0 | * | 8 | |||||||||
| Household composition | ||||||||||||||||||||||
| 1 adult, no dependent children | 37 | 38 | 36 | 39 | 37 | 37 | 20 | 14 | 16 | 5 | 11 | 10 | 315 | |||||||||
| 2 adults no dependent children | 40 | 32 | 34 | 38 | 43 | 30 | 12 | 18 | 25 | 10 | 7 | 11 | 554 | |||||||||
| 3 or more adults no dependent children | 43 | 33 | 38 | 40 | 44 | 33 | 13 | 17 | 17 | 4 | 7 | 12 | 343 | |||||||||
| 1 adult with dependent children | 38 | 38 | 33 | 42 | 38 | 39 | 12 | 17 | 13 | 8 | 7 | 15 | 128 | |||||||||
| 2 adults with dependent children | 35 | 31 | 21 | 43 | 41 | 40 | 13 | 17 | 20 | 9 | 11 | 20 | 933 | |||||||||
| 3 or more adults with dependent children | 37 | 34 | 32 | 46 | 38 | 36 | 12 | 21 | 20 | 5 | 6 | 12 | 234 | |||||||||
| Note 1: Data are subject to sampling and other survey errors, which are relatively greater in respect of smaller values. | ||||||||||||||||||||||
| Note 2: Individuals represent all individuals aged 16-74 who made purchases online in the previous 3 months. | ||||||||||||||||||||||
| Note 3: * Sample occurrence too small for estimation, i.e., less than 30. | ||||||||||||||||||||||
Online purchasing from National sellers remains by far the most common with three quarters (75%) of persons buying or ordering their goods from National sellers. Purchasing goods or services online from Sellers from other EU countries decreased in 2018 when compared with the same period in 2017, 60% compared with 67% in 2017. Internet purchasing from Sellers from the rest of the world also decreased in 2018, 26% compared with 30% of persons buying online in 2017. See table 4d and figure 6.
Individuals who bought or ordered goods or services online in the previous twelve months from Sellers from other EU countries and/or from Sellers from the rest of the world were asked about the types of goods or services that they bought or ordered online. Note that respondents may have selected more than one option. Over four fifths (81%) purchased physical goods such as electronics, clothes, toys, food, groceries, books, CDs/DVDs, etc. an increase of six percentage points on the same period in 2017. Over half (52%) made holiday arrangements including travel accommodation, while 29% purchased products downloaded or accessed from websites or apps, such products as films, music, apps, games, e-books, e-newspapers, etc. See table 4e.
| Table 4(d) Individuals who bought or ordered goods or services online in the last 12 months by origin1 of seller, 2016 to 2018 | ||||||||||||||||||||
| % of individuals | ||||||||||||||||||||
| National sellers | Sellers from other EU countries | Sellers from the rest of the world | Country of origin of seller is unknown | |||||||||||||||||
| 2016 | 2017 | 2018 | 2016 | 2017 | 2018 | 2016 | 2017 | 2018 | 2016 | 2017 | 2018 | Sample 2018 | ||||||||
| State | 79 | 74 | 75 | 58 | 67 | 60 | 23 | 30 | 26 | 4 | 4 | 3 | 2,824 | |||||||
| Sex | ||||||||||||||||||||
| Male | 79 | 74 | 73 | 60 | 67 | 63 | 26 | 33 | 30 | 4 | 5 | 3 | 1,143 | |||||||
| Female | 80 | 75 | 78 | 56 | 66 | 56 | 21 | 28 | 23 | 4 | 4 | 3 | 1,681 | |||||||
| Age group | ||||||||||||||||||||
| 16-29 | 73 | 68 | 65 | 55 | 68 | 58 | 21 | 32 | 26 | 5 | 6 | 3 | 388 | |||||||
| 30-44 | 82 | 76 | 81 | 60 | 69 | 64 | 24 | 32 | 28 | 4 | 4 | 3 | 1,150 | |||||||
| 45-59 | 80 | 79 | 78 | 60 | 64 | 59 | 25 | 26 | 27 | 4 | 4 | 5 | 846 | |||||||
| 60-74 | 80 | 76 | 75 | 54 | 60 | 46 | 22 | 23 | 19 | 4 | 5 | 1 | 440 | |||||||
| Principal economic status | ||||||||||||||||||||
| At work | 82 | 77 | 81 | 63 | 69 | 64 | 24 | 32 | 28 | 3 | 4 | 3 | 1,794 | |||||||
| Unemployed | 74 | 57 | 67 | 53 | 59 | 52 | 19 | 34 | 21 | 3 | 3 | 4 | 104 | |||||||
| Student | 69 | 65 | 57 | 51 | 64 | 56 | 22 | 27 | 29 | 5 | 8 | 1 | 156 | |||||||
| Home duties | 78 | 72 | 68 | 48 | 63 | 52 | 18 | 26 | 17 | 6 | 4 | 5 | 380 | |||||||
| Retired | 79 | 82 | 80 | 56 | 60 | 50 | 27 | 21 | 21 | 4 | 3 | 1 | 312 | |||||||
| Other | 72 | 82 | 70 | 43 | 67 | 57 | 20 | 31 | 27 | 3 | 8 | 2 | 78 | |||||||
| Region | ||||||||||||||||||||
| Border | 91 | 81 | 76 | 58 | 48 | 51 | 23 | 16 | 20 | 0 | 2 | 1 | 344 | |||||||
| Midlands | 85 | 75 | 72 | 42 | 59 | 51 | 13 | 18 | 20 | 2 | 5 | 4 | 169 | |||||||
| West | 78 | 76 | 81 | 47 | 56 | 52 | 15 | 25 | 17 | 1 | 6 | 2 | 304 | |||||||
| Dublin | 79 | 76 | 78 | 64 | 77 | 76 | 26 | 39 | 43 | 5 | 6 | 3 | 788 | |||||||
| Mid-East | 73 | 72 | 69 | 53 | 62 | 64 | 22 | 25 | 34 | 4 | 2 | 3 | 229 | |||||||
| Mid-West | 82 | 75 | 75 | 63 | 70 | 74 | 26 | 33 | 33 | 3 | 5 | 4 | 287 | |||||||
| South-East | 78 | 73 | 79 | 61 | 64 | 65 | 26 | 35 | 28 | 4 | 3 | 4 | 293 | |||||||
| South-West | 75 | 69 | 74 | 57 | 68 | 60 | 21 | 27 | 33 | 6 | 3 | 3 | 410 | |||||||
| Type of household Internet connection | ||||||||||||||||||||
| Broadband | 80 | 74 | 76 | 59 | 67 | 60 | 23 | 30 | 26 | 4 | 4 | 3 | 2,779 | |||||||
| Narrowband | 81 | * | * | 63 | * | * | 30 | * | * | 8 | * | * | 7 | |||||||
| No internet | [78] | [76] | * | [43] | [59] | * | [17] | [20] | * | [2] | [5] | * | 28 | |||||||
| Unknown internet | 0 | 0 | * | 0 | 0 | * | 0 | 0 | * | 0 | 0 | * | 10 | |||||||
| Household composition | ||||||||||||||||||||
| 1 adult, no dependent children | 79 | 71 | 73 | 60 | 68 | 57 | 28 | 33 | 24 | 3 | 3 | 2 | 373 | |||||||
| 2 adults no dependent children | 81 | 79 | 81 | 60 | 70 | 56 | 24 | 33 | 29 | 4 | 3 | 4 | 647 | |||||||
| 3 or more adults no dependent children | 79 | 72 | 71 | 59 | 72 | 54 | 21 | 34 | 32 | 4 | 5 | 4 | 383 | |||||||
| 1 adult with dependent children | 75 | 71 | 64 | 49 | 57 | 65 | 18 | 21 | 24 | 5 | 7 | 4 | 141 | |||||||
| 2 adults with dependent children | 81 | 76 | 76 | 59 | 65 | 66 | 22 | 29 | 24 | 3 | 5 | 3 | 1,010 | |||||||
| 3 or more adults with dependent children | 74 | 70 | 77 | 56 | 65 | 50 | 26 | 29 | 24 | 6 | 5 | 4 | 270 | |||||||
| 1Country of origin/residence of seller. | ||||||||||||||||||||
| Note 1: Data are subject to sampling and other survey errors, which are relatively greater in respect of smaller values. | ||||||||||||||||||||
| Note 2: Individuals represent all individuals aged 16-74 who use the internet. | ||||||||||||||||||||
| Note 3: * Sample occurrence too small for estimation, i.e., less than 30. | ||||||||||||||||||||
| Note 4: Figures in parentheses [ ] indicate percentages based on small numbers (sample size 30 to 49), and are, therefore, subject to a wide margin of error. | ||||||||||||||||||||
| 2016 | 2017 | 2018 | |
| National sellers | 79.1 | 74.4 | 75.2 |
| Sellers from other EU countries | 58.1 | 66.7 | 59.6 |
| Sellers from the rest of the world | 23 | 30.3 | 26.3 |
| Country of origin of seller is unknown | 3.8 | 4.4 | 3 |
| Table 4(e) Individuals who bought or ordered goods or services online from sellers from other EU countries or the rest of the world by type of purchase, 2017 to 2018 | ||||||||||||||||
| % of individuals | ||||||||||||||||
| Physical goods1 | Products downloaded or accessed from websites or apps2 | Travel accomodation or holiday arrangements3 | Other services4 | |||||||||||||
| 2017 | 2018 | 2017 | 2018 | 2017 | 2018 | 2017 | 2018 | Sample 2018 | ||||||||
| State | 75 | 81 | 31 | 29 | 54 | 52 | 30 | 29 | 1,980 | |||||||
| Gender | ||||||||||||||||
| Male | 73 | 79 | 38 | 34 | 56 | 53 | 30 | 31 | 850 | |||||||
| Female | 76 | 83 | 26 | 25 | 51 | 52 | 31 | 27 | 1,130 | |||||||
| Age group | ||||||||||||||||
| 16-29 | 77 | 79 | 38 | 31 | 44 | 40 | 35 | 26 | 283 | |||||||
| 30-44 | 76 | 85 | 31 | 33 | 59 | 61 | 28 | 32 | 840 | |||||||
| 45-59 | 72 | 78 | 26 | 24 | 56 | 58 | 28 | 31 | 587 | |||||||
| 60-74 | 59 | 72 | 22 | 15 | 59 | 40 | 24 | 13 | 270 | |||||||
| Principal economic status | ||||||||||||||||
| At work | 74 | 82 | 32 | 30 | 60 | 61 | 30 | 33 | 1,315 | |||||||
| Unemployed | 81 | 73 | 17 | 33 | 33 | 39 | 20 | 26 | 64 | |||||||
| Student | 82 | 78 | 43 | 36 | 39 | 32 | 43 | 32 | 118 | |||||||
| Home duties | 72 | 89 | 20 | 23 | 47 | 43 | 25 | 12 | 232 | |||||||
| Retired | 60 | 70 | 20 | 13 | 56 | 47 | 30 | 20 | 197 | |||||||
| Other | 74 | 70 | 34 | 24 | 25 | 31 | 22 | 13 | 54 | |||||||
| Region | ||||||||||||||||
| Border | 60 | 72 | 26 | 24 | 49 | 44 | 26 | 16 | 192 | |||||||
| Midlands | 76 | 83 | 19 | 26 | 51 | 47 | 27 | 31 | 93 | |||||||
| West | 74 | 89 | 31 | 36 | 59 | 60 | 41 | 37 | 171 | |||||||
| Dublin | 75 | 79 | 41 | 39 | 61 | 68 | 30 | 37 | 656 | |||||||
| Mid-East | 74 | 78 | 18 | 27 | 39 | 49 | 26 | 33 | 168 | |||||||
| Mid-West | 82 | 82 | 43 | 29 | 61 | 53 | 43 | 26 | 226 | |||||||
| South-East | 77 | 81 | 20 | 27 | 49 | 54 | 34 | 24 | 202 | |||||||
| South-West | 73 | 77 | 25 | 30 | 45 | 51 | 20 | 25 | 272 | |||||||
| Household composition | ||||||||||||||||
| 1 Adult no dependent children | 69 | 80 | 36 | 23 | 56 | 44 | 31 | 19 | 267 | |||||||
| 2 Adults no dependent children | 71 | 80 | 32 | 31 | 63 | 59 | 31 | 37 | 423 | |||||||
| 3 or more adults no dependent children | 75 | 71 | 42 | 28 | 58 | 50 | 39 | 36 | 272 | |||||||
| 1 Adult with dependent children | 79 | 87 | 22 | 31 | 32 | 34 | 23 | 19 | 97 | |||||||
| 2 Adults with dependent children | 75 | 83 | 28 | 30 | 54 | 53 | 28 | 28 | 738 | |||||||
| 3 or more adults with dependent children | 84 | 82 | 20 | 29 | 35 | 63 | 22 | 25 | 183 | |||||||
| 1Examples include electronics, clothes, toys, food, groceries, books, CDs/DVDs, etc. | ||||||||||||||||
| 2Examples include films, music, apps, games, e-books, e-newspapers, etc. | ||||||||||||||||
| 3Includes tickets and documents received via mail or printed by respondent. | ||||||||||||||||
| 4Examples include tickets for events received via mail, telecom subscriptions, etc. | ||||||||||||||||
| Note 1: Data are subject to sampling and other survey errors, which are relatively greater in respect of smaller values. | ||||||||||||||||
| Note 2:Represents individuals who bought or ordered goods or services online from sellers from other EU countries or the rest of the world in the last 12 months. | ||||||||||||||||
| Note 3: Respondents may have selected more than one option. | ||||||||||||||||
In 2018, almost half (49%) of internet users used storage space on the internet (cloud storage) to save files (such as documents, pictures, music, videos, etc.). When comparing the use of cloud storage by gender, more males than females use this form of file storage (52% versus 47%). This follows the same trend as in previous years. Over six in every ten (62%) of internet users in the 16 to 29 years age group used cloud storage as a method of saving files in 2018, compared with 54% of individuals in the 30 to 44 years age category. By comparison, only 24% of individuals in the 60 to 74 years age group used cloud storage. See table 5.
Over three quarters (76%) of all Students used cloud storage in 2018, an increase of one percentage point on 2017. By comparison, only 27% of Retired persons used the 'cloud' as a form of file storage. Over half (53%) of all persons whose principal economic status was At work used cloud storage in 2018. See table 5.
| Table 5 Individuals1 that use the internet to store files electronically classified by personal characteristics, 2015 to 2018 | ||||||||
| % of individuals | ||||||||
| 2015 | 2016 | 2017 | 2018 | Unweighted sample 2018 | ||||
| State | 44 | 45 | 52 | 49 | 4,044 | |||
| Sex | ||||||||
| Male | 46 | 47 | 55 | 52 | 1,713 | |||
| Female | 41 | 42 | 49 | 47 | 2,331 | |||
| Age group | ||||||||
| 16-29 | 56 | 56 | 67 | 62 | 465 | |||
| 30-44 | 48 | 50 | 57 | 54 | 1,396 | |||
| 45-59 | 33 | 36 | 40 | 43 | 1,244 | |||
| 60-74 | 22 | 21 | 25 | 24 | 939 | |||
| Principal economic status | ||||||||
| At work | 47 | 49 | 56 | 53 | 2,315 | |||
| Unemployed | 35 | 35 | 34 | 33 | 172 | |||
| Student | 60 | 66 | 75 | 76 | 184 | |||
| Home duties | 28 | 26 | 37 | 34 | 576 | |||
| Retired | 26 | 23 | 24 | 27 | 647 | |||
| Other | 28 | 31 | 35 | 35 | 150 | |||
| Region | ||||||||
| Border | 35 | 41 | 40 | 41 | 536 | |||
| Midland | 43 | 43 | 56 | 48 | 264 | |||
| West | 36 | 36 | 57 | 51 | 444 | |||
| Dublin | 51 | 51 | 57 | 57 | 1,071 | |||
| Mid-East | 48 | 48 | 52 | 53 | 320 | |||
| Mid-West | 36 | 38 | 54 | 52 | 408 | |||
| South-East | 41 | 50 | 45 | 49 | 412 | |||
| South-West | 42 | 37 | 47 | 49 | 589 | |||
| Household composition | ||||||||
| 1 adult, no dependent children | 38 | 40 | 43 | 43 | 680 | |||
| 2 adults no dependent children | 45 | 43 | 48 | 43 | 1,040 | |||
| 3 or more adults no dependent children | 48 | 48 | 57 | 56 | 551 | |||
| 1 adult with dependent children | 37 | 42 | 46 | 45 | 182 | |||
| 2 adults with dependent children | 45 | 47 | 57 | 52 | 1,230 | |||
| 3 or more adults with dependent children | 42 | 44 | 46 | 56 | 361 | |||
| 1Individuals aged 16-74 who used the internet in the last 3 months. | ||||||||
| Note 1: Data are subject to sampling and other survey errors, which are relatively greater in respect of smaller values. | ||||||||
| Note 2: Files include documents, pictures, music, video or other files. | ||||||||
Respondents were asked about learning activities which they undertook in the previous twelve months to improve their ICT skills (in the use of computers, software and applications). One in eight (12%) did Free online training or self-study, while 7% undertook Training paid or provided by employer and 6% did On-the-job training. Almost three out of every ten (29%) Students did Free online training or self-study. See table 6a.
Individuals who carried out learning activities in the previous twelve months to improve their ICT skills were asked to specify the field of training. Over three in every ten (31%) such individuals undertook learning activities in the field of Social media, followed closely by Specific software applications for work at 27%. Nearly one fifth (19%) carried out learning in Programming languages (includes learning in the design or management of websites), followed closely by IT security or privacy management and Data analysis or management of databases at 18% and 17% respectively, while 14% undertook learning in the field of Online marketing or e-commerce. See table 6b.
| Table 6(a) Individuals who carried out learning activities to improve their ICT skills1 in the last 12 months, by personal characteristics, 2018 | |||||||||
| % of individuals | |||||||||
| Free online training or self-study | Training paid or provided by employer | On-the-job training2 | Free training provided by public programs or organisations3 | Training paid by yourself | Unweighted sample 2018 | ||||
| State | 12 | 7 | 6 | 5 | 4 | 4,088 | |||
| Sex | |||||||||
| Male | 13 | 8 | 7 | 6 | 5 | 1,727 | |||
| Female | 11 | 7 | 6 | 4 | 3 | 2,361 | |||
| Age Group | |||||||||
| 16-29 | 18 | 6 | 4 | 7 | 4 | 466 | |||
| 30-44 | 12 | 11 | 10 | 5 | 6 | 1,404 | |||
| 45-59 | 9 | 7 | 5 | 4 | 4 | 1,257 | |||
| 60-74 | 4 | 2 | 2 | 3 | 2 | 961 | |||
| Principal Economic Status | |||||||||
| At work | 11 | 12 | 10 | 4 | 5 | 2,326 | |||
| Unemployed | 11 | . | 0 | 3 | 1 | 173 | |||
| Student | 29 | 5 | 3 | 14 | 6 | 184 | |||
| Home duties | 3 | 0 | 0 | 2 | 2 | 587 | |||
| Retired | 6 | 1 | 1 | 5 | 2 | 658 | |||
| Other | 6 | 0 | 0 | 5 | 0 | 160 | |||
| Region | |||||||||
| Border | 9 | 3 | 3 | 5 | 3 | 549 | |||
| Midlands | 13 | 7 | 5 | 4 | 4 | 268 | |||
| West | 13 | 11 | 10 | 6 | 6 | 450 | |||
| Dublin | 17 | 12 | 10 | 5 | 5 | 1,078 | |||
| Mid-East | 7 | 5 | 5 | 5 | 3 | 320 | |||
| Mid-West | 7 | 6 | 3 | 4 | 3 | 411 | |||
| South-East | 12 | 7 | 8 | 5 | 4 | 419 | |||
| South-West | 14 | 12 | 7 | 7 | 5 | 593 | |||
| Type of household internet connection | |||||||||
| Broadband | 12 | 8 | 6 | 5 | 4 | 3,960 | |||
| Narrowband | * | * | * | * | * | 18 | |||
| No internet | 4 | 2 | 3 | 3 | 3 | 94 | |||
| Unknown internet | * | * | * | * | * | 16 | |||
| Household composition | |||||||||
| 1 adult, no dependent children | 11 | 5 | 6 | 6 | 5 | 695 | |||
| 2 adults no dependent children | 8 | 9 | 6 | 5 | 4 | 1,059 | |||
| 3 or more adults no dependent children | 17 | 5 | 4 | 5 | 5 | 553 | |||
| 1 adult with dependent children | 7 | 5 | 4 | 5 | 1 | 182 | |||
| 2 adults with dependent children | 11 | 9 | 8 | 4 | 4 | 1,236 | |||
| 3 or more adults with dependent children | 19 | 7 | 5 | 5 | 3 | 363 | |||
| 1Skills relating to the use of computers, software or applications. | |||||||||
| 2Training from co-workers, supervisors, etc. | |||||||||
| 3Organisations other than person's employer. | |||||||||
| Note 1: Data are subject to sampling and other survey errors, which are relatively greater in respect of smaller values. | |||||||||
| Note 2: Individuals represent all individuals aged 16-74 who use the internet. | |||||||||
| Note 3: * Sample occurrence too small for estimation, i.e., less than 30. | |||||||||
| Table 6(b) Individuals who carried out learning activities in the last 12 months to improve their ICT skills1 by field of training, 2018 | ||||||||||||
| % of individuals | ||||||||||||
| Social media2 | Specific software applications for work | Programming languages3 | IT security or privacy management | Data analysis or management of databases | Online marketing or e-Commerce | Maintenance of computer networks and servers | Other | Unweighted sample | ||||
| State | 31 | 27 | 19 | 18 | 17 | 14 | 12 | 41 | 770 | |||
| Sex | ||||||||||||
| Male | 33 | 27 | 23 | 22 | 20 | 16 | 16 | 43 | 349 | |||
| Female | 29 | 28 | 14 | 13 | 14 | 12 | 6 | 38 | 421 | |||
| Age Group | ||||||||||||
| 16-29 | 31 | 14 | 26 | 11 | 13 | 20 | 10 | 42 | 127 | |||
| 30-44 | 28 | 36 | 19 | 24 | 21 | 11 | 11 | 38 | 346 | |||
| 45-59 | 38 | 32 | 13 | 21 | 19 | 12 | 15 | 39 | 218 | |||
| 60-74 | 25 | 16 | 7 | 5 | 9 | 7 | 9 | 59 | 79 | |||
| Principal Economic Status | ||||||||||||
| At work | 32 | 36 | 15 | 22 | 21 | 13 | 13 | 40 | 567 | |||
| Unemployed | * | * | * | * | * | * | * | * | 25 | |||
| Student | 31 | 8 | 28 | 7 | 12 | 21 | 5 | 46 | 69 | |||
| Home duties | [41] | [22] | [7] | [7] | [2] | [8] | [4] | [42] | 36 | |||
| Retired | 26 | 9 | 17 | 9 | 10 | 8 | 9 | 56 | 58 | |||
| Other | * | * | * | * | * | * | * | * | 15 | |||
| Region | ||||||||||||
| Border | 29 | 21 | 20 | 25 | 17 | 15 | 14 | 45 | 73 | |||
| Midlands | [45] | [19] | [11] | [13] | [10] | [9] | [8] | [38] | 48 | |||
| West | 13 | 38 | 17 | 15 | 28 | 15 | 15 | 52 | 108 | |||
| Dublin | 28 | 30 | 20 | 20 | 24 | 15 | 12 | 45 | 240 | |||
| Mid-East | 29 | 21 | 13 | 22 | 19 | 11 | 17 | 46 | 50 | |||
| Mid-West | 24 | 33 | 29 | 18 | 17 | 5 | 4 | 49 | 59 | |||
| South-East | 30 | 28 | 30 | 23 | 16 | 12 | 13 | 35 | 74 | |||
| South-West | 30 | 34 | 22 | 18 | 20 | 32 | 15 | 31 | 118 | |||
| Type of household internet connection | ||||||||||||
| Broadband | 31 | 28 | 19 | 18 | 17 | 14 | 11 | 41 | 760 | |||
| Narrowband | * | * | * | * | * | * | * | * | 1 | |||
| No internet | * | * | * | * | * | * | * | * | 7 | |||
| Unknown internet | * | * | * | * | * | * | * | * | 2 | |||
| Household composition | ||||||||||||
| 1 adult, no dependent children | 27 | 36 | 15 | 15 | 18 | 12 | 15 | 50 | 131 | |||
| 2 adults no dependent children | 29 | 27 | 18 | 16 | 15 | 17 | 12 | 47 | 173 | |||
| 3 or more adults no dependent children | 32 | 26 | 23 | 17 | 27 | 13 | 15 | 44 | 109 | |||
| 1 adult with dependent children | * | * | * | * | * | * | * | * | 27 | |||
| 2 adults with dependent children | 33 | 29 | 17 | 21 | 14 | 14 | 10 | 34 | 258 | |||
| 3 or more adults with dependent children | 35 | 19 | 29 | 20 | 19 | 12 | 9 | 29 | 72 | |||
| 1Skills relating to the use of computers, software or applications. | ||||||||||||
| 2Examples include Google groups, Facebook, Jive, etc. | ||||||||||||
| 3Includes design or management of websites. | ||||||||||||
| Note 1: Data are subject to sampling and other survey errors, which are relatively greater in respect of smaller values. | ||||||||||||
| Note 2: Individuals represent all individuals aged 16-74 who use the internet. | ||||||||||||
| Note 3: * Sample occurrence too small for estimation, i.e., less than 30. | ||||||||||||
| Note 4: Figures in parentheses [ ] indicate percentages based on small numbers (sample size 30 to 49), and are, therefore, subject to a wide margin of error. | ||||||||||||
| Note 5: More than one field of training may be given by respondents. | ||||||||||||
Respondents were also asked about the computer or mobile device related activities or software related activities which they carried out in the twelve months prior to interview. Installing software or apps was carried out by nearly six in every ten (58%) individuals, an increase of five percentage points on 2017, with 81% of Students carrying out this software-related activity. Nearly two thirds (64%) of individuals whose principal economic status was At work, carried out this activity in the previous twelve months. Over three quarters (77%) of persons in the 16 to 29 years age group also carried out this activity, compared with less than one quarter (24%) of persons in the 60 to 74 years age category. Using software to edit photos, video or audio files was carried out by one third (33%) of individuals in 2018, with 61% of Students carrying out this activity. Transferring files between computers or other devices was carried out by nearly half (46%) of individuals, unchanged from 2017, while Changing the settings of any software (which includes operational systems or security programs) was carried out by 38% of individuals, up one percentage point from 2017. See table 6c.
| Table 6(c) Individuals who carried out computer1 or software related activities in the last 12 months, classified by personal characteristics, 2016 to 2018 | ||||||||||||||||||||||||||||||||||||||||||||
| % of individuals | ||||||||||||||||||||||||||||||||||||||||||||
| Installing software or apps | Using word processing software | Copying or moving files or folders | Transferring files between computers or other devices | Creating presentations or documents2 | Changing the settings of any software3 | Using spreadsheet software | Using advanced functions to organise and analyse data4 | Using software to edit photos, video or audio files | Writing code in a programming language | |||||||||||||||||||||||||||||||||||
| 2016 | 2017 | 2018 | 2016 | 2017 | 2018 | 2016 | 2017 | 2018 | 2016 | 2017 | 2018 | 2016 | 2017 | 2018 | 2016 | 2017 | 2018 | 2016 | 2017 | 2018 | 2016 | 2017 | 2018 | 2016 | 2017 | 2018 | 2016 | 2017 | 2018 | Sample 2018 | ||||||||||||||
| State | 50 | 53 | 58 | 50 | 55 | 53 | 48 | 51 | 50 | 43 | 46 | 46 | 34 | 40 | 39 | 32 | 37 | 38 | 31 | 42 | 36 | 21 | 24 | 34 | 27 | 30 | 33 | 5 | 6 | 6 | 4,088 | |||||||||||||
| Sex | ||||||||||||||||||||||||||||||||||||||||||||
| Male | 55 | 58 | 62 | 53 | 58 | 57 | 53 | 53 | 56 | 49 | 51 | 53 | 38 | 43 | 43 | 38 | 43 | 43 | 35 | 45 | 41 | 24 | 28 | 39 | 30 | 33 | 36 | 8 | 9 | 9 | 1,727 | |||||||||||||
| Female | 45 | 48 | 54 | 48 | 53 | 50 | 43 | 48 | 45 | 37 | 41 | 40 | 31 | 37 | 36 | 27 | 32 | 33 | 27 | 39 | 32 | 18 | 21 | 30 | 25 | 26 | 31 | 3 | 3 | 3 | 2,361 | |||||||||||||
| Age group | ||||||||||||||||||||||||||||||||||||||||||||
| 16-29 | 62 | 69 | 77 | 59 | 66 | 68 | 57 | 62 | 62 | 55 | 59 | 57 | 47 | 57 | 56 | 39 | 51 | 49 | 32 | 54 | 43 | 21 | 34 | 43 | 36 | 41 | 45 | 8 | 10 | 9 | 466 | |||||||||||||
| 30-44 | 56 | 58 | 65 | 53 | 58 | 57 | 52 | 55 | 58 | 48 | 51 | 54 | 37 | 41 | 43 | 37 | 42 | 44 | 36 | 45 | 39 | 26 | 28 | 38 | 31 | 34 | 39 | 6 | 7 | 8 | 1,404 | |||||||||||||
| 45-59 | 40 | 41 | 48 | 46 | 49 | 46 | 41 | 42 | 43 | 35 | 37 | 38 | 28 | 30 | 31 | 25 | 27 | 31 | 29 | 35 | 34 | 19 | 18 | 31 | 20 | 21 | 26 | 3 | 3 | 4 | 1,257 | |||||||||||||
| 60-74 | 25 | 25 | 24 | 32 | 37 | 29 | 29 | 28 | 24 | 22 | 20 | 19 | 13 | 17 | 12 | 15 | 15 | 14 | 15 | 20 | 21 | 9 | 7 | 15 | 11 | 10 | 12 | 1 | 1 | 0 | 961 | |||||||||||||
| Principal economic status | ||||||||||||||||||||||||||||||||||||||||||||
| At work | 55 | 57 | 64 | 56 | 60 | 60 | 54 | 56 | 59 | 48 | 51 | 53 | 38 | 43 | 44 | 36 | 41 | 42 | 38 | 47 | 41 | 26 | 28 | 40 | 30 | 32 | 37 | 6 | 6 | 7 | 2,326 | |||||||||||||
| Unemployed | 41 | 47 | 49 | 32 | 47 | 43 | 31 | 44 | 38 | 30 | 38 | 38 | 18 | 31 | 29 | 21 | 31 | 37 | 16 | 30 | 27 | 9 | 18 | 24 | 20 | 26 | 23 | 3 | 6 | 6 | 173 | |||||||||||||
| Student | 69 | 70 | 81 | 76 | 80 | 79 | 72 | 73 | 70 | 69 | 70 | 66 | 69 | 77 | 75 | 48 | 55 | 53 | 40 | 68 | 59 | 29 | 42 | 59 | 45 | 51 | 61 | 13 | 13 | 11 | 184 | |||||||||||||
| Home duties | 30 | 31 | 42 | 26 | 29 | 30 | 23 | 24 | 23 | 21 | 21 | 22 | 11 | 12 | 12 | 15 | 19 | 23 | 9 | 16 | 16 | 5 | 5 | 13 | 12 | 15 | 11 | 1 | 1 | 1 | 587 | |||||||||||||
| Retired | 27 | 26 | 28 | 34 | 34 | 27 | 30 | 25 | 22 | 23 | 20 | 19 | 12 | 12 | 16 | 16 | 16 | 16 | 14 | 16 | 18 | 8 | 6 | 13 | 12 | 9 | 17 | 1 | 1 | 3 | 658 | |||||||||||||
| Other | 32 | 43 | 34 | 30 | 31 | 34 | 25 | 27 | 28 | 22 | 22 | 28 | 16 | 12 | 9 | 21 | 23 | 23 | 16 | 14 | 21 | 9 | 7 | 13 | 12 | 12 | 18 | 4 | 1 | 1 | 160 | |||||||||||||
| Region | ||||||||||||||||||||||||||||||||||||||||||||
| Border | 47 | 52 | 58 | 47 | 47 | 60 | 43 | 44 | 60 | 37 | 39 | 39 | 26 | 32 | 45 | 29 | 32 | 31 | 25 | 35 | 32 | 16 | 19 | 30 | 24 | 22 | 40 | 3 | 2 | 7 | 549 | |||||||||||||
| Midlands | 54 | 53 | 55 | 47 | 53 | 48 | 40 | 33 | 44 | 40 | 34 | 40 | 33 | 31 | 35 | 33 | 32 | 37 | 26 | 35 | 32 | 16 | 13 | 30 | 28 | 29 | 22 | 8 | 4 | 5 | 268 | |||||||||||||
| West | 50 | 56 | 61 | 50 | 57 | 56 | 53 | 58 | 52 | 56 | 56 | 57 | 33 | 42 | 40 | 35 | 40 | 34 | 32 | 46 | 41 | 22 | 24 | 41 | 20 | 29 | 39 | 5 | 6 | 4 | 450 | |||||||||||||
| Dublin | 61 | 63 | 72 | 61 | 65 | 67 | 59 | 59 | 63 | 53 | 54 | 60 | 44 | 49 | 50 | 42 | 46 | 50 | 41 | 51 | 51 | 30 | 31 | 49 | 34 | 33 | 41 | 8 | 8 | 8 | 1,078 | |||||||||||||
| Mid-East | 43 | 44 | 55 | 41 | 42 | 43 | 37 | 34 | 48 | 32 | 31 | 42 | 26 | 31 | 33 | 24 | 25 | 35 | 28 | 34 | 33 | 17 | 19 | 32 | 24 | 25 | 28 | 5 | 5 | 5 | 320 | |||||||||||||
| Mid-West | 43 | 55 | 55 | 46 | 58 | 50 | 47 | 62 | 42 | 39 | 56 | 48 | 31 | 45 | 35 | 23 | 46 | 36 | 26 | 48 | 35 | 15 | 35 | 33 | 28 | 45 | 31 | 5 | 8 | 4 | 411 | |||||||||||||
| South-East | 44 | 45 | 61 | 44 | 46 | 51 | 44 | 44 | 53 | 41 | 41 | 45 | 31 | 30 | 40 | 32 | 33 | 45 | 27 | 33 | 37 | 18 | 21 | 34 | 28 | 31 | 40 | 3 | 5 | 10 | 419 | |||||||||||||
| South-West | 39 | 40 | 54 | 47 | 55 | 58 | 42 | 51 | 57 | 35 | 41 | 51 | 30 | 37 | 46 | 24 | 29 | 36 | 23 | 36 | 40 | 14 | 19 | 38 | 21 | 23 | 31 | 4 | 3 | 7 | 593 | |||||||||||||
| Type of household Internet connection | ||||||||||||||||||||||||||||||||||||||||||||
| Broadband | 51 | 54 | 60 | 51 | 56 | 55 | 48 | 51 | 52 | 44 | 47 | 47 | 35 | 40 | 40 | 33 | 38 | 39 | 31 | 42 | 37 | 22 | 25 | 36 | 28 | 30 | 34 | 5 | 6 | 6 | 3,960 | |||||||||||||
| Narrowband | * | * | * | * | * | * | * | * | * | * | * | * | * | * | * | * | * | * | * | * | * | * | * | * | * | * | * | * | * | * | 18 | |||||||||||||
| No internet | 25 | 20 | 36 | 25 | 26 | 16 | 26 | 19 | 18 | 17 | 18 | 13 | 13 | 14 | 8 | 14 | 13 | 22 | 19 | 18 | 23 | 10 | 7 | 4 | 11 | 10 | 14 | 6 | 1 | 2 | 94 | |||||||||||||
| Unknown internet | * | * | * | * | * | * | * | * | * | * | * | * | * | * | * | * | * | * | * | * | * | * | * | * | * | * | * | * | * | * | 16 | |||||||||||||
| Household compostion | ||||||||||||||||||||||||||||||||||||||||||||
| 1 Adult no dependent children | 46 | 50 | 47 | 47 | 54 | 47 | 46 | 49 | 41 | 40 | 42 | 40 | 31 | 36 | 27 | 29 | 36 | 30 | 30 | 40 | 31 | 19 | 24 | 26 | 24 | 25 | 28 | 6 | 6 | 5 | 695 | |||||||||||||
| 2 Adults no dependent children | 47 | 50 | 48 | 50 | 55 | 47 | 45 | 49 | 44 | 40 | 45 | 39 | 30 | 37 | 31 | 31 | 36 | 32 | 31 | 40 | 29 | 22 | 24 | 27 | 24 | 30 | 24 | 6 | 6 | 3 | 1,059 | |||||||||||||
| 3 or more adults no dependent children | 53 | 61 | 67 | 56 | 64 | 62 | 52 | 58 | 60 | 49 | 55 | 52 | 42 | 50 | 53 | 33 | 45 | 42 | 32 | 49 | 46 | 23 | 32 | 45 | 31 | 39 | 45 | 6 | 8 | 11 | 553 | |||||||||||||
| 1 Adult with dependent children | 46 | 48 | 60 | 43 | 49 | 45 | 38 | 41 | 47 | 32 | 35 | 38 | 27 | 32 | 32 | 27 | 28 | 35 | 21 | 35 | 37 | 15 | 19 | 37 | 26 | 22 | 33 | 4 | 4 | 1 | 182 | |||||||||||||
| 2 Adults with dependent children | 52 | 53 | 63 | 52 | 56 | 56 | 50 | 52 | 53 | 46 | 48 | 49 | 35 | 41 | 43 | 35 | 37 | 44 | 34 | 43 | 37 | 23 | 24 | 36 | 28 | 30 | 37 | 6 | 5 | 6 | 1,236 | |||||||||||||
| 3 or more adults with dependent children | 50 | 47 | 67 | 46 | 44 | 58 | 46 | 42 | 56 | 43 | 38 | 57 | 36 | 32 | 47 | 30 | 33 | 35 | 27 | 34 | 41 | 15 | 18 | 41 | 29 | 20 | 34 | 4 | 5 | 7 | 363 | |||||||||||||
| 1Includes mobile device related activities. | ||||||||||||||||||||||||||||||||||||||||||||
| 2Including integrating text, pictures, tables or charts. | ||||||||||||||||||||||||||||||||||||||||||||
| 3Including operational systems or security programs. | ||||||||||||||||||||||||||||||||||||||||||||
| 4Examples include sorting, filtering, using formulas, creating charts, etc. | ||||||||||||||||||||||||||||||||||||||||||||
| Note 1: Data are subject to sampling and other survey errors, which are relatively greater in respect of smaller values. | ||||||||||||||||||||||||||||||||||||||||||||
| Note 2: Individuals represent all individuals aged 16-74 who use the internet. | ||||||||||||||||||||||||||||||||||||||||||||
| Note 3: * Sample occurrence too small for estimation, i.e., less than 30. | ||||||||||||||||||||||||||||||||||||||||||||
| Note 4: Respondents may have selected more than one option. | ||||||||||||||||||||||||||||||||||||||||||||
In 2018, respondents whose principal economic status was At work were asked about their use of computers (including desktop computers, laptops, smartphones, tablets or other portable devices) at work and the type of ICT-related activities which they carry out at least once a week. Exchange e-mails or enter data into databases was carried out by over four fifths (81%) of persons in employment, while six in every ten (60%) Create or edit electronic documents. The Use of occupational specific software (such as for design, data analysis, processing, etc.) was carried out by 41% of persons in employment, while Develop or maintain IT systems or software was carried out by over one in eight (13%). See table 7.
| Table 7 Individuals who use computers, laptops, smartphones, tablets or other portable devices at work by type of activity1, 2018 | |||||||||
| % of individuals | |||||||||
| Exchange e-mails or enter data into databases | Create or edit electronic documents | Use social media for work | Use of applications to receive tasks or instructions2 | Use of occupational specific software3 | Develop or maintain IT systems or software | Unweighted sample 2018 | |||
| State | 81 | 60 | 23 | 40 | 41 | 13 | 1,683 | ||
| Sex | |||||||||
| Male | 79 | 58 | 23 | 41 | 45 | 15 | 768 | ||
| Female | 84 | 62 | 23 | 38 | 37 | 10 | 915 | ||
| Age Group | |||||||||
| 16-29 | 74 | 59 | 18 | 41 | 33 | 11 | 150 | ||
| 30-44 | 82 | 64 | 25 | 44 | 48 | 16 | 787 | ||
| 45-59 | 84 | 55 | 23 | 36 | 38 | 10 | 623 | ||
| 60-74 | 77 | 55 | 10 | 22 | 22 | 5 | 123 | ||
| Region | |||||||||
| Border | 81 | 53 | 25 | 27 | 33 | 15 | 155 | ||
| Midlands | 80 | 56 | 15 | 42 | 41 | 11 | 102 | ||
| West | 83 | 63 | 23 | 44 | 40 | 12 | 224 | ||
| Dublin | 83 | 72 | 31 | 42 | 50 | 16 | 496 | ||
| Mid-East | 79 | 56 | 31 | 46 | 36 | 13 | 144 | ||
| Mid-West | 83 | 60 | 26 | 26 | 41 | 5 | 173 | ||
| South-East | 80 | 61 | 24 | 45 | 46 | 19 | 163 | ||
| South-West | 83 | 64 | 21 | 35 | 42 | 16 | 226 | ||
| 1Carry out activity at work at least once a week. | |||||||||
| 2Excludes e-mails. | |||||||||
| 3Examples include for design, data analysis, processing, etc. | |||||||||
| Note 1: Data are subject to sampling and other survey errors, which are relatively greater in respect of smaller values. | |||||||||
| Note 2: Individuals represent all individuals aged 16-74 who use computers, laptops, smartphones, tablets or other portable devices at work. | |||||||||
| Note 3: More than one field of training may be given by respondents. | |||||||||
In 2018, respondents were asked about providing personal information online and how they managed access to their personal information on the internet. Personal identification details (name, date of birth, identity card number, etc.) and Payment details (credit or debit card details, bank account number, etc.) had been provided by up to two-thirds and over of all individuals who had used the internet in the twelve months prior to interview. Contact details (such as home address, phone number, e-mail address, etc.) had been provided by almost three quarters (74%) of internet users, an increase of six percentage points on the same survey period in 2016. Up to four fifths and over of persons in the 16 to 29 years age group provided Personal identification details, Payment details and Contact details in the previous twelve months. See table 8a.
Other personal information (person's photos, current location, health-related information, employment, income, etc.) was provided by one tenth (10%) of individuals. See Table 8a.
Note that more than one option may have been selected by respondents.
| Table 8(a) Individuals who used the internet in the last 12 months, classified by the type of personal information they provided, 2016 and 2018 | |||||||||||||||||||
| % of individuals | |||||||||||||||||||
| Personal identification details1 | Contact details2 | Payment details3 | Other personal information4 | Did not provide any personal information | |||||||||||||||
| 2016 | 2018 | 2016 | 2018 | 2016 | 2018 | 2016 | 2018 | 2016 | 2018 | Sample 2018 | |||||||||
| State | 64 | 65 | 68 | 74 | 63 | 68 | 18 | 10 | 24 | 20 | 4,088 | ||||||||
| Sex | |||||||||||||||||||
| Male | 66 | 67 | 69 | 71 | 63 | 67 | 17 | 11 | 23 | 19 | 1,727 | ||||||||
| Female | 63 | 64 | 68 | 76 | 62 | 69 | 19 | 9 | 25 | 20 | 2,361 | ||||||||
| Age group | |||||||||||||||||||
| 16-29 | 69 | 79 | 70 | 82 | 61 | 80 | 27 | 16 | 18 | 8 | 466 | ||||||||
| 30-44 | 70 | 70 | 74 | 82 | 69 | 76 | 20 | 10 | 19 | 13 | 1,404 | ||||||||
| 45-59 | 60 | 57 | 65 | 65 | 61 | 60 | 11 | 8 | 28 | 28 | 1,257 | ||||||||
| 60-74 | 48 | 42 | 53 | 53 | 48 | 43 | 7 | 5 | 41 | 43 | 961 | ||||||||
| Principal economic status | |||||||||||||||||||
| At work | 70 | 69 | 75 | 79 | 71 | 73 | 18 | 11 | 18 | 16 | 2,326 | ||||||||
| Unemployed | 61 | 58 | 62 | 65 | 52 | 56 | 24 | 11 | 26 | 28 | 173 | ||||||||
| Student | 52 | 84 | 57 | 82 | 52 | 85 | 8 | 14 | 37 | 5 | 184 | ||||||||
| Home duties | 53 | 49 | 59 | 65 | 51 | 57 | 14 | 6 | 35 | 30 | 587 | ||||||||
| Retired | 43 | 47 | 46 | 54 | 35 | 48 | 9 | 3 | 48 | 40 | 658 | ||||||||
| Other | 80 | 48 | 71 | 55 | 60 | 53 | 26 | 17 | 14 | 31 | 160 | ||||||||
| Region | |||||||||||||||||||
| Border | 65 | 56 | 72 | 67 | 57 | 63 | 22 | 11 | 24 | 23 | 549 | ||||||||
| Midlands | 52 | 56 | 56 | 66 | 55 | 62 | 7 | 5 | 33 | 26 | 268 | ||||||||
| West | 78 | 69 | 78 | 81 | 70 | 76 | 18 | 13 | 15 | 16 | 450 | ||||||||
| Dublin | 69 | 68 | 74 | 82 | 69 | 77 | 22 | 18 | 21 | 14 | 1,078 | ||||||||
| Mid-East | 70 | 73 | 73 | 77 | 65 | 73 | 17 | 8 | 23 | 17 | 320 | ||||||||
| Mid-West | 61 | 76 | 65 | 79 | 58 | 68 | 17 | 11 | 25 | 15 | 411 | ||||||||
| South-East | 63 | 70 | 65 | 78 | 58 | 71 | 12 | 19 | 28 | 16 | 419 | ||||||||
| South-West | 51 | 68 | 55 | 72 | 57 | 69 | 17 | 6 | 28 | 19 | 593 | ||||||||
| Household compostion | |||||||||||||||||||
| 1 Adult no dependent children | 61 | 52 | 62 | 62 | 57 | 57 | 14 | 12 | 29 | 32 | 695 | ||||||||
| 2 Adults no dependent children | 64 | 61 | 69 | 67 | 65 | 62 | 17 | 9 | 25 | 25 | 1,059 | ||||||||
| 3 or more adults no dependent children | 65 | 73 | 68 | 79 | 62 | 74 | 20 | 13 | 23 | 17 | 553 | ||||||||
| 1 Adult with dependent children | 61 | 64 | 63 | 69 | 50 | 66 | 20 | 11 | 30 | 20 | 182 | ||||||||
| 2 Adults with dependent children | 67 | 68 | 73 | 80 | 67 | 73 | 18 | 9 | 19 | 14 | 1,236 | ||||||||
| 3 or more adults with dependent children | 61 | 74 | 65 | 77 | 59 | 75 | 22 | 13 | 27 | 13 | 363 | ||||||||
| 1Examples includes name, date of birth, identity card number, etc. | |||||||||||||||||||
| 2Examples include home address, phone number, e-mail address, etc. | |||||||||||||||||||
| 3Examples include credit or debit card number, bank account number, etc. | |||||||||||||||||||
| 4Examples include photos, current location, information related to health, employment, income, etc. | |||||||||||||||||||
| Note 1: Data are subject to sampling and other survey errors, which are relatively greater in respect of smaller values. | |||||||||||||||||||
| Note 2: Individuals represent all individuals aged 16-74 who used the internet in the last 12 months. | |||||||||||||||||||
| Note 3: Respondents may have selected more than one option. | |||||||||||||||||||
The number of individuals who are taking steps to protect their personal information online and have carried out activities to manage personal information online has increased in 2018, when compared with the same period in 2016. In 2018, 38% of individuals who had used the internet in the previous twelve months restricted access to personal information for advertising purposes, an increase of six percentage points on 2016. Over one third (34%) of individuals surveyed checked that any websites requesting personal information were secure websites, an increase of four percentage points on the same period in 2016. Three in every ten (30%) of individuals read privacy policy statements before providing personal information, while just over one third (34%) limited access to their user profile or content on social networking sites and 27% restricted access to their geographical location. See Table 8b.
In 2018, individuals were also asked about their use of electronic identification procedures for using online services (such as online banking, public services, ordering or buying goods or services online, etc.) in the twelve months prior to interview. Over four fifths (81%) of individuals used a simple login with username and password, while 38% used a procedure involving receiving a code by text message to their mobile phone and almost one third (32%) used a single use PIN code to access such online services. See table 8c.
Note that more than one option may have been selected by respondents.
| Table 8(b) Individuals who used the internet in the last 12 months, classified by the actions taken to protect personal information online, 2016 and 2018 | ||||||||||||||||||||||
| % of individuals | ||||||||||||||||||||||
| Read privacy policy statements before providing personal information | Restricted access to geographical location | Limited access to their profile or content on a social network | Refused to allow use of personal information for advertising purposes | Check security of website if personal information required | Asked websites or search engines for information they hold to update or delete it | |||||||||||||||||
| 2016 | 2018 | 2016 | 2018 | 2016 | 2018 | 2016 | 2018 | 2016 | 2018 | 2016 | 2018 | Sample 2018 | ||||||||||
| State | 26 | 30 | 21 | 27 | 32 | 34 | 32 | 38 | 30 | 34 | 6 | 7 | 4,088 | |||||||||
| Sex | ||||||||||||||||||||||
| Male | 26 | 29 | 22 | 26 | 31 | 31 | 31 | 40 | 31 | 36 | 6 | 8 | 1,727 | |||||||||
| Female | 26 | 30 | 20 | 28 | 34 | 36 | 33 | 36 | 29 | 33 | 6 | 6 | 2,361 | |||||||||
| Age group | ||||||||||||||||||||||
| 16-29 | 24 | 29 | 19 | 27 | 37 | 41 | 31 | 40 | 31 | 35 | 7 | 8 | 466 | |||||||||
| 30-44 | 30 | 35 | 27 | 33 | 39 | 40 | 37 | 45 | 33 | 41 | 7 | 7 | 1,404 | |||||||||
| 45-59 | 26 | 27 | 20 | 27 | 27 | 29 | 31 | 37 | 30 | 32 | 5 | 7 | 1,257 | |||||||||
| 60-74 | 20 | 23 | 11 | 15 | 14 | 14 | 20 | 21 | 18 | 20 | 2 | 1 | 961 | |||||||||
| Principal economic status | ||||||||||||||||||||||
| At work | 29 | 31 | 25 | 32 | 36 | 38 | 37 | 44 | 34 | 38 | 7 | 8 | 2,326 | |||||||||
| Unemployed | 21 | 23 | 18 | 23 | 32 | 28 | 26 | 28 | 27 | 33 | 5 | 6 | 173 | |||||||||
| Student | 22 | 32 | 12 | 22 | 12 | 35 | 21 | 39 | 20 | 33 | 1 | 5 | 184 | |||||||||
| Home duties | 23 | 28 | 17 | 21 | 29 | 30 | 26 | 28 | 22 | 25 | 5 | 5 | 587 | |||||||||
| Retired | 20 | 27 | 14 | 16 | 21 | 15 | 22 | 24 | 17 | 23 | 2 | 2 | 658 | |||||||||
| Other | 36 | 25 | 29 | 20 | 47 | 25 | 40 | 24 | 44 | 30 | 23 | 5 | 160 | |||||||||
| Region | ||||||||||||||||||||||
| Border | 22 | 29 | 24 | 26 | 34 | 31 | 32 | 27 | 24 | 25 | 3 | 5 | 549 | |||||||||
| Midlands | 29 | 24 | 17 | 17 | 34 | 25 | 34 | 29 | 27 | 28 | 6 | 5 | 268 | |||||||||
| West | 25 | 35 | 21 | 28 | 30 | 32 | 27 | 42 | 26 | 41 | 5 | 5 | 450 | |||||||||
| Dublin | 25 | 34 | 26 | 37 | 35 | 45 | 39 | 47 | 34 | 43 | 8 | 8 | 1,078 | |||||||||
| Mid-East | 29 | 22 | 19 | 23 | 32 | 26 | 32 | 33 | 32 | 25 | 3 | 8 | 320 | |||||||||
| Mid-West | 28 | 36 | 20 | 32 | 27 | 36 | 30 | 48 | 24 | 36 | 6 | 6 | 411 | |||||||||
| South-East | 29 | 36 | 17 | 41 | 31 | 51 | 22 | 51 | 31 | 50 | 11 | 10 | 419 | |||||||||
| South-West | 27 | 26 | 17 | 27 | 31 | 36 | 30 | 39 | 29 | 30 | 4 | 9 | 593 | |||||||||
| Household compostion | ||||||||||||||||||||||
| 1 Adult no dependent children | 27 | 25 | 19 | 23 | 29 | 26 | 31 | 29 | 30 | 27 | 4 | 6 | 695 | |||||||||
| 2 Adults no dependent children | 26 | 26 | 22 | 23 | 30 | 30 | 34 | 37 | 30 | 32 | 7 | 6 | 1,059 | |||||||||
| 3 or more adults no dependent children | 25 | 32 | 19 | 30 | 31 | 39 | 32 | 38 | 30 | 32 | 7 | 6 | 553 | |||||||||
| 1 Adult with dependent children | 22 | 26 | 18 | 26 | 36 | 35 | 31 | 43 | 28 | 41 | 6 | 6 | 182 | |||||||||
| 2 Adults with dependent children | 28 | 33 | 24 | 32 | 36 | 38 | 35 | 42 | 32 | 38 | 6 | 7 | 1,236 | |||||||||
| 3 or more adults with dependent children | 26 | 33 | 19 | 25 | 29 | 31 | 24 | 36 | 24 | 36 | 7 | 6 | 363 | |||||||||
| Note 1: Data are subject to sampling and other survey errors, which are relatively greater in respect of smaller values. | ||||||||||||||||||||||
| Note 2: Individuals represent all individuals aged 16-74 who used the internet in the last 12 months. | ||||||||||||||||||||||
| Note 3: Respondents may have selected more than one option. | ||||||||||||||||||||||
| Table 8(c) Individuals who used electronic identification procedures for using online services1 for private purposes in the last 12 months, 2018 | |||||||||||
| % of individuals | |||||||||||
| Simple login with username and password | Social media login used for other services | Security token2 | Electronic identification certificate or card used with a card reader | Procedure involving your mobile phone3 | Single use pin code4 | Other electronic identification procedure | Unweighted sample | ||||
| State | 81 | 42 | 11 | 10 | 38 | 32 | 4 | 4,088 | |||
| Sex | |||||||||||
| Male | 82 | 41 | 13 | 10 | 39 | 32 | 6 | 1,727 | |||
| Female | 79 | 43 | 9 | 9 | 37 | 32 | 3 | 2,361 | |||
| Age group | |||||||||||
| 16-29 | 88 | 58 | 13 | 7 | 45 | 32 | 4 | 466 | |||
| 30-44 | 86 | 47 | 14 | 13 | 44 | 41 | 5 | 1,404 | |||
| 45-59 | 74 | 32 | 9 | 11 | 33 | 27 | 6 | 1,257 | |||
| 60-74 | 66 | 17 | 5 | 6 | 20 | 18 | 2 | 961 | |||
| Principal economic status | |||||||||||
| At work | 85 | 43 | 13 | 12 | 44 | 38 | 6 | 2,326 | |||
| Unemployed | 72 | 40 | 8 | 9 | 30 | 22 | 3 | 173 | |||
| Student | 91 | 61 | 12 | 7 | 46 | 31 | 4 | 184 | |||
| Home duties | 72 | 37 | 7 | 6 | 26 | 23 | 2 | 587 | |||
| Retired | 68 | 15 | 5 | 5 | 19 | 19 | 2 | 658 | |||
| Other | 60 | 37 | 7 | 8 | 20 | 21 | 2 | 160 | |||
| Region | |||||||||||
| Border | 69 | 29 | 11 | 12 | 20 | 22 | 3 | 549 | |||
| Midland | 79 | 36 | 7 | 7 | 30 | 32 | 4 | 268 | |||
| West | 83 | 40 | 12 | 7 | 41 | 29 | 4 | 450 | |||
| Dublin | 85 | 45 | 19 | 15 | 47 | 41 | 6 | 1,078 | |||
| Mid-East | 74 | 49 | 10 | 10 | 34 | 26 | 3 | 320 | |||
| Mid-West | 84 | 42 | 11 | 9 | 41 | 38 | 5 | 411 | |||
| South-East | 89 | 50 | 15 | 12 | 56 | 33 | 7 | 419 | |||
| South-West | 82 | 52 | 12 | 14 | 41 | 35 | 4 | 593 | |||
| Type of household internet connection | |||||||||||
| Broadband | 81 | 42 | 11 | 10 | 39 | 33 | 5 | 3,960 | |||
| Narrowband | * | * | * | * | * | * | * | 18 | |||
| No internet | 65 | 30 | 4 | 5 | 23 | 13 | 4 | 94 | |||
| Unknown internet | * | * | * | * | * | * | * | 16 | |||
| Household composition | |||||||||||
| 1 adult, no dependent children | 75 | 36 | 11 | 10 | 30 | 28 | 4 | 695 | |||
| 2 adults no dependent children | 73 | 33 | 10 | 8 | 33 | 25 | 3 | 1,059 | |||
| 3 or more adults no dependent children | 86 | 46 | 12 | 9 | 39 | 37 | 6 | 553 | |||
| 1 adult with dependent children | 85 | 46 | 17 | 10 | 45 | 26 | 3 | 182 | |||
| 2 adults with dependent children | 84 | 46 | 12 | 11 | 42 | 37 | 5 | 1,236 | |||
| 3 or more adults with dependent children | 83 | 48 | 9 | 11 | 40 | 34 | 5 | 363 | |||
| 1Examples include online banking, public services, ordering or buying goods or services online, etc. | |||||||||||
| 2Physical device used to gain access to an electronically restricted resource such as online banking. The token is used in addition to or in place of a password. It acts like an electronic access key. | |||||||||||
| 3Involves receiving a code received via text message. | |||||||||||
| 4Examples include plastic card with codes, scratch codes, etc. or random characters of a password. | |||||||||||
| Note 1: Data are subject to sampling and other survey errors, which are relatively greater in respect of smaller values. | |||||||||||
| Note 2: Individuals represent all individuals aged 16-74 who made purchases online in the last 12 months. | |||||||||||
| Note 3: * Sample occurrence too small for estimation, i.e., less than 30. | |||||||||||
| Note 4: More than one electronic identification procedure may be given by respondents. | |||||||||||
In 2018, respondents were asked about their use of smartphones for private purposes. Overall, more than three quarters (77%) of all individuals aged 16 to 74 years use a smartphone for private purposes. Smartphone usage increases for persons who used the internet within the previous year - nine tenths of persons who have used the internet in the previous twelve months, used a smartphone. Smartphone usage was highest for Students at 98%. For individuals who have used the internet within the last twelve months, there was little difference between deprivation quintiles - 94% of persons in the Fifth quintile - very affluent deprivation quintile who recently used the internet (within the last three months) use a smartphone compared with 90% of persons in the First quintile - very disadvantaged deprivation quintile. See table 9a.
| Table 9(a) Individuals who use a smartphone for private purposes, 2018 | |||||||
| % of individuals | |||||||
| All individuals | Individuals who used the internet within last 12 months | Individuals who used the internet within last 3 months | Unweighted sample | ||||
| State | 77 | 90 | 91 | 5,291 | |||
| Sex | |||||||
| Male | 76 | 90 | 90 | 2,312 | |||
| Female | 78 | 90 | 91 | 2,979 | |||
| Age group | |||||||
| 16-29 | 95 | 96 | 97 | 474 | |||
| 30-44 | 96 | 97 | 98 | 1,437 | |||
| 45-59 | 77 | 86 | 87 | 1,450 | |||
| 60-74 | 37 | 67 | 68 | 1,930 | |||
| Principal economic status | |||||||
| At work | 89 | 94 | 94 | 2,509 | |||
| Unemployed | 82 | 89 | 91 | 202 | |||
| Student | 98 | 98 | 98 | 186 | |||
| Home duties | 67 | 84 | 86 | 819 | |||
| Retired | 37 | 65 | 66 | 1,284 | |||
| Other | 48 | 80 | 82 | 291 | |||
| Region | |||||||
| Border | 71 | 88 | 89 | 795 | |||
| Midland | 76 | 89 | 91 | 362 | |||
| West | 75 | 90 | 91 | 602 | |||
| Dublin | 88 | 95 | 96 | 1,301 | |||
| Mid-East | 81 | 91 | 91 | 377 | |||
| Mid-West | 77 | 90 | 90 | 523 | |||
| South-East | 76 | 90 | 91 | 547 | |||
| South-West | 76 | 89 | 90 | 784 | |||
| Type of household internet connection | |||||||
| Broadband | 87 | 91 | 91 | 4,364 | |||
| Narrowband | * | * | * | 22 | |||
| No internet | 19 | 70 | 85 | 876 | |||
| Unknown internet | * | * | * | 29 | |||
| Household composition | |||||||
| 1 adult, no dependent children | 49 | 80 | 81 | 1,296 | |||
| 2 adults no dependent children | 67 | 83 | 85 | 1,501 | |||
| 3 or more adults no dependent children | 84 | 91 | 92 | 644 | |||
| 1 adult with dependent children | 94 | 97 | 97 | 190 | |||
| 2 adults with dependent children | 94 | 96 | 97 | 1,275 | |||
| 3 or more adults with dependent children | 91 | 93 | 94 | 385 | |||
| Deprivation quintile | |||||||
| First quintile - very disadvataged | 71 | 89 | 90 | 1,173 | |||
| Second quintile - disadvantaged | 73 | 88 | 89 | 1,050 | |||
| Third quintile - average | 74 | 89 | 91 | 1,077 | |||
| Fourth quintile - affluent | 85 | 92 | 92 | 1,104 | |||
| Fifth quintile - very affluent | 88 | 94 | 94 | 887 | |||
| Note 1: Data are subject to sampling and other survey errors, which are relatively greater in respect of smaller values. | |||||||
| Note 2: Individuals represent all individuals aged 16-74. | |||||||
| Note 3: * Sample occurrence too small for estimation, i.e., less than 30. | |||||||
Smartphone users were asked about their usage of security software or service on smartphones used for private purposes. Close to half (48%) of smartphone users had security software installed automatically or was provided with the operating system, while 9% had installed it themselves or were assisted by somebody else or had subscribed to it. Almost four in ten (39%) smartphone users had not used any security software or service on their smartphones. See table 9b.
Respondents were also asked about security precautions which they took when installing applications (apps) on their smartphones. Nearly six tenths (59%) had Restricted or refused access to personal data when using or installing an application (app) on smartphone at least once or was provided by the operating system. Nearly two thirds (64%) of persons in the 16 to 44 age cohort restricted or refused access to personal data when installing or using apps, compared with just 36% of persons in the 60 to 74 years age group. Nearly three tenths (28%) did not restrict or refuse access to personal data when installing or using apps, while 5% did not know they could do so. Almost one in ten (9%) do not use apps. Nearly one quarter (23%) of smartphone users in the 60 to 74 years age group do not use apps, compared with only 2% of smartphone users aged 16 to 29 years. See table 9c.
| Table 9(b) Individuals' usage of security software or service1 on smartphones used for private purposes, 2018 | ||||||||
| % of individuals | ||||||||
| Yes, installed automatically or provided with the operating system | Yes, respondent installed it or subscribed to it or somebody else did it | No, did not use any security software or service on smartphone | Do not know | Unweighted sample | ||||
| State | 48 | 9 | 39 | 5 | 3,701 | |||
| Sex | ||||||||
| Male | 48 | 11 | 41 | 2 | 1,551 | |||
| Female | 49 | 6 | 38 | 7 | 2,150 | |||
| Age group | ||||||||
| 16-29 | 44 | 7 | 45 | 5 | 450 | |||
| 30-44 | 52 | 11 | 35 | 3 | 1,373 | |||
| 45-59 | 50 | 8 | 39 | 5 | 1,143 | |||
| 60-74 | 44 | 6 | 39 | 11 | 735 | |||
| Principal economic status | ||||||||
| At work | 53 | 9 | 36 | 4 | 2,219 | |||
| Unemployed | 28 | 11 | 58 | 6 | 159 | |||
| Student | 37 | 9 | 49 | 6 | 180 | |||
| Home duties | 51 | 6 | 37 | 7 | 521 | |||
| Retired | 46 | 7 | 40 | 8 | 487 | |||
| Other | 47 | 11 | 38 | 6 | 135 | |||
| Region | ||||||||
| Border | 40 | 8 | 49 | 4 | 493 | |||
| Midland | 49 | 10 | 37 | 4 | 243 | |||
| West | 49 | 9 | 37 | 8 | 398 | |||
| Dublin | 51 | 8 | 39 | 5 | 1,013 | |||
| Mid-East | 43 | 6 | 47 | 5 | 296 | |||
| Mid-West | 56 | 12 | 28 | 7 | 371 | |||
| South-East | 55 | 6 | 36 | 5 | 371 | |||
| South-West | 40 | 8 | 49 | 5 | 516 | |||
| Household composition | ||||||||
| 1 adult, no dependent children | 47 | 7 | 41 | 6 | 581 | |||
| 2 adults no dependent children | 49 | 8 | 38 | 6 | 894 | |||
| 3 or more adults no dependent children | 46 | 12 | 38 | 6 | 504 | |||
| 1 adult with dependent children | 42 | 6 | 46 | 7 | 177 | |||
| 2 adults with dependent children | 54 | 8 | 36 | 3 | 1,201 | |||
| 3 or more adults with dependent children | 37 | 9 | 50 | 6 | 344 | |||
| Deprivation quintile | ||||||||
| First quintile - very disadvataged | 43 | 11 | 44 | 3 | 711 | |||
| Second quintile - disadvantaged | 43 | 10 | 42 | 6 | 683 | |||
| Third quintile - average | 55 | 7 | 34 | 6 | 713 | |||
| Fourth quintile - affluent | 49 | 9 | 39 | 4 | 849 | |||
| Fifth quintile - very affluent | 54 | 7 | 37 | 4 | 745 | |||
| 1Examples include antivirus, antispam, firewall, etc. | ||||||||
| Note 1: Data are subject to sampling and other survey errors, which are relatively greater in respect of smaller values. | ||||||||
| Note 2: Individuals represent all individuals aged 16-74 who use a smartphone. | ||||||||
| Note 3: * Sample occurrence too small for estimation, i.e., less than 30. | ||||||||
| Table 9(c) Individuals' security precautions taken when installing applications on their smartphones, 2018 | ||||||||
| % of individuals | ||||||||
| Restricted or refused access to personal data1 when using or installing an application (app) on smartphone | ||||||||
| Yes, at least once or provided with the operating system | No | Did not know it was possible | Not applicable do not use apps | Unweighted sample | ||||
| State | 59 | 28 | 5 | 9 | 3,582 | |||
| Sex | ||||||||
| Male | 60 | 29 | 3 | 8 | 1,495 | |||
| Female | 57 | 27 | 7 | 9 | 2,087 | |||
| Age group | ||||||||
| 16-29 | 64 | 30 | 4 | 2 | 450 | |||
| 30-44 | 64 | 27 | 4 | 5 | 1,360 | |||
| 45-59 | 53 | 26 | 5 | 15 | 1,107 | |||
| 60-74 | 36 | 32 | 9 | 23 | 665 | |||
| Principal economic status | ||||||||
| At work | 63 | 27 | 4 | 7 | 2,176 | |||
| Unemployed | 44 | 32 | 7 | 17 | 154 | |||
| Student | 67 | 27 | 4 | 1 | 180 | |||
| Home duties | 52 | 28 | 9 | 11 | 500 | |||
| Retired | 34 | 35 | 9 | 22 | 448 | |||
| Other | 41 | 36 | 3 | 20 | 124 | |||
| Region | ||||||||
| Border | 56 | 34 | 5 | 6 | 470 | |||
| Midland | 51 | 32 | 6 | 11 | 229 | |||
| West | 66 | 24 | 2 | 8 | 388 | |||
| Dublin | 63 | 27 | 4 | 5 | 986 | |||
| Mid-East | 66 | 21 | 5 | 8 | 287 | |||
| Mid-West | 59 | 27 | 4 | 10 | 360 | |||
| South-East | 65 | 24 | 4 | 7 | 359 | |||
| South-West | 55 | 28 | 8 | 8 | 503 | |||
| Type of household internet connection | ||||||||
| Broadband | 59 | 28 | 5 | 8 | 3,493 | |||
| Narrowband | * | * | * | * | 13 | |||
| No internet | 44 | 25 | 2 | 30 | 63 | |||
| Unknown internet | * | * | * | * | 13 | |||
| Household composition | ||||||||
| 1 adult, no dependent children | 53 | 32 | 4 | 12 | 540 | |||
| 2 adults no dependent children | 53 | 27 | 8 | 12 | 847 | |||
| 3 or more adults no dependent children | 59 | 27 | 5 | 9 | 493 | |||
| 1 adult with dependent children | 53 | 37 | 3 | 7 | 176 | |||
| 2 adults with dependent children | 63 | 27 | 4 | 6 | 1,188 | |||
| 3 or more adults with dependent children | 63 | 26 | 3 | 9 | 338 | |||
| 1Examples include person's location, contact list, etc. | ||||||||
| Note 1: Data are subject to sampling and other survey errors, which are relatively greater in respect of smaller values. | ||||||||
| Note 2: Individuals represent all individuals aged 16-74 who use a smartphone and have accessed the internet within the last 12 months. | ||||||||
| Note 3: * Sample occurrence too small for estimation, i.e., less than 30. | ||||||||
Purpose of Survey
The annual Information and Communications Technology (ICT) Household Survey 2018 contributes to the EU requirement under Regulation (EC) No 808/2004 of the European Parliament and of the Council of 21 April 2004 concerning Community Statistics on the Information Society (OJ L143, 30.04.2004, p. 49). It covers a range of topics related to internet penetration and use of ICT by households and individuals.
The survey is conducted annually in the first quarter of the year and asks respondents about their ICT activities over the previous 12 months. Each year, the survey includes a specific group of questions relating to a particular area of ICT. In 2018, additional questions relating to the ICT at work were included.
Questionnaire Design
In previous years, the Information and communications Technology (ICT) was carried out as a module of the Quarterly National Household Survey (QNHS). The Labour Force Survey (LFS) replaced the Quarterly National Household Survey (QNHS) at the beginning of Q3 2017. With this change, modules previously carried out as modules of the QNHS, are now carried out as part of the General Household Survey (GHS). The GHS is a national survey that place takes place three or four times each year. The survey usually has a core of common demographic questions that are always asked (e.g. age, sex, education, etc.). Each survey also has a specific theme: for example, in the second half of 2017, the survey measured participation rates of adults in further education; in the first quarter of 2018 the GHS covered the ICT Household Survey and a survey of Cross Border Shopping.
Here below are the topics we have covered so far:
|
Year |
Quarter |
Topic |
|
2017 |
Quarter 3 and Quarter 4 |
|
|
2018 |
Quarter 1 |
|
|
|
Quarter 2 and Quarter 3 |
You can find more information here: https://www.cso.ie/en/aboutus/takingpartinasurvey/surveysofhouseholdsindividuals/generalhouseholdsurvey/
The ICT Household Survey was based on the implementing Regulation (EU) No 808/2004 and the Model Questionnaire provided by Eurostat https://circabc.europa.eu/sd/a/0a29aaab-924a-4b88-851d-db28bf144748/ICT-HH 2018_Model Questionnaire V1.4.pdf
Reference Period
The Information Communications Technology (ICT) Household Survey is carried out in the three months from January to March each year (Quarter 1). The questionnaire asks questions about ICT activities for the reference period of twelve months prior to the interviews taking place.
Survey Coverage
The ICT Household Survey data is collected directly from private households. Institutional households, (e.g. nursing homes, barracks, boarding schools, hotels etc.) are not covered by the survey. A household is defined as a single person or group of people who usually reside together in the same accommodation and who share the same catering arrangements. The household members are not necessarily related by blood or marriage.
A person is defined as a "Usual Resident" of a private household if he or she
Survey Questionnaire
The ICT Households Survey 2018 was designed in line with the European Community Survey on ICT Usage in Households and By Individuals 2018 Model Questionnaire. The collection of the data under the aforementioned European Regulation implies that harmonised data can be obtained across the European continent.
The 2018 ICT household questionnaire is available at
ICT - Information And Communications Technologies
Data Collection
The data was collected by a team of up to one hundred Field Interviewers and ten Field coordinators (each with a team of ten interviewers). Interviewers were provided with a map of each of their interview areas as well as a listing of the address of each of the selected households. These interviewers also working on CSO surveys such as the Survey on Income and Living Conditions and the Labour Force Survey. Interviewers received a manual with information such as detailed explanations about the questionnaire, definitions of the concepts involved and examples.
It was conducted using a team of face-to-face interviewers using Computer Assisted Personal Interviewing (CAPI). This enabled the use of extensive checks in the BLAISE interviewing software to make sure correct and coherent data was collected.
One person from each household was selected. Information was collected directly from respondents - proxy responses from other members of the household were not accepted.
Sample Design
The sample for the General Household Survey (GHS) is stratified using administrative county and the Pobal HP (Haase and Pratschke) Deprivation Index (quintile). A two-stage sample design is used. In the first stage 1,300 blocks are selected using Probability Proportional to Size (PPS) sampling. In the second stage households are selected using Simple Random Sampling (SRS). This ensures each household in the sample frame has an equal probability of selection.
The total sample size for the ICT Household survey was 9,900 households. The number of valid responding households for the ICT Household Survey in Q1 2018 was 5,291.
The survey results were weighted to agree with population estimates broken down by age, sex and region and are also calibrated to nationality totals
Derivation of Results
To provide national population results, the survey results were weighted to represent the entire population of 16 to 74 year olds. The survey results were weighted to agree with population estimates broken down by age group, sex and region and were also calibrated to nationality totals.
Household weights were calculated for all households in the initial sample. The design weights are computed as the inverse of the selection probability of the unit. The purpose of design weights is to eliminate the bias induced by unequal selection probabilities.
These design weights were then adjusted for non-response. This eliminated the bias introduced by discrepancies caused by non-response, particularly critical when the non-responding households are different from the responding ones in respect to some survey variables as this may create substantial bias in the estimates. Design weights are adjusted for non-response by dividing the design weights of each responding unit in the final/achieved sample by the (weighted) response probability of the corresponding group or strata.
To obtain the final household weights for the results, after the previous steps were carried out, the distribution of households by deprivation, NUTS3 region, sex and age was calibrated to the population of households in Quarter 1 2018 (as derived from the LFS Survey). The CALMAR2-macro, developed by INSEE, was used for this purpose.
Note on Tables
The sum of row or column percentages in the tables in this report may not add to 100.0% due to rounding.
Percentage breakdowns exclude cases where the interviewee did not respond.
Disclosure Control
Estimates for number of persons where there are less than 30 persons in a cell are too small to be considered reliable. These estimates are presented with an asterisk (*) in the relevant tables.
Where there are 30-49 persons in a cell, estimates are considered to have a wider margin of error and should be treated with caution. These cells are presented with parentheses [ ].
In the case of rates, these limits apply to the denominator used in generating the rate. In the case of annual changes, both the current year and the preceding year are taken into account when deciding whether the estimate should be suppressed or flagged as having a wider margin of error.
Reliability of Estimates Presented
Data are subject to sampling and other survey errors, which are relatively greater in respect of smaller values.
Classifications Used
Principal Economic Status Classification
The Principal Economic Status (PES) classification is based on a single question in which respondents are asked what is their usual situation regarding employment and given the following response categories:
Degree of Urbanisation
This classification is created from an aggregation of population density estimates derived from the Census of Population. The categories included in each aggregate are explained below:
Region
The regional classifications in this release are based on the NUTS (Nomenclature of Territorial Units) classification used by Eurostat. The NUTS3 regions correspond to the eight Regional Authorities established under the Local Government Act, 1991 (Regional Authorities) (Establishment) Order, 1993, which came into operation on 1 January 1994. The NUTS2 regions, which were proposed by Government and agreed by Eurostat in 1999, are groupings of the NUTS3 regions. The composition of the regions is set out below.
The composition of the regions is set out below.
|
Border, Midland and Western NUTS2 Region |
Southern and Eastern NUTS2 Region |
||
|
Border |
Cavan |
Dublin |
Dublin City |
|
|
Donegal |
|
Dun Laoghaire-Rathdown |
|
|
Leitrim |
|
Fingal |
|
|
Louth |
|
South Dublin |
|
|
Monaghan |
|
|
|
|
Sligo |
Mid-East |
Kildare |
|
|
|
|
Meath |
|
Midland |
Laois |
|
Wicklow |
|
|
Longford |
Mid-West |
Clare |
|
|
Offaly |
|
Limerick City |
|
|
Westmeath |
|
Limerick County |
|
|
|
|
North Tipperary |
|
West |
Galway City |
|
|
|
|
Galway County |
South-East |
Carlow |
|
|
Mayo |
|
Kilkenny |
|
|
Roscommon |
|
South Tipperary |
|
|
|
|
Waterford City |
|
|
|
|
Waterford County |
|
|
|
|
Wexford |
|
|
|
|
|
|
|
|
South-West |
Cork City |
|
|
|
|
Cork County |
|
|
|
|
Kerry |
Deprivation Index
The Pobal Haase-Pratschke Deprivation Index is used to create the underlying sample and is used to analyse the data. The Index uses Census data to measure levels of disadvantage or affluence in a geographical area. More detailed information on the index can be found here: https://www.pobal.ie/research-analysis/
The results are presented by quintiles, five equal-sized groups of households, with the first quintile representing the the most disadvantaged areas and the fifth quintile representing the least deprived/most affluent area.
The five quintiles are described below:
First Quintile - Very disadvantaged
Second Quintile - Disadvantaged
Third Quintile - Average
Fourth Quintile - Affluent
Fifth Quintile - Very affluent (least deprived)
Household composition
For the purposes of deriving household composition, a child was defined as any member of the household aged 17 or under. Households were analysed as a whole, regardless of the number of family units within the household. The categories of household composition are:
1 adult aged 18+ with no dependent children
2 adults aged 18+ with no ependent children
3 adults aged 18+ with no dependent children
1 adult aged 18+ with dependent children aged <18
2 adults aged 18+ with dependent children aged <18
3 adults aged 18+ with dependent children aged <18
QNHS Social Modules
While the main purpose of the QNHS was the production of quarterly labour force estimates, there is also a provision for the collection of data on social topics through the inclusion of special survey modules. The selection of the major national modules undertaken to date has been largely based on the results of a canvass of users (over 100 organisations) that was conducted by the CSO in 1996, 2002, 2006, 2008 and most recently 2011. The results of the canvass are presented to the National Statistics Board and they are asked to indicate their priorities for the years ahead.
The schedule for social modules in any given year is based on the following structure:
Quarter 1 Accidents and Illness module and Information, Communication and Technology (ICT) Survey
Quarter 2 EU module (always covered under EU legislation)
Quarter 3 National module
Quarter 4 National module
Some of the social modules published to date in the QNHS are outlined below:
Q2 Households and Family Units 2017
Q2 2016 Households and Family Units
Q2 2016 QNHS Union Membership
Irish Health Survey 2015
Q4 2015 Pensions
Q3 2015 Crime and Victimisation
Q2 2015 Households and Family Units
Q3 2014 Equality Module
Q2 2014 Environment Module
Q3 2013 Volunteering and Wellbeing
Q2 2013 Sport and Physical Exercise
Q3 2012 Effect on Households of the Economic Downturn
Q2 2012 Retirement Planning
Q2 2012 Parental Involvement in Children’s Education
Q2 2012 Union Membership
Q1 2012 Unemployment Thematic Report
Q2 2011 Response of Households to the Economic Downturn - Pilot Module
Q2 2011 Voter Participation
Q4 2010 Equality
Q3 2010 Health Status and Health Service Utilisation
Q2 2010 Cross Border Shopping
Q2 2010 Educational Attainment
Q1 2010 Crime and Victimisation
Q4 2009 Pension Provision
Q3 2009 Carers
Q2 2009 Union Membership
Q2 2009 Cross Border Shopping
Q3 2008 Lifelong Learning
Q4 2007 Childcare
Q3 2007 Health Status and Health Service Utilisation
Q3 2006 Sport and Physical Exercise
More historical social modules published are available at:
http://www.cso.ie/en/qnhs/releasesandpublications/qnhs-specialmodules/qnhs-specialmodulesarchive/.
Acknowledgement
The Central Statistics Office wishes to thank the participating households for their co-operation in agreeing to take part in the ICT 2018 Household Survey and for facilitating the collection of the relevant data.
 Hide Background Notes
Scan the QR code below to view this release online or go to
http://www.cso.ie/en/releasesandpublications/er/isshh/informationsocietystatistics-households2018/
 Show Table 1(a) Households with internet access, 2010 to 2018
 Hide Table 1(a) Households with internet access, 2010 to 2018