
| € million | ||
| 2013 | 2014 | |
| Foreign Direct Investment | ||
| Flows - Abroad | 21,863 | 32,511 |
| Flows - In Ireland | 33,816 | 23,465 |
| Positions - Abroad - end year | 390,651 | 522,824 |
| Positions - In Ireland - end year | 284,907 | 311,508 |
| Positions - Net - end year | 105,744 | 211,316 |
| Net Income Flows | -22,928 | -20,867 |
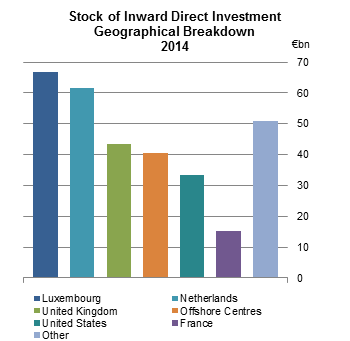
Irish stocks of direct investment abroad increased to €523bn at the end of 2014 from a position of €391bn at the end of 2013. This increase continues to be driven by the Redomiciled plc’s in Ireland - see background note. The end of 2014 stock of direct investment abroad comprised of Equity Capital & Reinvested Earnings of €445bn and Other Capital of €78bn. The rise between the end of 2013 and the end of 2014 was mainly due to increased investment in enterprises located in Europe (€94bn), Central America (€23bn) and the US (€13bn). The increase in Europe was accounted for by additional investment in enterprises located in Luxembourg (€80bn), UK (€12bn) and Netherlands (€7bn) and partially offset by a fall in investment of €14bn in enterprises located in Switzerland - see Table 3.
The stock of total foreign direct investment into Ireland also increased between the end of 2013 and the end of 2014 - from €285bn to €312bn. The main contributors were increases from Central American offshore centres (€13bn), from the US (€11bn) and from European countries (€9bn) - see Table 4.
The net FDI asset position for Ireland at the end of 2014 was a surplus of €211bn, up €106bn from the net position at the end of 2013.
Inward investment flows decreased
Flows of direct investment into Ireland in 2014 were €23bn – down from a €34bn inflow in 2013. Equity investment and reinvested earnings amounted to €16bn and €22bn respectively while there was a withdrawal of other capital investment of €14bn. The main source of inward investment was from the Netherlands (€12bn) followed by investment from Bermuda (€7bn) and the US (€5bn). Investment from Europe fell from €21bn in 2013 to €12bn in 2014 while investment from US fell from €9bn to €5bn in the same period. Similarly, investment from Asia was down from a disinvestment of €1bn in 2013 to a disinvestment of €4bn in 2014 - see Table 2.
| X-axis label | Flows |
|---|---|
| Netherlands | 11741 |
| Bermuda | 7174 |
| United States | 4775 |
| Luxembourg | 3085 |
| Other | -3310 |
During 2014 direct investment flows abroad increased by €11bn to €33bn compared with €22bn in 2013. Investment into Europe of €27bn (mainly Luxembourg €35bn) accounted for most of the total investment. The flows consisted of increases in reinvested earnings and other capital of €14bn and €19bn respectively with a marginal disinvestment of equity investment of €656m - see Table 1.
| X-axis label | Manufacturing | Services |
|---|---|---|
| In Ireland | 78314 | 231853 |
| Abroad | 92599 | 412365 |
Sectoral breakdown
Investment abroad by enterprises located in Ireland was mainly into the services sector - positions of €412bn at the end of 2014 were up €104bn compared to positions at the end of 2013. Of this investment in the services sector, 72% (€297bn) was into the EU. Investment in the manufacturing sector amounted to €93bn - see table 7.
The largest sector for inward investment was financial intermediation which at the end of 2014 amounted to €120bn, representing 38% of the total stock of inward investment (€312bn). Investment in the pharmaceutical sector increased by €10bn to €46bn in the same period - see Table 8.
Direct investment income
Earnings outflows of foreign owned direct investment enterprises were €40bn in 2014, down €1.4bn compared with 2013. The earnings of European owned companies were €22bn in 2014, down €1bn on the 2013 figure. Income earned abroad by investors located in Ireland was €19bn in 2014 unchanged since 2013. The source of these earnings were mainly Luxembourg (€6bn), the US (€4bn) and both Netherlands and Offshore Centres (€3bn)- see Table 9.
| Table 1 Direct Investment1 Flows Abroad Classified by Location of Investment | € million | ||||||||
| Region/Country | 2013 2 | 2014 | |||||||
| Equity | Reinvested Earnings | Other Capital | Total | Equity | Reinvested Earnings | Other Capital | Total | ||
| Europe | 19,443 | 8,657 | -257 | 27,844 | -1,605 | 9,619 | 19,023 | 27,037 | |
| of which: | |||||||||
| Belgium | * | * | * | -131 | 108 | * | * | 181 | |
| France | 131 | 58 | 53 | 240 | -35 | 88 | 68 | 122 | |
| Germany | 75 | 54 | 315 | 445 | 55 | 19 | 27 | 100 | |
| Italy | * | 35 | * | 135 | * | 26 | -64 | * | |
| Luxembourg | -859 | 3,518 | -1,441 | 1,219 | 13,698 | 3,513 | 18,229 | 35,440 | |
| Netherlands | 472 | 1,999 | -247 | 2,223 | 1,512 | 2,166 | -992 | 2,687 | |
| Spain | 178 | 16 | 426 | 620 | 63 | 9 | -44 | 31 | |
| Switzerland | * | * | -71 | * | -35 | * | * | * | |
| United Kingdom | 5,349 | 994 | 1,596 | 7,937 | -9,527 | 1,079 | 7,885 | -562 | |
| EU 283 | 13,424 | 7,668 | 90 | 21,181 | -2,154 | 8,310 | 33,425 | 39,579 | |
| EMU 194 | 304 | 5,677 | -1,532 | 4,450 | 16,303 | 6,185 | 17,773 | 40,260 | |
| Americas | -9,008 | 2,933 | 414 | -5,663 | 541 | 3,610 | 254 | 4,405 | |
| North America | * | * | * | 83 | 261 | 1,809 | -4,988 | -2,918 | |
| of which: | |||||||||
| Canada | 15 | * | * | -42 | 58 | 93 | -39 | 113 | |
| United States | * | 1,288 | * | 125 | 204 | 1,717 | -4,949 | -3,029 | |
| Central America | * | * | * | -5,740 | * | * | 5,271 | 7,342 | |
| South America | * | 17 | * | -5 | * | * | -29 | -21 | |
| Asia | 27 | 530 | -45 | 511 | 201 | * | * | 758 | |
| of which: | |||||||||
| China | 23 | * | * | 283 | 27 | * | * | 278 | |
| Hong Kong | * | 15 | * | 18 | * | * | -3 | -13 | |
| Japan | -15 | 3 | 118 | 106 | -6 | 13 | 67 | 76 | |
| Africa | * | * | * | * | * | * | * | 28 | |
| Oceania and Polar Regions | * | 221 | * | 527 | * | 71 | * | 93 | |
| Not geographically allocated5 | -345 | * | -231 | * | 130 | 121 | -58 | 193 | |
| Total | 10,059 | 11,603 | 199 | 21,863 | -656 | 13,855 | 19,313 | 32,511 | |
| of which: | |||||||||
| All offshore centres6 | * | 2,004 | * | -5,808 | 832 | 2,260 | 5,450 | 8,542 | |
| 1Data are provided according to arithmetic sign conventions e.g. minus signs are used in cases where there is withdrawal of investment. | |||||||||
| 2Revised | |||||||||
| 3For analytical purposes, additional details are given of transactions between residents of Ireland and residents of the EU28 area. | |||||||||
| 4The relevant EMU countries are: Austria, Belgium, Cyprus, Estonia, Finland, France, Germany, Greece, Italy, Latvia, Lithuania, Luxembourg, Malta, | |||||||||
| Netherlands, Portugal, Slovakia, Slovenia and Spain. | |||||||||
| 5This category covers data supplied by respondents without a geographical breakdown. | |||||||||
| 6This category overlaps with the regions referred to above and covers Andorra, Antigua and Barbuda, Anguilla, Netherlands Antilles, Barbados, | |||||||||
| Bahrain, Bermuda, Bahamas, Belize, Cook Islands, Curacao, Dominica, Grenada, Guernsey, Gibraltar, Hong Kong, Isle of Man, Jersey, Jamaica, | |||||||||
| St. Kitts and Nevis, Cayman Islands, Lebanon, Saint Lucia, Liechtenstein, Liberia, Marshall Islands, Montserrat, Maldives, Nauru, Niue, Panama, | |||||||||
| Philippines, Singapore, St Maarten, Turks and Caicos Islands, Saint Vincent and the Grenadines, British Virgin Islands, US Virgin Islands, Vanuatu, Samoa. | |||||||||
| *Data suppressed for confidentiality reasons. | |||||||||
| Table 2 Direct Investment1 Flows into Ireland Classified by Location of Investor | € million | ||||||||
| Region/Country | 2013 2 | 2014 | |||||||
| Equity | Reinvested Earnings | Other Capital | Total | Equity | Reinvested Earnings | Other Capital | Total | ||
| Europe | 7,481 | 12,575 | 1,289 | 21,345 | 13,521 | 11,624 | -12,941 | 12,205 | |
| of which: | |||||||||
| Belgium | * | * | -660 | 1,162 | * | * | 90 | 2,013 | |
| France | 1,262 | 1,435 | 973 | 3,670 | 15 | 1,390 | -5,168 | -3,762 | |
| Germany | -266 | 650 | -411 | -26 | 148 | 588 | -843 | -109 | |
| Italy | 50 | 1,341 | 444 | 1,835 | -31 | 925 | -822 | 72 | |
| Luxembourg | 1,190 | 1,573 | 5,928 | 8,693 | 8,057 | 1,780 | -6,751 | 3,085 | |
| Netherlands | -1,797 | 3,376 | -149 | 1,431 | -6,054 | 2,316 | 15,478 | 11,741 | |
| United Kingdom | 5,060 | -450 | -4,542 | 68 | 6,411 | 781 | -6,770 | 423 | |
| EU 283 | 7,170 | 9,400 | 3,435 | 20,005 | 13,696 | 9,222 | -9,295 | 13,625 | |
| EMU 194 | 1,481 | 9,840 | 7,549 | 18,871 | 7,417 | 8,274 | 994 | 16,684 | |
| North America | 6,247 | 1,793 | 830 | 8,871 | * | * | 3,095 | 5,039 | |
| of which: | |||||||||
| Canada | -16 | 15 | 88 | 86 | * | * | 84 | 265 | |
| United States | 6,263 | 1,777 | 743 | 8,784 | -1,168 | 2,932 | 3,012 | 4,775 | |
| Central America | -410 | 4,334 | 1,083 | 5,007 | 1,782 | 6,952 | 3,062 | 11,799 | |
| of which: | |||||||||
| Bermuda | -241 | 4,111 | 316 | 4,188 | 298 | 7,657 | -781 | 7,174 | |
| South America | 0 | 0 | 45 | 45 | * | * | -59 | -59 | |
| of which: | |||||||||
| Brazil | 0 | 0 | 61 | 61 | 0 | 0 | -41 | -41 | |
| Asia | * | * | 433 | -924 | 355 | 91 | -4,601 | -4,154 | |
| of which: | |||||||||
| China | * | * | -394 | -390 | 0 | 0 | 199 | 199 | |
| Japan | * | * | -1,329 | -1,257 | * | * | 1,392 | 1,707 | |
| Africa | * | * | 1 | 0 | 0 | 7 | * | * | |
| Oceania and Polar Regions | * | * | 510 | 545 | * | * | 443 | 432 | |
| Not geographically allocated5 | * | * | -926 | -1,072 | * | * | * | * | |
| Total | 11,526 | 19,026 | 3,263 | 33,816 | 15,705 | 21,511 | -13,749 | 23,465 | |
| of which: | |||||||||
| All offshore centres6 | -353 | 4,473 | 2,238 | 6,358 | 1,842 | 7,197 | -2,204 | 6,834 | |
| 1Data are provided according to arithmetic sign conventions e.g. minus signs are used in cases where there is withdrawal of investment. | |||||||||
| 2Revised | |||||||||
| 3For analytical purposes, additional details are given of transactions between residents of Ireland and residents of the EU28 area. | |||||||||
| 4The relevant EMU countries are: Austria, Belgium, Cyprus, Estonia, Finland, France, Germany, Greece, Italy, Latvia, Lithuania, Luxembourg, | |||||||||
| Malta, Netherlands, Portugal, Slovakia, Slovenia and Spain. | |||||||||
| 5This category covers data supplied by respondents without a geographical breakdown. | |||||||||
| 6This category overlaps with the regions referred to above and covers Andorra, Antigua and Barbuda, Anguilla, Netherlands Antilles, | |||||||||
| Barbados, Bahrain, Bermuda, Bahamas, Belize, Cook Islands, Curacao, Dominica, Grenada, Guernsey, Gibraltar, Hong Kong, Isle of Man, | |||||||||
| Jersey, Jamaica, St. Kitts and Nevis, Cayman Islands, Lebanon, Saint Lucia, Liechtenstein, Liberia, Marshall Islands, Montserrat, Maldives, | |||||||||
| Nauru, Niue, Panama, Philippines, Singapore, St Maarten, Turks and Caicos Islands, Saint Vincent and the Grenadines, | |||||||||
| British Virgin Islands, US Virgin Islands, Vanuatu, Samoa. | |||||||||
| *Data suppressed for confidentiality reasons. | |||||||||
| Table 3 Direct Investment1 Abroad End Year Positions Classified by Location of Investment | € million | ||||||
| Region/Country | 2013 2 | 2014 | |||||
| Equity Capital & Reinvested Earnings | Other Capital | Total | Equity Capital & Reinvested Earnings | Other Capital | Total | ||
| Europe | 223,750 | 43,657 | 267,407 | 295,186 | 66,709 | 361,895 | |
| of which: | |||||||
| France | 2,026 | 774 | 2,801 | 2,094 | 630 | 2,725 | |
| Germany | 3,234 | 346 | 3,580 | 4,642 | 336 | 4,978 | |
| Italy | 246 | -4 | 243 | 1,275 | -194 | 1,080 | |
| Luxembourg | 66,115 | 28,166 | 94,280 | 126,659 | 47,664 | 174,323 | |
| Netherlands | 33,374 | 5,400 | 38,774 | 40,619 | 4,656 | 45,275 | |
| Switzerland | 9,973 | 134 | 10,107 | * | * | -4,094 | |
| United Kingdom | 61,079 | 5,154 | 66,233 | 63,036 | 14,955 | 77,990 | |
| Offshore centres | 9,144 | 2,175 | 11,319 | 9,222 | -54 | 9,169 | |
| EU 283 | 202,899 | 41,322 | 244,220 | 270,894 | 81,100 | 351,994 | |
| EMU 194 | 119,749 | 35,548 | 155,297 | 192,723 | 56,938 | 249,660 | |
| Americas | * | * | 105,666 | 130,587 | 11,985 | 142,572 | |
| North America | * | * | 47,372 | 59,987 | 1,031 | 61,018 | |
| of which: | |||||||
| Canada | * | * | 1,668 | 2,138 | -64 | 2,073 | |
| United States | 44,069 | 1,635 | 45,704 | 57,850 | 1,096 | 58,945 | |
| Central America | * | * | 57,773 | * | * | 81,084 | |
| of which: | |||||||
| Offshore centres | 51,816 | 5,316 | 57,132 | 51,558 | 7,505 | 59,063 | |
| South America | * | * | 521 | * | * | 470 | |
| Asia | 3,546 | 76 | 3,622 | 4,085 | -63 | 4,022 | |
| Africa | 17 | 100 | 117 | 23 | 126 | 149 | |
| Oceania and Polar Regions | 5,295 | -420 | 4,876 | 5,512 | -595 | 4,918 | |
| Not geographically allocated5 | * | * | 8,963 | 9,497 | -228 | 9,269 | |
| Total | 340,246 | 50,405 | 390,651 | 444,890 | 77,934 | 522,824 | |
| of which: | |||||||
| All offshore centres6 | 61,810 | 7,319 | 69,128 | 82,303 | 10,875 | 93,178 | |
| 1The sign convention used is: for year-end positions 'Abroad', an entry without sign indicates a net asset position, while a minus sign | |||||||
| indicates a net liability position. | |||||||
| 2Revised | |||||||
| 3For analytical purposes, additional details are given of transactions between residents of Ireland and residents of the EU28 area. | |||||||
| 4The relevant EMU countries are: Austria, Belgium, Cyprus, Estonia, Finland, France, Germany, Greece, Italy, Latvia, Lithuania, Luxembourg, | |||||||
| Malta, Netherlands, Portugal, Slovakia, Slovenia and Spain. | |||||||
| 5This category covers data supplied by respondents without a geographical breakdown. | |||||||
| 6This category overlaps with the regions referred to above and covers Andorra, Antigua and Barbuda, Anguilla, Netherlands Antilles, | |||||||
| Barbados, Bahrain, Bermuda, Bahamas, Belize, Cook Islands, Curacao, Dominica, Grenada, Guernsey, Gibraltar, | |||||||
| Hong Kong, Isle of Man, Jersey, Jamaica, St. Kitts and Nevis, Cayman Islands, Lebanon, Saint Lucia, Liechtenstein, Liberia, | |||||||
| Marshall Islands, Montserrat, Maldives, Nauru, Niue, Panama, Philippines , Singapore, St Maarten, Turks and Caicos Islands, | |||||||
| Saint Vincent and the Grenadines, British Virgin Islands, US Virgin Islands, Vanuatu, Samoa. | |||||||
| *Data suppressed for confidentiality reasons. | |||||||
| Table 4 Direct Investment1 in Ireland End Year Positions Classified by Location of Investor | € million | ||||||
| Region/Country | 2013 2 | 2014 | |||||
| Equity Capital & Reinvested Earnings | Other Capital | Total | Equity Capital & Reinvested Earnings | Other Capital | Total | ||
| Europe | 191,330 | 40,363 | 231,694 | 207,918 | 32,718 | 240,635 | |
| of which: | |||||||
| Belgium | 3,398 | -719 | 2,679 | 5,412 | -547 | 4,865 | |
| France | 15,252 | 4,462 | 19,714 | 16,762 | -1,453 | 15,309 | |
| Germany | 8,221 | 1,528 | 9,749 | 8,380 | 1,426 | 9,807 | |
| Italy | 7,734 | -467 | 7,266 | 7,186 | -1,304 | 5,882 | |
| Luxembourg | 39,941 | 33,785 | 73,726 | 44,110 | 22,619 | 66,729 | |
| Netherlands | 34,340 | 5,421 | 39,761 | 29,464 | 32,097 | 61,562 | |
| Spain | 9,835 | 1,050 | 10,885 | 13,191 | -632 | 12,559 | |
| Switzerland | 14,639 | -1,639 | 13,000 | 17,853 | -5,791 | 12,063 | |
| United Kingdom | 47,327 | -6,875 | 40,452 | 56,246 | -12,991 | 43,255 | |
| Offshore centres | 4,606 | -206 | 4,400 | 4,470 | 717 | 5,187 | |
| EU 283 | 171,882 | 41,630 | 213,512 | 185,407 | 37,731 | 223,138 | |
| EMU 194 | 120,117 | 47,650 | 167,766 | 125,447 | 53,366 | 178,813 | |
| North America | 68,241 | -42,264 | 25,977 | 84,337 | -47,371 | 36,966 | |
| of which: | |||||||
| Canada | 3,458 | -300 | 3,159 | 3,728 | -134 | 3,594 | |
| United States | 64,783 | -41,965 | 22,818 | 80,609 | -47,237 | 33,372 | |
| Central America | * | * | 18,930 | * | * | 31,786 | |
| of which: | |||||||
| Offshore centres | 31,446 | -12,734 | 18,712 | 44,394 | -12,692 | 31,703 | |
| South America | * | * | -396 | * | * | -357 | |
| of which: | |||||||
| Brazil | * | * | * | * | * | * | |
| Asia | 921 | 6,619 | 7,540 | 1,634 | 5,406 | 7,040 | |
| of which: | |||||||
| China | * | * | -670 | 0 | -200 | -200 | |
| Japan | 724 | -653 | 71 | * | * | 2,349 | |
| Singapore | 15 | * | * | 18 | 2,921 | 2,939 | |
| Offshore centres5 | 41 | * | * | 108 | 3,442 | 3,550 | |
| Africa | * | * | 206 | * | * | -1,118 | |
| Oceania and Polar Regions | 63 | 734 | 797 | 38 | 1,437 | 1,474 | |
| Not geographically allocated6 | * | * | 159 | * | * | -4,921 | |
| Total | 293,770 | -8,863 | 284,907 | 339,260 | -27,752 | 311,508 | |
| of which: | |||||||
| All offshore centres7 | 36,282 | -4,154 | 32,129 | 48,979 | -8,533 | 40,446 | |
| 1The sign convention used is: for year-end positions 'In Ireland' an entry without sign indicates a net liability position, while a minus sign | |||||||
| indicates a net asset position. | |||||||
| 2Revised | |||||||
| 3For analytical purposes, additional details are given of transactions between residents of Ireland and residents of the EU28 area. | |||||||
| 4The relevant EMU countries are: Austria, Belgium, Cyprus, Estonia, Finland, France, Germany, Greece, Italy, Latvia, Lithuania, Luxembourg, | |||||||
| Malta, Netherlands, Portugal, Slovakia, Slovenia and Spain. | |||||||
| 5This category overlaps with some of the regions referred to above. | |||||||
| 6This category covers data supplied by respondents without a geographical breakdown | |||||||
| 7This category overlaps with the regions referred to above and covers Andorra, Antigua and Barbuda, Anguilla, Netherlands Antilles, | |||||||
| Barbados, Bahrain, Bermuda, Bahamas, Belize, Cook Islands, Curacao, Dominica, Grenada, Guernsey, Gibraltar, Hong Kong, Isle of Man, | |||||||
| Jersey, Jamaica, St. Kitts and Nevis, Cayman Islands, Lebanon, Saint Lucia, Liechtenstein, Liberia, Marshall Islands, Montserrat, Panama, | |||||||
| Philippines, Singapore, St Maarten, Turks and Caicos Islands, Saint Vincent and the Grenadines, Maldives, Nauru, Niue, British Virgin Islands, | |||||||
| US Virgin Islands, Vanuatu, Samoa. | |||||||
| *Data suppressed for confidentiality reasons. | |||||||
| Table 5 Direct Investment1 Flows Abroad Classified by Activity2 of Resident Investor, 2013 and 2014 | € million | |||||||
| Sector | NACE 2 | 2013 3 | 2014 | |||||
| Total | of which: | Total | of which: | |||||
| Section & Division | EU 284 | EMU 185 | EU 284 | EMU 185 | ||||
| All Industries | 21,863 | 21,181 | 4,450 | 32,511 | 39,579 | 40,260 | ||
| of which: | ||||||||
| Agriculture, Forestry and Fishing; Mining and Quarrying; Construction | A, B & F | * | * | * | * | * | * | |
| Total Manufacturing Sector | C | 8,865 | 5,475 | 596 | 4,138 | 3,599 | 5,959 | |
| Food, beverages and tobacco products | 10, 11 & 12 | 5,016 | * | * | -1,451 | -2,165 | * | |
| Textiles and wood | 13, 14 & 16 - 18 | * | * | * | * | 357 | * | |
| Basic pharmaceutical products and preparations | 21 | -1,817 | 337 | 330 | 4,371 | * | * | |
| Other manufacturing n.e.s. | * | 383 | 274 | * | * | 1,811 | ||
| Electricity, Gas, Steam and Air Conditioning supply | D | * | * | * | * | * | * | |
| Total Services Sector | 45 - 99 | 13,075 | 13,674 | 1,860 | 26,686 | 35,613 | 33,717 | |
| Wholesale and retail trade; Repairs of motor vehicles | G | 825 | 236 | 154 | 581 | 527 | 267 | |
| Transportation and storage | H | * | * | * | * | * | * | |
| Information and communication | I | 2,806 | * | * | 2,033 | 412 | * | |
| Financial and insurance activities | K | 3,315 | 3,250 | 1,120 | -7,160 | -11,809 | -3,276 | |
| of which: | ||||||||
| Activities of holding companies | 64.2 | 618 | 633 | 373 | 1,829 | 424 | * | |
| Other service activities 6 | * | * | 235 | * | * | 36,447 | ||
| 1Data are provided according to arithmetic sign conventions e.g. minus signs are used in cases where there is withdrawal of investment. | ||||||||
| 2The activity classification used in this release is the NACE Rev. 2 classification. | ||||||||
| 3Revised | ||||||||
| 4For analytical purposes, additional details are given of transactions between residents of Ireland and residents of the EU28 area. | ||||||||
| 5The relevant EMU countries are: Austria, Belgium, Cyprus, Estonia, Finland, France, Germany, Greece, Italy, Latvia, Luxembourg, Malta, Netherlands, Portugal, Slovakia, | ||||||||
| Slovenia and Spain. | ||||||||
| 6This covers residual FDI service activity. | ||||||||
| *Data suppressed for confidentiality reasons. | ||||||||
| Table 6 Direct Investment1 Flows into Ireland Classified by Activity2 of Resident Enterprise, 2013 and 2014 | € million | |||||||||||||
| Sector | NACE 2 | 2013 3 | 2014 | |||||||||||
| Total | of which: | Total | of which: | |||||||||||
| Section & Division | United States | Japan | EU 284 | EMU 185 | Offshore Centres | United States | Japan | EU 284 | EMU 185 | Offshore Centres | ||||
| All Industries | 33,816 | 8,784 | -1,257 | 20,005 | 18,871 | 6,358 | 23,465 | 4,775 | 1,707 | 13,625 | 16,684 | 6,834 | ||
| Agriculture, Forestry and Fishing; Mining and Quarrying; Construction | A, B & F | * | * | 0 | * | * | 0 | * | * | 0 | * | * | 0 | |
| Total Manufacturing Sector | C | 13,201 | 4,916 | 47 | 7,196 | 7,886 | 861 | 1,082 | -898 | * | 922 | -2,899 | 4,813 | |
| Food, beverages and tobacco products | 10, 11 & 12 | 4,848 | * | * | 4,998 | 5,208 | * | -2,814 | * | 0 | -3,411 | -3,315 | * | |
| Textiles and wood | 13, 14 & 16 - 18 | * | 0 | 0 | * | * | 0 | * | 0 | 0 | * | * | 0 | |
| Basic pharmaceutical products and preparations | 21 | -1,872 | -1,144 | -30 | -1,053 | -428 | 180 | 4,022 | -1,491 | * | 1,975 | 2,226 | 3,847 | |
| Other manufacturing n.e.s. | * | * | * | * | * | * | * | * | 901 | * | * | * | ||
| Electricity, Gas, Steam and Air Conditioning supply | D | * | * | 0 | * | * | 0 | * | * | * | * | * | 0 | |
| Total Services Sector | 45 - 99 | 20,431 | 3,862 | -1,303 | 12,641 | 10,998 | 5,497 | 22,895 | 5,665 | 619 | 13,227 | 19,574 | 2,022 | |
| Wholesale and retail trade; Repairs of motor vehicles | G | -778 | -802 | -253 | 745 | 1,639 | 35 | 2,327 | 2,390 | * | -454 | -1,805 | 385 | |
| Transportation and storage | H | * | 0 | 0 | * | * | 0 | * | 0 | 0 | * | * | 0 | |
| Information and communication | I | 1,895 | * | 2 | 3,891 | 3,499 | 2,618 | 4,423 | 510 | * | -303 | -522 | 4,382 | |
| Financial intermediation | 64 | 17,242 | 9,217 | * | 5,935 | 4,636 | 3,223 | 370 | 2,239 | 559 | -278 | 7,294 | -3,114 | |
| of which: | ||||||||||||||
| Activities of holding companies | 64.2 | -278 | -134 | * | * | 45 | 666 | 569 | * | * | * | * | 371 | |
| Insurance, reinsurance and pension funding | 65 | 1,672 | 887 | -103 | 590 | 358 | -27 | 568 | 432 | 31 | -19 | 670 | 497 | |
| Other financial activities | 66 | 617 | * | 0 | 626 | * | * | * | * | * | * | * | * | |
| Other services activities | * | -526 | * | * | 284 | * | 11,035 | * | 72 | 10,160 | 9,775 | * | ||
| 1Data are provided according to arithmetic sign conventions. e.g. minus signs are used in cases where there is withdrawal of investment. | ||||||||||||||
| 2The activity classification used in this release is the NACE Rev. 2 classification. | ||||||||||||||
| 3Revised | ||||||||||||||
| 4For analytical purposes, additional details are given of transactions between residents of Ireland and residents of the EU28 area. | ||||||||||||||
| 5The relevant EMU countries are: Austria, Belgium, Cyprus, Estonia, Finland, France, Germany, Greece, Italy, Latvia, Luxembourg, Malta, Netherlands, Portugal, Slovakia, Slovenia and Spain. | ||||||||||||||
| *Data suppressed for confidentiality reasons. | ||||||||||||||
| Table 7 Direct Investment1 Abroad End Year Positions Classified by Activity2 of Resident Investor, 2013 and 2014 | € million | |||||||
| Sector | NACE 2 | 2013 3 | 2014 | |||||
| Total | of which: | Total | of which: | |||||
| Section & Division | EU 284 | EMU 185 | EU 284 | EMU 185 | ||||
| All Industries | 390,651 | 244,220 | 155,297 | 522,824 | 351,994 | 249,660 | ||
| of which: | ||||||||
| Agriculture, Forestry and Fishing; Mining and Quarrying; Construction | A, B & F | * | * | * | * | * | * | |
| Total Manufacturing Sector | C | 67,029 | 23,412 | 14,295 | 92,599 | 46,562 | 40,203 | |
| Food, beverages and tobacco products | 15,392 | 11,406 | * | 15,333 | 10,556 | * | ||
| Textiles and wood | 10, 11 & 12 | * | * | * | * | * | * | |
| Basic pharmaceutical products and preparations | 13, 14 & 16 - 18 | 24,109 | * | * | 40,764 | * | * | |
| Other manufacturing n.e.s. | 21 | * | * | 1,422 | * | 20,793 | 18,426 | |
| Electricity, Gas, Steam and Air Conditioning supply | D | * | * | * | * | * | * | |
| Total Services Sector | 45 - 99 | 308,765 | 213,224 | 135,895 | 412,365 | 297,430 | 203,184 | |
| Wholesale and retail trade; Repairs of motor vehicles | G | 13,858 | 6,889 | 1,034 | 18,560 | 9,785 | 3,026 | |
| Transportation and storage | H | * | 128 | * | * | * | * | |
| Information and communication | I | 1,380 | 565 | 670 | 630 | -1,430 | * | |
| Financial and insurance activities | K | 56,526 | 44,875 | 22,749 | 65,170 | 37,248 | 22,133 | |
| of which: | ||||||||
| Activities of holding companies | 64.2 | 19,395 | 9,857 | 9,138 | 35,165 | 13,982 | 13,323 | |
| Other service activities 6 | * | 160,767 | * | * | * | 179,641 | ||
| 1The sign convention used is: for year-end positions 'Abroad', an entry without sign indicates a net asset position, while a minus sign indicates a net liability position. | ||||||||
| 2The activity classification used in this release is the NACE Rev. 2 classification. | ||||||||
| 3Revised | ||||||||
| 4For analytical purposes, additional details are given of transactions between residents of Ireland and residents of the EU28 area. | ||||||||
| 5The relevant EMU countries are: Austria, Belgium, Cyprus, Estonia, Finland, France, Germany, Greece, Italy, Latvia, Luxembourg, Malta, Netherlands, Portugal, Slovakia, | ||||||||
| Slovenia and Spain. | ||||||||
| 6This covers residual FDI service activity. | ||||||||
| *Data suppressed for confidentiality reasons. | ||||||||
| Table 8 Direct Investment1 in Ireland End year Positions Classified by Activity2 of Resident Enterprise, 2013 and 2014 | € million | |||||||||||||
| Sector | NACE 2 | 2013 3 | 2014 | |||||||||||
| Total | of which: | Total | of which: | |||||||||||
| Section & Division | United States | Japan | EU 284 | EMU 185 | Offshore Centres | United States | Japan | EU 284 | EMU 185 | Offshore Centres | ||||
| All Industries | 284,907 | 22,818 | 71 | 213,512 | 167,766 | 32,129 | 311,508 | 33,372 | 2,349 | 223,138 | 178,813 | 40,446 | ||
| Agriculture, Forestry and Fishing | A | * | * | 0 | * | * | 0 | * | * | 0 | * | * | 0 | |
| Mining and Quarrying; Construction | B | * | * | 0 | * | * | 0 | * | * | 0 | * | * | 0 | |
| Total Manufacturing | C | 80,919 | 11,905 | -159 | 61,600 | 60,100 | 4,150 | 78,314 | 11,177 | * | 57,146 | 50,989 | 9,992 | |
| Food, beverages and tobacco products | 10, 11 & 12 | 9,576 | -5 | 0 | 6,928 | 7,979 | 4,083 | 6,026 | 139 | 0 | 3,361 | 4,249 | 5,802 | |
| Textiles and wood | 13, 14 & 16 - 18 | * | 0 | 0 | * | * | 0 | * | 0 | 0 | * | * | 0 | |
| Basic pharmaceutical products and preparations | 21 | 36,099 | 876 | * | 32,028 | 31,406 | 1,497 | 45,905 | 81 | 60 | 37,723 | 36,743 | 6,813 | |
| Metal and mechanical products | 24, 25, 26 & 28 | 7,517 | 366 | * | 9,546 | 10,146 | -2,521 | 7,208 | 448 | * | 10,602 | * | -3,709 | |
| Other manufacturing | * | 10,668 | -33 | * | * | 1,091 | * | 10,509 | -9 | * | 2,367 | 1,086 | ||
| Electricity, Gas, Steam and Air Conditioning supply | D | * | 0 | 0 | * | 0 | 0 | 1,086 | 0 | * | * | * | 0 | |
| Total Services Sector | 45 - 99 | 202,643 | 10,912 | 230 | 150,569 | 107,592 | 27,979 | 231,853 | 22,194 | 1,377 | 164,597 | 127,536 | 30,454 | |
| Wholesale and retail trade; Repairs of motor vehicles | G | 10,122 | * | -321 | 9,075 | 9,242 | 2,197 | 16,696 | * | * | 8,355 | 7,400 | 1,834 | |
| Information and communication | I | 12,509 | 937 | * | 7,457 | 7,197 | 4,331 | 15,298 | 4,656 | -5 | 4,940 | 4,495 | 6,231 | |
| Financial intermediation | 64 | 109,578 | -1,599 | * | 88,273 | 60,954 | 17,531 | 119,561 | -370 | 317 | 95,247 | 77,820 | 17,550 | |
| of which: | ||||||||||||||
| Activities of holding companies | 64.2 | 10,634 | * | * | 4,364 | 3,237 | 4,114 | 22,317 | * | * | 5,910 | 5,317 | 6,231 | |
| Insurance services | 65 | 20,874 | 4,364 | 36 | 13,512 | 10,656 | 1,823 | 21,405 | 5,385 | * | 12,718 | 11,182 | 2,389 | |
| Administrative and support activities | N | 31,986 | * | 858 | * | 9,805 | 1,642 | 30,864 | * | * | 19,777 | 4,045 | 1,896 | |
| Other services activities | 17,574 | 2,408 | 1 | * | 9,738 | 455 | 28,029 | 283 | -48 | 23,560 | 22,594 | 554 | ||
| 1The sign convention used is: for year-end positions 'In Ireland' an entry without sign indicates a net liability position, while a minus sign indicates a net asset position. | ||||||||||||||
| 2The activity classification used in this release is the NACE Rev. 2 classification. | ||||||||||||||
| 3Revised | ||||||||||||||
| 4For analytical purposes, additional details are given of transactions between residents of Ireland and residents of the EU28 area. | ||||||||||||||
| 5The relevant EMU countries are: Austria, Belgium, Cyprus, Estonia, Finland, France, Germany, Greece, Italy, Latvia, Luxembourg, Malta, Netherlands, Portugal, Slovakia, Slovenia and Spain. | ||||||||||||||
| *Data suppressed for confidentiality reasons. | ||||||||||||||
| Table 9 Direct Investment Income1 Flows Classified by Geographic Location of Creditor/Debtor | € million | ||||||
| Region/Country | 2013 2 | 2014 | |||||
| Inflows | Outflows | Net | Inflows | Outflows | Net | ||
| Europe | 11,113 | 23,169 | -12,056 | 12,495 | 22,479 | -9,984 | |
| of which: | |||||||
| Belgium | -10 | 926 | -936 | * | 909 | * | |
| France | 147 | 1,714 | -1,567 | 141 | 1,896 | -1,755 | |
| Germany | 80 | 766 | -686 | 45 | 788 | -743 | |
| Italy | 35 | 1,573 | -1,538 | 24 | 1,463 | -1,439 | |
| Luxembourg | 5,330 | 3,615 | 1,715 | 5,971 | 3,310 | 2,661 | |
| Netherlands | 2,073 | 7,337 | -5,264 | 2,549 | 7,146 | -4,597 | |
| Spain | 20 | 745 | -725 | 30 | 575 | -545 | |
| Switzerland | * | 4,438 | * | * | 3,927 | * | |
| United Kingdom | 1,156 | 1,344 | -188 | 1,167 | 1,911 | -744 | |
| EU 283 | 9,931 | 18,520 | -8,589 | 11,234 | 18,168 | -6,934 | |
| EMU 194 | 7,695 | 16,837 | -9,142 | 9,135 | 16,026 | -6,891 | |
| Americas | 6,413 | 17,673 | -11,260 | 6,288 | 17,194 | -10,906 | |
| of which: | |||||||
| Canada | 18 | 45 | -27 | 96 | -13 | 109 | |
| United States | 3,110 | 4,537 | -1,427 | 3,508 | 4,925 | -1,417 | |
| Offshore centres | 3,165 | 13,418 | -10,253 | 2,566 | 12,284 | -9,718 | |
| Asia | 725 | 361 | 364 | 534 | 200 | 334 | |
| of which: | |||||||
| Japan | * | 161 | * | 88 | 29 | 59 | |
| Africa | * | 6 | * | * | * | -8 | |
| Oceania and Polar Regions | 210 | * | * | 72 | -2 | 74 | |
| Not geographically allocated5 | * | * | -118 | * | * | -379 | |
| Total | 18,786 | 41,714 | -22,928 | 19,459 | 40,326 | -20,867 | |
| of which: | |||||||
| Offshore centres6 | 3,636 | 13,343 | -9,707 | 3,149 | 12,750 | -9,601 | |
| 1Income on equity and other direct investment capital | |||||||
| 2Revised | |||||||
| 3For analytical purposes, additional details are given of transactions between residents of Ireland and residents of the EU28 area. | |||||||
| 4The relevant EMU countries are: Austria, Belgium, Cyprus, Estonia, Finland, France, Germany, Greece, Italy, Latvia, Lithuania, | |||||||
| Luxembourg, Malta, Netherlands, Portugal, Slovakia, Slovenia and Spain. | |||||||
| 5This category covers data supplied by respondents without a geographical breakdown. | |||||||
| 6This category overlaps with the regions referred to above and covers Andorra, Antigua and Barbuda, | |||||||
| Anguilla, Netherlands Antilles, Barbados, Bahrain, Bermuda, Bahamas, Belize, Cook Islands, Curacao, Dominica, | |||||||
| Grenada, Guernsey, Gibraltar, Hong Kong, Isle of Man, Jersey, Jamaica, St. Kitts and Nevis, Cayman Islands, | |||||||
| Lebanon, Saint Lucia, Liechtenstein, Liberia, Marshall Islands, Montserrat, Maldives, Nauru, Niue, Panama, | |||||||
| Philippines , Singapore, St Maarten, Turks and Caicos Islands, Saint Vincent and the Grenadines, British Virgin Islands, | |||||||
| US Virgin Islands, Vanuatu, Samoa. | |||||||
| *Data suppressed for confidentiality reasons. | |||||||
The Foreign Direct Investment release updates the annual statistical series on Foreign Direct Investment (FDI) flows and end-year stocks (or positions) for Ireland broken down geographically by region and by country. The release includes tables with further analyses of the FDI flows and stocks presented by the principal economic activity (using NACE Rev.2 classification) of the resident direct investment enterprise. The statistics are methodologically consistent with the data already presented in the quarterly balance of payments and IIP releases. The statistics are also compatible with those supplied to Eurostat and the European Central Bank (ECB) and to other international organisations such as the International Monetary Fund (IMF) and the Organisation for Economic Co-operation and Development (OECD).
For more detailed methodological information see
Methodology DocumentsForeign Direct Investment - Background Notes (PDF 215KB)
Redomiciled PLCs in the Irish Balance of Payments (PDF 183KB)
 Hide Background Notes
Scan the QR code below to view this release online or go to
http://www.cso.ie/en/releasesandpublications/er/fdi/foreigndirectinvestmentannual2014/
 Show Table 1 - Direct Investment Flows Abroad Classified by Location of Investment
 Hide Table 1 - Direct Investment Flows Abroad Classified by Location of Investment