
| Quarter 1 2015 | Quarter 1 2014 | |
| Births | 17,183 | 17,699 |
| Deaths | 8,604 | 8,110 |
| Marriages | 3,665 | 3,620 |
| Natural increase | 8,579 | 9,589 |
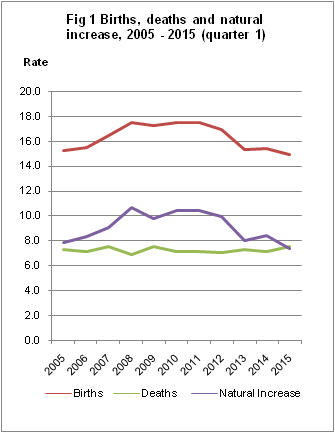
There were 17,183 births in quarter 1 2015, 516 fewer births compared with the same period in 2014. This corresponds to a birth rate of 14.9 per 1,000 population, a decrease of 0.5 from quarter 1 2014.
There were 8,604 deaths in quarter 1 2015, an increase of 6.1% (or 494 deaths) from quarter 1 2014. This equates to a death rate of 7.5 per 1,000 population, an increase of 0.4 from the same period in 2014.
There were 55 infant deaths registered giving an infant mortality rate of 3.2 per 1,000 live births.
The number of births less the number of deaths in quarter 1 2015 resulted in a natural increase of population of 8,579 persons.
Births
There were 8,754 male births and 8,429 female births in quarter 1 2015. The 17,183 births represent an annual birth rate of 14.9 per thousand population. This rate is 0.5 points lower than the corresponding quarter of 2014. See tables 4 and 5.
Age of mothers
The average age of first time mothers was 30.6, up 0.1 years from the same period in the previous year. The average age of mothers at maternity for births registered in quarter 1 2015 was 32.5 years, 0.2 higher than quarter 1 2014. The average age of first time mothers outside marriage/civil partnership was 27.9 while the average age of all mothers outside marriage/civil partnership was 29.6 years. In the same quarter in 2014, the average age of mothers having their first baby outside marriage/civil partnership was also 27.9 years while it was 29.4 years for all mothers for births registered outside of marriage/civil partnership. See tables 9 and 10.
Births and marriage/civil partnerships
In quarter 1 2015 there were 10,981 (63.9%) births registered as within marriage and of these 4 were within civil partnerships.
There were 6,202 births registered as outside marriage/civil partnership accounting for 36.1% of all births in quarter 1 2015. The highest percentage of births outside marriage/civil partnership was in Limerick City at 56.7% and the lowest was in Dun Laoghaire Rathdown with 22.9%. In the same quarter in 2014, there were 6,439 births registered as outside marriage/civil partnership accounting for 36.4% of all births. See table 8.
Location of births
The highest number of births registered was in Dublin City with 1,982 (11.5% of total live births in the country) followed by Cork County with 1,622 (9.4%) registered births. Leitrim had the lowest number with 113 (0.7%) registered births in quarter 1, 2015. The same pattern was reflected in quarter 1, 2014 when Dublin City accounted for 2,063 or 11.7% of births followed by Cork County with 1,503 (8.5%). Leitrim had the lowest number, 108 births (0.6%), registered in quarter 1, 2014. See table 8.
Nationality of mothers
Of the 17,183 births in quarter 1, 2015, there were 13,468 babies (78.4%) born to mothers of Irish nationality compared to 13,851 (78.3%) in quarter 1, 2014. See table 11.
Birth order
A total of 6,456 births (37.6%) were to first time mothers in quarter 1 2015. Second time mothers had 6,058 births (35.3%). This accounted for a total of 72.9% of births. See table 6 and fig 2.
| For long labels below use to display on multiple lines | Birth order Q1 2015 (%) |
|---|---|
| 1st | 37.6 |
| 2nd | 35.3 |
| 3rd | 17.8 |
| 4th | 6.3 |
| 5th and over | 3 |
Deaths
There were 8,604 deaths registered in quarter 1 2015, of these 4,245 were male while 4,359 were female. The quarter 1 2015 total is 6.1% higher than in the corresponding quarter of 2014 when 8,110 deaths were registered. See table 12.
Infant and neonatal mortality
There were 55 infant deaths registered in quarter 1 2015 giving an infant mortality rate of 3.2 deaths per 1,000 live births, a decrease of 0.5 deaths per 1,000 births in the same period in 2014. Neonatal deaths are deaths of infants at ages under 4 weeks. There were 31 neonatal deaths registered in quarter 1 2015, giving a neonatal mortality rate of 1.8 deaths per 1,000 live births, which was a decrease of 1.4 from quarter 1 2014. See tables 3, 4 and fig 3.
.
| Under 1 yr rates | infant | neonatal |
|---|---|---|
| Q4 2013 | 3.4 | 2.7 |
| Q1 2014 | 3.7 | 3.2 |
| Q2 2014 | 3.3 | 2.5 |
| Q3 2014 | 4.3 | 2.7 |
| Q4 2014 | 3.4 | 2.6 |
| Q1 2015 | 3.2 | 1.8 |
Cause of death
Diseases of the Heart and Arteries:
Diseases of the circulatory system accounted for 2,757 deaths, or an annual rate of 2.4 per 1,000 population. Of these, 1,349 were due to ischaemic heart disease and 561 to cerebrovascular disease. See tables 2, 13, 14 and fig. 4.
Malignant Cancers:
There were 2,379 deaths from malignant neoplasms. This is equivalent to an annual rate of 2.1 per 1,000 population.
Lung Diseases:
Deaths from pneumonia numbered 379; chronic lower respiratory disease accounted for 544 deaths and 307 deaths resulted from other respiratory diseases.
Accidents, suicides and other:
There were 264 deaths due to accidents, suicides and other external causes. Accidents accounted for 65.5% (173) of these deaths while suicides accounted for 29.2% (77). Of these 264 deaths, almost three quarters (70.5%) were male.
| For long labels below use to display on multiple lines | Principle causes of death Q1 2015 (%) |
|---|---|
| malignant neoplasms | 27.649930264993 |
| circulatory diseases | 32.0432357043236 |
| External causes | 3.06834030683403 |
| respiratory diseases | 14.5513714551371 |
| remainder | 22.6871222687122 |
Age at death
The leading cause of death in quarter 1 2015 varied widely by age group. Among young adults aged 15 to 34, external causes of death including accidents, suicide and other ranked first (78 deaths). Among individuals aged 35-74, cancers were the leading cause, while for those aged 75 and older, it was diseases of the heart and arteries.
There were 7,175 deaths of persons aged 65 and over registered in quarter 1 2015. This represents an annual death rate of 48.9 per 1,000 population aged 65 and over and represents a decrease of 2.1 when compared with the corresponding quarter of 2014. See tables 3, 4 and fig 5.
The average (mean) time-lag between the date of death and the registration of death was 40 days while the median (mid-point in data) was 19 days for quarter 1 2015.
| Cancer | Heart | Lung | Accident, suicide, homicide and undetermined | Other | |
| Under 15 | 10.6666666666667 | 0 | 0 | 6.66666666666667 | 82.6666666666667 |
| 15-34 | 12.8 | 7.2 | 0 | 62.4 | 17.6 |
| 35-74 | 45.6200227531286 | 25.7868790291998 | 9.36670458854759 | 4.28517254455821 | 14.9412210845658 |
| 75 and over | 21.2242066932547 | 35.8591988902376 | 17.4267383388243 | 1.17912259406971 | 24.3107334836137 |
Natural Increase
The natural increase in the population (births minus deaths) for quarter 1 2015 was 8,579. This represents a rate of 7.4 per 1,000 population, 1.0 per thousand less than quarter 1 2014. See tables 3, 4 and fig. 1.
Marriages/Civil Partnerships
The number of marriages registered during the quarter was 3,665 (provisional) equivalent to an annual marriage rate of 3.2 per 1,000 population, the same rate as the corresponding quarter of 2014. See tables 3 and 4.
Civil Partnership legislation was introduced in Ireland on the 1st January, 2011. The number of civil partnerships registered in the first quarter of 2015 was 81 which was 13 more than in quarter 1 2014. The annual rate per 1,000 population was 0.07 which was 0.01 more than the corresponding quarter of 2014.
Population
The estimated population (usual residence) in April 2014 was 4,609,600.
| Table 1 Births classified by age of mother at maternity by quarter, 2010, 2014 and 2015 and their corresponding annual age specific (asfr) and total period fertility rates (tpfr) | ||||||||||||
| Q1 2010 | Q1 2014 | Q4 2014 | Q1 2015 | |||||||||
| % of | Fertility | % of | Fertility | % of | Fertility | % of | Fertility | |||||
| Age of mother | Number | total | rate | Number | total | rate | Number | total | rate | Number | total | rate |
| < 20 years | 574 | 2.9 | 16.8 | 339 | 1.9 | 10.2 | 297 | 1.8 | 8.8 | 299 | 1.7 | 8.9 |
| 20-24 years | 2,252 | 11.4 | 57.7 | 1,592 | 9.0 | 50.2 | 1,417 | 8.8 | 47.4 | 1,498 | 8.7 | 50.1 |
| 25-29 years | 4,748 | 24.0 | 91.0 | 3,482 | 19.7 | 84.0 | 3,143 | 19.6 | 79.2 | 3,205 | 18.7 | 80.7 |
| 30-34 years | 6,729 | 34.0 | 145.2 | 6,554 | 37.0 | 130.8 | 5,927 | 36.9 | 120.4 | 6,217 | 36.2 | 126.3 |
| 35-39 years | 4,516 | 22.8 | 104.8 | 4,644 | 26.2 | 101.3 | 4,328 | 26.9 | 93.1 | 4,796 | 27.9 | 103.1 |
| 40-44 years | 914 | 4.6 | 23.6 | 1,020 | 5.8 | 23.8 | 896 | 5.6 | 20.6 | 1,109 | 6.5 | 25.4 |
| 45+ years | 45 | 0.2 | 1.2 | 68 | 0.4 | 1.7 | 55 | 0.3 | 1.4 | 58 | 0.3 | 1.5 |
| Not stated | 9 | 0.0 | – | – | 0.0 | – | 1 | 0.0 | – | 1 | 0.0 | – |
| Total | 19,787 | 100.0 | 2.2 | 17,699 | 100.0 | 2.0 | 16,064 | 100.0 | 1.9 | 17,183 | 100.0 | 2.0 |
| Table 2a Deaths registered by cause of death and by quarter, 2010, 2014 and 2015 | ||||||||||||
| Malignant Cancers | % of total | Diseases of the heart and arteries | % of total | Lung diseases | % of total | Accidents, Suicides & Others | % of total | Other Causes | % of total | Total | % of total | |
| Q1 2015 | 2,379 | 27.6 | 2,757 | 32.0 | 1,252 | 14.6 | 264 | 3.1 | 1,952 | 22.7 | 8,604 | 100.0 |
| Q4 2014 | 2,114 | 31.1 | 2,015 | 29.7 | 742 | 10.9 | 462 | 6.8 | 1,454 | 21.4 | 6,787 | 100.0 |
| Q1 2014 | 2,313 | 28.5 | 2,594 | 32.0 | 1,102 | 13.6 | 299 | 3.7 | 1,802 | 22.2 | 8,110 | 100.0 |
| Q1 2010 | 2,055 | 27.2 | 2,654 | 35.1 | 1,017 | 13.4 | 357 | 4.7 | 1,480 | 19.6 | 7,563 | 100.0 |
| Table 2b Deaths registered by cause of death, by age and region, First Quarter 2015 | ||||||||||||
| Malignant Cancers | % of total | Diseases of the heart and arteries | % of total | Lung diseases | % of total | Accidents, Suicides & Others | % of total | Other Causes | % of total | Total | % of total | |
| Persons | ||||||||||||
| Under 1 | 1 | 0.0 | 0 | 0.0 | 0 | 0.0 | 1 | 0.4 | 53 | 2.7 | 55 | 0.6 |
| 1 - 4 | 3 | 0.1 | 0 | 0.0 | 0 | 0.0 | 2 | 0.8 | 7 | 0.4 | 12 | 0.1 |
| 5 - 14 | 4 | 0.2 | 0 | 0.0 | 0 | 0.0 | 2 | 0.8 | 2 | 0.1 | 8 | 0.1 |
| 15 - 24 | 4 | 0.2 | 4 | 0.1 | 0 | 0.0 | 30 | 11.4 | 7 | 0.4 | 45 | 0.5 |
| 25 - 34 | 12 | 0.5 | 5 | 0.2 | 0 | 0.0 | 48 | 18.2 | 15 | 0.8 | 80 | 0.9 |
| 35 - 44 | 52 | 2.2 | 22 | 0.8 | 1 | 0.1 | 29 | 11.0 | 35 | 1.8 | 139 | 1.6 |
| 45 - 54 | 146 | 6.1 | 88 | 3.2 | 10 | 0.8 | 25 | 9.5 | 58 | 3.0 | 327 | 3.8 |
| 55 - 64 | 369 | 15.5 | 206 | 7.5 | 59 | 4.7 | 29 | 11.0 | 100 | 5.1 | 763 | 8.9 |
| 65 - 74 | 615 | 25.9 | 364 | 13.2 | 177 | 14.1 | 30 | 11.4 | 222 | 11.4 | 1,408 | 16.4 |
| 75 - 84 | 752 | 31.6 | 778 | 28.2 | 397 | 31.7 | 27 | 10.2 | 607 | 31.1 | 2,561 | 29.8 |
| 85 + | 421 | 17.7 | 1,290 | 46.8 | 608 | 48.6 | 41 | 15.5 | 846 | 43.3 | 3,206 | 37.3 |
| Total | 2,379 | 100.0 | 2,757 | 100.0 | 1,252 | 100.0 | 264 | 100.0 | 1,952 | 100.0 | 8,604 | 100.0 |
| Males | ||||||||||||
| Under 1 | 1 | 0.0 | 0 | 0.0 | 0 | 0.0 | 1 | 0.4 | 31 | 1.6 | 33 | 0.4 |
| 1 - 4 | 2 | 0.1 | 0 | 0.0 | 0 | 0.0 | 2 | 0.8 | 4 | 0.2 | 8 | 0.1 |
| 5 - 14 | 2 | 0.1 | 0 | 0.0 | 0 | 0.0 | 0 | 0.0 | 0 | 0.0 | 2 | 0.0 |
| 15 - 24 | 2 | 0.1 | 3 | 0.1 | 0 | 0.0 | 27 | 10.2 | 5 | 0.3 | 37 | 0.4 |
| 25 - 34 | 5 | 0.2 | 3 | 0.1 | 0 | 0.0 | 38 | 14.4 | 9 | 0.5 | 55 | 0.6 |
| 35 - 44 | 32 | 1.3 | 16 | 0.6 | 1 | 0.1 | 24 | 9.1 | 23 | 1.2 | 96 | 1.1 |
| 45 - 54 | 61 | 2.6 | 71 | 2.6 | 8 | 0.6 | 16 | 6.1 | 39 | 2.0 | 195 | 2.3 |
| 55 - 64 | 190 | 8.0 | 150 | 5.4 | 34 | 2.7 | 19 | 7.2 | 59 | 3.0 | 452 | 5.3 |
| 65 - 74 | 352 | 14.8 | 238 | 8.6 | 102 | 8.1 | 24 | 9.1 | 131 | 6.7 | 847 | 9.8 |
| 75 - 84 | 414 | 17.4 | 439 | 15.9 | 186 | 14.9 | 18 | 6.8 | 295 | 15.1 | 1,352 | 15.7 |
| 85 + | 200 | 8.4 | 428 | 15.5 | 248 | 19.8 | 17 | 6.4 | 275 | 14.1 | 1,168 | 13.6 |
| Total | 1,261 | 53.0 | 1,348 | 48.9 | 579 | 46.2 | 186 | 70.5 | 871 | 44.6 | 4,245 | 49.3 |
| Females | ||||||||||||
| Under 1 | 0 | 0.0 | 0 | 0.0 | 0 | 0.0 | 0 | 0.0 | 22 | 1.1 | 22 | 0.3 |
| 1 - 4 | 1 | 0.0 | 0 | 0.0 | 0 | 0.0 | 0 | 0.0 | 3 | 0.2 | 4 | 0.0 |
| 5 - 14 | 2 | 0.1 | 0 | 0.0 | 0 | 0.0 | 2 | 0.8 | 2 | 0.1 | 6 | 0.1 |
| 15 - 24 | 2 | 0.1 | 1 | 0.0 | 0 | 0.0 | 3 | 1.1 | 2 | 0.1 | 8 | 0.1 |
| 25 - 34 | 7 | 0.3 | 2 | 0.1 | 0 | 0.0 | 10 | 3.8 | 6 | 0.3 | 25 | 0.3 |
| 35 - 44 | 20 | 0.8 | 6 | 0.2 | 0 | 0.0 | 5 | 1.9 | 12 | 0.6 | 43 | 0.5 |
| 45 - 54 | 85 | 3.6 | 17 | 0.6 | 2 | 0.2 | 9 | 3.4 | 19 | 1.0 | 132 | 1.5 |
| 55 - 64 | 179 | 7.5 | 56 | 2.0 | 25 | 2.0 | 10 | 3.8 | 41 | 2.1 | 311 | 3.6 |
| 65 - 74 | 263 | 11.1 | 126 | 4.6 | 75 | 6.0 | 6 | 2.3 | 91 | 4.7 | 561 | 6.5 |
| 75 - 84 | 338 | 14.2 | 339 | 12.3 | 211 | 16.9 | 9 | 3.4 | 312 | 16.0 | 1,209 | 14.1 |
| 85 + | 221 | 9.3 | 862 | 31.3 | 360 | 28.8 | 24 | 9.1 | 571 | 29.3 | 2,038 | 23.7 |
| Total | 1,118 | 47.0 | 1,409 | 51.1 | 673 | 53.8 | 78 | 29.5 | 1,081 | 55.4 | 4,359 | 50.7 |
| Region | ||||||||||||
| Border | 285 | 12.0 | 354 | 12.8 | 161 | 12.9 | 26 | 9.8 | 253 | 13.0 | 1,079 | 12.5 |
| Midland | 144 | 6.1 | 183 | 6.6 | 91 | 7.3 | 15 | 5.7 | 110 | 5.6 | 543 | 6.3 |
| West | 219 | 9.2 | 289 | 10.5 | 129 | 10.3 | 39 | 14.8 | 160 | 8.2 | 836 | 9.7 |
| Dublin | 646 | 27.2 | 699 | 25.4 | 311 | 24.8 | 46 | 17.4 | 580 | 29.7 | 2,282 | 26.5 |
| Mid-East | 230 | 9.7 | 199 | 7.2 | 120 | 9.6 | 18 | 6.8 | 163 | 8.4 | 730 | 8.5 |
| Mid-West | 244 | 10.3 | 273 | 9.9 | 139 | 11.1 | 38 | 14.4 | 173 | 8.9 | 867 | 10.1 |
| South-East | 253 | 10.6 | 333 | 12.1 | 132 | 10.5 | 30 | 11.4 | 238 | 12.2 | 986 | 11.5 |
| South-West | 358 | 15.0 | 427 | 15.5 | 169 | 13.5 | 52 | 19.7 | 275 | 14.1 | 1,281 | 14.9 |
| Total | 2,379 | 100.0 | 2,757 | 100.0 | 1,252 | 100.0 | 264 | 100.0 | 1,952 | 100.0 | 8,604 | 100.0 |
| Table 3 Marriages, civil partnerships, births, deaths and natural increase | ||||||||||||||
| Live Births | Deaths2 | |||||||||||||
| Marriages1 | Civil Partnerships | Total | First | Outside marriage/civil partnerships | Average Age | Total | Infant | Neo-natal | 65 & over | Natural Increase | ||||
| Quarter 1 | ||||||||||||||
| 2010 | 3,372 | - | 19,787 | 8,312 | 6,829 | 31.4 | 8,006 | 62 | 39 | 6,419 | 11,781 | |||
| 2011 | 3,047 | 6 | 19,950 | 8,008 | 6,768 | 31.7 | 8,093 | 72 | 60 | 6,455 | 11,857 | |||
| 2012 | 2,812 | 82 | 19,313 | 7,693 | 6,929 | 31.8 | 7,979 | 61 | 45 | 6,445 | 11,334 | |||
| 2013 | 3,312 | 52 | 17,563 | 6,752 | 6,406 | 32.1 | 8,347 | 55 | 36 | 6,782 | 9,216 | |||
| 2014 | 3,620 | 68 | 17,699 | 6,812 | 6,439 | 32.3 | 8,110 | 65 | 56 | 6,640 | 9,589 | |||
| 2015 | 3,665 | 81 | 17,183 | 6,456 | 6,202 | 32.5 | 8,604 | 55 | 31 | 7,175 | 8,579 | |||
| Quarter 2 | ||||||||||||||
| 2010 | 4,993 | - | 18,844 | 7,749 | 6,205 | 31.5 | 6,929 | 84 | 54 | 5,344 | 11,915 | |||
| 2011 | 5,015 | 184 | 18,381 | 7,080 | 6,013 | 31.8 | 7,277 | 61 | 41 | 5,618 | 11,104 | |||
| 2012 | 5,411 | 120 | 17,958 | 6,718 | 6,164 | 31.9 | 7,080 | 47 | 41 | 5,629 | 10,878 | |||
| 2013 | 5,212 | 72 | 17,107 | 6,372 | 5,824 | 32.2 | 7,644 | 58 | 38 | 6,206 | 9,463 | |||
| 2014 | 5,431 | 96 | 16,502 | 6,169 | 5,949 | 32.3 | 7,197 | 55 | 41 | 5,742 | 9,305 | |||
| 2015 | ||||||||||||||
| Quarter 3 | ||||||||||||||
| 2010 | 7,774 | - | 19,171 | 7,815 | 6,481 | 31.4 | 6,517 | 71 | 48 | 5,010 | 12,654 | |||
| 2011 | 7,532 | 204 | 19,222 | 7,512 | 6,543 | 31.7 | 6,911 | 65 | 41 | 5,303 | 12,311 | |||
| 2012 | 7,712 | 104 | 17,985 | 6,974 | 6,250 | 32.0 | 6,825 | 79 | 61 | 5,257 | 11,160 | |||
| 2013 | 7,541 | 120 | 17,729 | 6,608 | 6,243 | 32.1 | 6,983 | 59 | 46 | 5,522 | 10,746 | |||
| 2014 | 8,038 | 119 | 17,197 | 6,423 | 6,329 | 32.3 | 7,001 | 74 | 46 | 5,526 | 10,196 | |||
| 2015 | ||||||||||||||
| Quarter 4 | ||||||||||||||
| 2010 | 4,455 | - | 17,174 | 7,244 | 5,865 | 31.5 | 6,113 | 65 | 49 | 4,763 | 11,061 | |||
| 2011 | 4,261 | 142 | 17,097 | 6,841 | 5,866 | 31.8 | 6,714 | 60 | 48 | 5,255 | 10,383 | |||
| 2012 | 4,778 | 102 | 16,969 | 6,554 | 6,001 | 32.1 | 6,964 | 63 | 47 | 5,437 | 10,005 | |||
| 2013 | 4,615 | 89 | 16,531 | 6,379 | 5,920 | 32.2 | 7,044 | 56 | 44 | 5,470 | 9,487 | |||
| 2014 | 4,956 | 109 | 16,064 | 6,231 | 5,863 | 32.3 | 6,787 | 55 | 41 | 5,361 | 9,277 | |||
| 2015 | ||||||||||||||
| Total | ||||||||||||||
| 2010 | 20,594 | - | 74,976 | 31,120 | 25,380 | 31.5 | 27,565 | 282 | 190 | 21,536 | 47,411 | |||
| 2011 | 19,855 | 536 | 74,650 | 29,441 | 25,190 | 31.8 | 28,995 | 258 | 190 | 22,631 | 45,655 | |||
| 2012 | 20,713 | 429 | 72,225 | 27,939 | 25,344 | 31.9 | 28,848 | 250 | 194 | 22,768 | 43,377 | |||
| 2013 | 20,680 | 333 | 68,930 | 26,111 | 24,393 | 32.1 | 30,018 | 228 | 164 | 23,980 | 38,912 | |||
| 2014 | 22,045 | 392 | 67,462 | 25,635 | 24,580 | 32.3 | 29,095 | 249 | 184 | 23,269 | 38,367 | |||
| 2015 | ||||||||||||||
| 1 2010-2014 Marriage & Civil partnership figures are final. 2015 Marriage & Civil partnership data is subject to revision. | ||||||||||||||
| 2 See Background Notes for changes in methodology effective from 2007. | ||||||||||||||
| Table 4 Annual marriage, civil partnership, birth, death and natural increase rates per 1,000 population1 | |||||||||||
| Live Births | Deaths | ||||||||||
| Marriages5 | Civil Partnerships5 | Total | % First births 2 | % Outside marriage/civil partnerships | Total | Infant 3 Mortality | Neo-natal4 Mortality | 65 & over | Natural Increase | ||
| Quarter 1 | |||||||||||
| 2010 | 3.0 | - | 17.5 | 42.1 | 34.5 | 7.1 | 3.1 | 2.0 | 51.5 | 10.4 | |
| 2011 | 2.7 | 0.01 | 17.5 | 40.3 | 33.9 | 7.1 | 3.6 | 3.0 | 50.1 | 10.4 | |
| 2012 | 2.5 | 0.07 | 16.9 | 40.0 | 35.9 | 7.0 | 3.2 | 2.3 | 48.5 | 9.9 | |
| 2013 | 2.9 | 0.05 | 15.3 | 38.6 | 36.5 | 7.3 | 3.1 | 2.0 | 49.4 | 8.0 | |
| 2014 | 3.2 | 0.06 | 15.4 | 38.6 | 36.4 | 7.1 | 3.7 | 3.2 | 46.8 | 8.4 | |
| 2015 | 3.2 | 0.07 | 14.9 | 37.6 | 36.1 | 7.5 | 3.2 | 1.8 | 48.9 | 7.4 | |
| Quarter 2 | |||||||||||
| 2010 | 4.4 | - | 16.5 | 41.3 | 32.9 | 6.1 | 4.5 | 2.9 | 41.5 | 10.5 | |
| 2011 | 4.4 | 0.16 | 16.1 | 38.8 | 32.7 | 6.4 | 3.3 | 2.2 | 42.3 | 9.7 | |
| 2012 | 4.7 | 0.10 | 15.7 | 37.5 | 34.3 | 6.2 | 2.6 | 2.3 | 41.0 | 9.5 | |
| 2013 | 4.5 | 0.06 | 14.9 | 37.3 | 34.0 | 6.7 | 3.4 | 2.2 | 43.7 | 8.2 | |
| 2014 | 4.8 | 0.08 | 14.3 | 37.5 | 36.1 | 6.2 | 3.3 | 2.5 | 39.2 | 8.1 | |
| 2015 | |||||||||||
| Quarter 3 | |||||||||||
| 2010 | 6.8 | - | 16.8 | 41.0 | 33.8 | 5.7 | 3.7 | 2.5 | 38.9 | 11.1 | |
| 2011 | 6.6 | 0.18 | 16.8 | 39.3 | 34.0 | 6.0 | 3.4 | 2.1 | 39.9 | 10.8 | |
| 2012 | 6.7 | 0.09 | 15.7 | 38.9 | 34.8 | 6.0 | 4.4 | 3.4 | 38.3 | 9.7 | |
| 2013 | 6.6 | 0.10 | 15.4 | 37.4 | 35.2 | 6.1 | 3.3 | 2.6 | 38.9 | 9.4 | |
| 2014 | 7.0 | 0.10 | 14.9 | 37.5 | 36.8 | 6.1 | 4.3 | 2.7 | 37.7 | 8.8 | |
| 2015 | |||||||||||
| Quarter 4 | |||||||||||
| 2010 | 3.9 | - | 15.1 | 42.4 | 34.2 | 5.4 | 3.8 | 2.9 | 37.0 | 9.7 | |
| 2011 | 3.7 | 0.12 | 14.9 | 40.2 | 34.3 | 5.9 | 3.5 | 2.8 | 39.5 | 9.1 | |
| 2012 | 4.2 | 0.09 | 14.8 | 38.7 | 35.4 | 6.1 | 3.7 | 2.8 | 39.6 | 8.7 | |
| 2013 | 4.0 | 0.08 | 14.4 | 38.7 | 35.8 | 6.1 | 3.4 | 2.7 | 38.5 | 8.3 | |
| 2014 | 4.3 | 0.09 | 13.9 | 38.9 | 36.5 | 5.9 | 3.4 | 2.6 | 36.6 | 8.1 | |
| 2015 | |||||||||||
| Total | |||||||||||
| 2010 | 4.5 | - | 16.5 | 41.7 | 33.9 | 6.1 | 3.8 | 2.5 | 41.8 | 10.4 | |
| 2011 | 4.3 | 0.12 | 16.3 | 39.6 | 33.7 | 6.3 | 3.5 | 2.5 | 42.6 | 10.0 | |
| 2012 | 4.5 | 0.09 | 15.8 | 38.8 | 35.1 | 6.3 | 3.5 | 2.7 | 41.4 | 9.5 | |
| 2013 | 4.5 | 0.07 | 15.0 | 38.0 | 35.4 | 6.5 | 3.3 | 2.4 | 42.2 | 8.5 | |
| 2014 | 4.8 | 0.09 | 14.6 | 38.1 | 36.4 | 6.3 | 3.7 | 2.7 | 39.7 | 8.3 | |
| 2015 | |||||||||||
| 1 Rates are calculated using the Usual Residence population figures. | |||||||||||
| 2 First births divided by the total number of live births (excluding those with unstated parity), multiplied by 100. | |||||||||||
| 3 Infant mortality is the number of infant deaths per 1,000 live births. | |||||||||||
| 4 Neonatal mortality is the number of neonatal (infants aged under 4 weeks) deaths per 1,000 live births. | |||||||||||
| 5 Marriage & Civil partnership rates for 2015 are provisional. | |||||||||||
| Table 5 Births registered, classified by area of residence of mother, Jan. - Mar. 2015 | ||||||||||
| Area of residence | Total | Male | Female | Rate1 | ||||||
| STATE | 17,183 | 8,754 | 8,429 | 14.9 | ||||||
| LEINSTER | 9,912 | 5,041 | 4,871 | 15.7 | ||||||
| Carlow | 254 | 122 | 132 | 18.4 | ||||||
| Dublin City | 1,982 | 1,020 | 962 | 15.3 | ||||||
| South Dublin | 1,111 | 564 | 547 | 16.5 | ||||||
| Fingal | 1,309 | 648 | 661 | 18.9 | ||||||
| Dun Laoghaire Rathdown | 777 | 421 | 356 | 15.0 | ||||||
| Kildare | 924 | 482 | 442 | 17.4 | ||||||
| Kilkenny | 314 | 152 | 162 | 13.0 | ||||||
| Laois | 303 | 161 | 142 | 14.8 | ||||||
| Longford | 128 | 58 | 70 | 12.9 | ||||||
| Louth | 440 | 218 | 222 | 14.1 | ||||||
| Meath | 713 | 365 | 348 | 15.2 | ||||||
| Offaly | 285 | 136 | 149 | 14.7 | ||||||
| Westmeath | 328 | 167 | 161 | 15.1 | ||||||
| Wexford | 491 | 241 | 250 | 13.4 | ||||||
| Wicklow | 553 | 286 | 267 | 16.0 | ||||||
| MUNSTER | 4,488 | 2,301 | 2,187 | 14.3 | ||||||
| Clare | 421 | 219 | 202 | 14.3 | ||||||
| Cork City | 353 | 184 | 169 | 12.0 | ||||||
| Cork County | 1,622 | 834 | 788 | 16.0 | ||||||
| Kerry | 444 | 232 | 212 | 12.3 | ||||||
| Limerick City | 215 | 112 | 103 | 15.2 | ||||||
| Limerick County | 491 | 255 | 236 | 14.6 | ||||||
| North Tipperary | 270 | 129 | 141 | 15.1 | ||||||
| South Tipperary | 267 | 136 | 131 | 11.9 | ||||||
| Waterford City | 176 | 90 | 86 | 15.1 | ||||||
| Waterford County | 229 | 110 | 119 | 13.5 | ||||||
| CONNACHT | 1,853 | 944 | 909 | 13.7 | ||||||
| Galway City | 260 | 127 | 133 | 14.4 | ||||||
| Galway County | 664 | 331 | 333 | 15.1 | ||||||
| Leitrim | 113 | 61 | 52 | 14.0 | ||||||
| Mayo | 386 | 200 | 186 | 11.8 | ||||||
| Roscommon | 210 | 105 | 105 | 13.0 | ||||||
| Sligo | 220 | 120 | 100 | 13.5 | ||||||
| ULSTER (PART OF) | 930 | 468 | 462 | 12.5 | ||||||
| Cavan | 264 | 132 | 132 | 14.3 | ||||||
| Donegal | 481 | 247 | 234 | 11.9 | ||||||
| Monaghan | 185 | 89 | 96 | 12.0 | ||||||
| REGIONAL AUTHORITIES: | ||||||||||
| Border | 1,703 | 867 | 836 | 13.1 | ||||||
| Midland | 1,044 | 522 | 522 | 14.6 | ||||||
| West | 1,520 | 763 | 757 | 13.7 | ||||||
| Dublin | 5,179 | 2,653 | 2,526 | 16.3 | ||||||
| Mid-East | 2,190 | 1,133 | 1,057 | 16.3 | ||||||
| Mid-West | 1,397 | 715 | 682 | 14.7 | ||||||
| South-East | 1,731 | 851 | 880 | 13.8 | ||||||
| South-West | 2,419 | 1,250 | 1,169 | 14.5 | ||||||
| 1 Births per year per 1,000 population. Annual rates based on estimated usual residence 2014 population. | ||||||||||
| Table 6 Births registered, classified by age of mother and previous number of liveborn children, Jan. - Mar. 2015 | ||||||||
| Age of mother at maternity | Previous number of liveborn children | |||||||
| Total | 0 | 1 | 2 | 3 | 4 | 5 or more | Not stated | |
| All ages | 17,183 | 6,456 | 6,058 | 3,049 | 1,081 | 324 | 193 | 22 |
| 15 and under | 12 | 12 | – | – | – | – | – | – |
| 16 | 16 | 16 | – | – | – | – | – | – |
| 17 | 46 | 45 | 1 | – | – | – | – | – |
| 18 | 83 | 74 | 9 | – | – | – | – | – |
| 19 | 142 | 122 | 18 | 1 | 1 | – | – | – |
| Under 20 | 299 | 269 | 28 | 1 | 1 | – | – | – |
| 20 | 186 | 144 | 37 | 3 | 2 | – | – | – |
| 21 | 276 | 201 | 65 | 10 | – | – | – | – |
| 22 | 281 | 187 | 75 | 16 | 1 | 2 | – | – |
| 23 | 353 | 201 | 111 | 34 | 4 | 3 | – | – |
| 24 | 402 | 199 | 140 | 43 | 15 | 5 | – | – |
| 20-24 | 1,498 | 932 | 428 | 106 | 22 | 10 | – | – |
| 25 | 473 | 237 | 156 | 50 | 25 | 3 | 1 | 1 |
| 26 | 541 | 257 | 172 | 83 | 22 | 4 | 1 | 2 |
| 27 | 608 | 275 | 220 | 75 | 26 | 6 | 6 | – |
| 28 | 751 | 326 | 272 | 116 | 24 | 9 | 2 | 2 |
| 29 | 832 | 383 | 265 | 125 | 36 | 16 | 6 | 1 |
| 25-29 | 3,205 | 1,478 | 1,085 | 449 | 133 | 38 | 16 | 6 |
| 30 | 950 | 405 | 341 | 116 | 59 | 19 | 6 | 4 |
| 31 | 1,208 | 493 | 475 | 154 | 54 | 20 | 12 | – |
| 32 | 1,370 | 545 | 529 | 200 | 65 | 21 | 10 | – |
| 33 | 1,326 | 487 | 513 | 216 | 73 | 25 | 9 | 3 |
| 34 | 1,363 | 434 | 546 | 268 | 75 | 22 | 17 | 1 |
| 30-34 | 6,217 | 2,364 | 2,404 | 954 | 326 | 107 | 54 | 8 |
| 35 | 1,258 | 354 | 459 | 314 | 91 | 24 | 15 | 1 |
| 36 | 1,143 | 275 | 440 | 278 | 111 | 28 | 10 | 1 |
| 37 | 1,001 | 220 | 363 | 275 | 103 | 24 | 15 | 1 |
| 38 | 761 | 157 | 262 | 205 | 89 | 24 | 23 | 1 |
| 39 | 633 | 125 | 220 | 186 | 74 | 15 | 12 | 1 |
| 35-39 | 4,796 | 1,131 | 1,744 | 1,258 | 468 | 115 | 75 | 5 |
| 40 | 443 | 104 | 124 | 127 | 50 | 19 | 18 | 1 |
| 41 | 305 | 65 | 108 | 75 | 33 | 12 | 11 | 1 |
| 42 | 181 | 49 | 59 | 40 | 18 | 8 | 6 | 1 |
| 43 | 104 | 25 | 31 | 17 | 17 | 7 | 7 | – |
| 44 | 76 | 22 | 25 | 15 | 4 | 5 | 5 | – |
| 40-44 | 1,109 | 265 | 347 | 274 | 122 | 51 | 47 | 3 |
| 45 and over | 58 | 17 | 21 | 7 | 9 | 3 | 1 | – |
| Age not stated | 1 | – | 1 | – | – | – | – | – |
| Table 7 Number and percentage of births registered within and outside marriage/civil partnership, classified by age of mother, Jan. - Mar. 2015 | ||||||||
| Age of mother at maternity | Total | Married/Civil partnership parents | Unmarried/non-Civil partnership parents | Married/Civil partnership parents | Unmarried/non-Civil partnership parents | |||
| Total | Same | Total | Same | |||||
| address | address | |||||||
| Number | Percentage | |||||||
| All ages | 17,183 | 10,981 | 6,202 | 3,696 | 63.9 | 36.1 | 21.5 | |
| 15 and under | 12 | – | 12 | 1 | – | 100.0 | 8.3 | |
| 16 | 16 | – | 16 | 2 | – | 100.0 | 12.5 | |
| 17 | 46 | 4 | 42 | 10 | 8.7 | 91.3 | 21.7 | |
| 18 | 83 | 7 | 76 | 16 | 8.4 | 91.6 | 19.3 | |
| 19 | 142 | 11 | 131 | 36 | 7.7 | 92.3 | 25.4 | |
| Under 20 | 299 | 22 | 277 | 65 | 7.4 | 92.6 | 21.7 | |
| 20 | 186 | 22 | 164 | 57 | 11.8 | 88.2 | 30.6 | |
| 21 | 276 | 46 | 230 | 85 | 16.7 | 83.3 | 30.8 | |
| 22 | 281 | 47 | 234 | 99 | 16.7 | 83.3 | 35.2 | |
| 23 | 353 | 69 | 284 | 142 | 19.5 | 80.5 | 40.2 | |
| 24 | 402 | 84 | 318 | 161 | 20.9 | 79.1 | 40.0 | |
| 20-24 | 1,498 | 268 | 1,230 | 544 | 17.9 | 82.1 | 36.3 | |
| 25 | 473 | 121 | 352 | 192 | 25.6 | 74.4 | 40.6 | |
| 26 | 541 | 178 | 363 | 213 | 32.9 | 67.1 | 39.4 | |
| 27 | 608 | 265 | 343 | 212 | 43.6 | 56.4 | 34.9 | |
| 28 | 751 | 369 | 382 | 241 | 49.1 | 50.9 | 32.1 | |
| 29 | 832 | 466 | 366 | 232 | 56.0 | 44.0 | 27.9 | |
| 25-29 | 3,205 | 1,399 | 1,806 | 1,090 | 43.7 | 56.3 | 34.0 | |
| 30 | 950 | 605 | 345 | 228 | 63.7 | 36.3 | 24.0 | |
| 31 | 1,208 | 840 | 368 | 243 | 69.5 | 30.5 | 20.1 | |
| 32 | 1,370 | 1,014 | 356 | 258 | 74.0 | 26.0 | 18.8 | |
| 33 | 1,326 | 1,028 | 298 | 213 | 77.5 | 22.5 | 16.1 | |
| 34 | 1,363 | 1,069 | 294 | 210 | 78.4 | 21.6 | 15.4 | |
| 30-34 | 6,217 | 4,556 | 1,661 | 1,152 | 73.3 | 26.7 | 18.5 | |
| 35 | 1,258 | 1,012 | 246 | 170 | 80.4 | 19.6 | 13.5 | |
| 36 | 1,143 | 928 | 215 | 149 | 81.2 | 18.8 | 13.0 | |
| 37 | 1,001 | 803 | 198 | 136 | 80.2 | 19.8 | 13.6 | |
| 38 | 761 | 631 | 130 | 89 | 82.9 | 17.1 | 11.7 | |
| 39 | 633 | 492 | 141 | 94 | 77.7 | 22.3 | 14.8 | |
| 35-39 | 4,796 | 3,866 | 930 | 638 | 80.6 | 19.4 | 13.3 | |
| 40 | 443 | 335 | 108 | 80 | 75.6 | 24.4 | 18.1 | |
| 41 | 305 | 231 | 74 | 46 | 75.7 | 24.3 | 15.1 | |
| 42 | 181 | 133 | 48 | 33 | 73.5 | 26.5 | 18.2 | |
| 43 | 104 | 72 | 32 | 25 | 69.2 | 30.8 | 24.0 | |
| 44 | 76 | 56 | 20 | 15 | 73.7 | 26.3 | 19.7 | |
| 40-44 | 1,109 | 827 | 282 | 199 | 74.6 | 25.4 | 17.9 | |
| 45 and over | 58 | 43 | 15 | 8 | 74.1 | 25.9 | 13.8 | |
| Age not stated | 1 | – | 1 | – | – | 100.0 | – | |
| Table 8 Number and percentage of births registered within and outside marriage/civil partnership classified by area of residence of mother, Jan. - Mar. 2015 | ||||||||
| Total | ||||||||
| Area of residence | Married/Civil | Unmarried/non-Civil partnership parents | Married/Civil | Unmarried/non-Civil partnership parents | ||||
| partnership parents | partnership parents | |||||||
| Total | Same address | Total | Same address | |||||
| Number | Percentage | |||||||
| STATE | 17,183 | 10,981 | 6,202 | 3,696 | 63.9 | 36.1 | 21.5 | |
| LEINSTER | 9,912 | 6,129 | 3,783 | 2,218 | 61.8 | 38.2 | 22.4 | |
| Carlow | 254 | 137 | 117 | 71 | 53.9 | 46.1 | 28.0 | |
| Dublin City | 1,982 | 1,134 | 848 | 422 | 57.2 | 42.8 | 21.3 | |
| South Dublin | 1,111 | 642 | 469 | 222 | 57.8 | 42.2 | 20.0 | |
| Fingal | 1,309 | 856 | 453 | 308 | 65.4 | 34.6 | 23.5 | |
| Dun Laoghaire Rathdown | 777 | 599 | 178 | 121 | 77.1 | 22.9 | 15.6 | |
| Kildare | 924 | 634 | 290 | 173 | 68.6 | 31.4 | 18.7 | |
| Kilkenny | 314 | 192 | 122 | 74 | 61.1 | 38.9 | 23.6 | |
| Laois | 303 | 192 | 111 | 77 | 63.4 | 36.6 | 25.4 | |
| Longford | 128 | 69 | 59 | 47 | 53.9 | 46.1 | 36.7 | |
| Louth | 440 | 254 | 186 | 103 | 57.7 | 42.3 | 23.4 | |
| Meath | 713 | 447 | 266 | 167 | 62.7 | 37.3 | 23.4 | |
| Offaly | 285 | 163 | 122 | 80 | 57.2 | 42.8 | 28.1 | |
| Westmeath | 328 | 205 | 123 | 80 | 62.5 | 37.5 | 24.4 | |
| Wexford | 491 | 269 | 222 | 123 | 54.8 | 45.2 | 25.1 | |
| Wicklow | 553 | 336 | 217 | 150 | 60.8 | 39.2 | 27.1 | |
| MUNSTER | 4,488 | 2,901 | 1,587 | 946 | 64.6 | 35.4 | 21.1 | |
| Clare | 421 | 279 | 142 | 93 | 66.3 | 33.7 | 22.1 | |
| Cork City | 353 | 189 | 164 | 79 | 53.5 | 46.5 | 22.4 | |
| Cork County | 1,622 | 1,144 | 478 | 317 | 70.5 | 29.5 | 19.5 | |
| Kerry | 444 | 305 | 139 | 93 | 68.7 | 31.3 | 20.9 | |
| Limerick City | 215 | 93 | 122 | 46 | 43.3 | 56.7 | 21.4 | |
| Limerick County | 491 | 341 | 150 | 100 | 69.5 | 30.5 | 20.4 | |
| North Tipperary | 270 | 182 | 88 | 63 | 67.4 | 32.6 | 23.3 | |
| South Tipperary | 267 | 156 | 111 | 57 | 58.4 | 41.6 | 21.3 | |
| Waterford City | 176 | 80 | 96 | 46 | 45.5 | 54.5 | 26.1 | |
| Waterford County | 229 | 132 | 97 | 52 | 57.6 | 42.4 | 22.7 | |
| CONNACHT | 1,853 | 1,331 | 522 | 356 | 71.8 | 28.2 | 19.2 | |
| Galway City | 260 | 189 | 71 | 49 | 72.7 | 27.3 | 18.8 | |
| Galway County | 664 | 492 | 172 | 118 | 74.1 | 25.9 | 17.8 | |
| Leitrim | 113 | 85 | 28 | 23 | 75.2 | 24.8 | 20.4 | |
| Mayo | 386 | 273 | 113 | 72 | 70.7 | 29.3 | 18.7 | |
| Roscommon | 210 | 153 | 57 | 44 | 72.9 | 27.1 | 21.0 | |
| Sligo | 220 | 139 | 81 | 50 | 63.2 | 36.8 | 22.7 | |
| ULSTER (PART OF) | 930 | 620 | 310 | 176 | 66.7 | 33.3 | 18.9 | |
| Cavan | 264 | 184 | 80 | 49 | 69.7 | 30.3 | 18.6 | |
| Donegal | 481 | 304 | 177 | 96 | 63.2 | 36.8 | 20.0 | |
| Monaghan | 185 | 132 | 53 | 31 | 71.4 | 28.6 | 16.8 | |
| REGIONAL AUTHORITIES: | ||||||||
| Border | 1703 | 1098 | 605 | 352 | 64.5 | 35.5 | 20.7 | |
| Midland | 1,044 | 629 | 415 | 284 | 60.2 | 39.8 | 27.2 | |
| West | 1,520 | 1,107 | 413 | 283 | 72.8 | 27.2 | 18.6 | |
| Dublin | 5,179 | 3,231 | 1,948 | 1,073 | 62.4 | 37.6 | 20.7 | |
| Mid-East | 2,190 | 1,417 | 773 | 490 | 64.7 | 35.3 | 22.4 | |
| Mid-West | 1,397 | 895 | 502 | 302 | 64.1 | 35.9 | 21.6 | |
| South-East | 1,731 | 966 | 765 | 423 | 55.8 | 44.2 | 24.4 | |
| South-West | 2,419 | 1,638 | 781 | 489 | 67.7 | 32.3 | 20.2 | |
| Table 9 Births registered, classified by area of residence and age of mother, Jan. - Mar. 2015 | ||||||||||
| Area of residence | Total | Under 20 | 20-24 | 25-29 | 30-34 | 35-39 | 40 and over | Age not stated | Average age of mother at maternity | |
| All births | First births | |||||||||
| STATE | 17,183 | 299 | 1,498 | 3,205 | 6,217 | 4,796 | 1,167 | 1 | 32.5 | 30.6 |
| LEINSTER | 9,912 | 169 | 927 | 1,874 | 3,539 | 2,723 | 679 | 1 | 32.4 | 30.6 |
| Carlow | 254 | 4 | 40 | 58 | 75 | 61 | 16 | – | 31.3 | 29.4 |
| Dublin City | 1,982 | 38 | 200 | 383 | 672 | 550 | 139 | – | 32.3 | 31.1 |
| South Dublin | 1,111 | 21 | 112 | 264 | 401 | 253 | 60 | – | 31.7 | 29.5 |
| Fingal | 1,309 | 13 | 81 | 250 | 497 | 382 | 86 | – | 33.0 | 31.4 |
| Dun Laoghaire Rathdown | 777 | 5 | 35 | 88 | 298 | 270 | 81 | – | 34.2 | 32.6 |
| Kildare | 924 | 10 | 83 | 156 | 334 | 279 | 62 | – | 32.8 | 30.4 |
| Kilkenny | 314 | 6 | 29 | 57 | 106 | 88 | 28 | – | 32.8 | 30.1 |
| Laois | 303 | 6 | 40 | 52 | 110 | 83 | 12 | – | 31.7 | 28.6 |
| Longford | 128 | 5 | 25 | 24 | 45 | 23 | 6 | – | 30.3 | 27.8 |
| Louth | 440 | 12 | 49 | 93 | 155 | 100 | 31 | – | 31.9 | 29.5 |
| Meath | 713 | 11 | 60 | 134 | 263 | 198 | 47 | – | 32.6 | 30.5 |
| Offaly | 285 | 5 | 32 | 54 | 96 | 72 | 26 | – | 32.3 | 30.5 |
| Westmeath | 328 | 12 | 33 | 73 | 108 | 85 | 17 | – | 31.7 | 29.6 |
| Wexford | 491 | 11 | 67 | 96 | 171 | 121 | 25 | – | 31.6 | 29.1 |
| Wicklow | 553 | 10 | 41 | 92 | 208 | 158 | 43 | 1 | 32.8 | 30.9 |
| MUNSTER | 4,488 | 88 | 354 | 829 | 1,628 | 1,285 | 304 | – | 32.7 | 30.6 |
| Clare | 421 | 11 | 35 | 75 | 150 | 126 | 24 | – | 32.6 | 30.2 |
| Cork City | 353 | 10 | 36 | 86 | 128 | 71 | 22 | – | 31.5 | 30.2 |
| Cork County | 1,622 | 20 | 88 | 258 | 594 | 541 | 121 | – | 33.4 | 31.7 |
| Kerry | 444 | 9 | 23 | 74 | 172 | 130 | 36 | – | 33.1 | 31.5 |
| Limerick City | 215 | 12 | 39 | 55 | 64 | 34 | 11 | – | 30.0 | 27.9 |
| Limerick County | 491 | 5 | 43 | 93 | 181 | 131 | 38 | – | 32.7 | 30.5 |
| North Tipperary | 270 | 10 | 21 | 47 | 93 | 79 | 20 | – | 32.6 | 30.3 |
| South Tipperary | 267 | 7 | 26 | 64 | 86 | 73 | 11 | – | 31.8 | 29.2 |
| Waterford City | 176 | 1 | 21 | 35 | 74 | 39 | 6 | – | 31.6 | 29.6 |
| Waterford County | 229 | 3 | 22 | 42 | 86 | 61 | 15 | – | 32.5 | 29.8 |
| CONNACHT | 1,853 | 27 | 131 | 301 | 691 | 575 | 128 | – | 33.0 | 31.3 |
| Galway City | 260 | 4 | 22 | 49 | 99 | 69 | 17 | – | 32.5 | 30.9 |
| Galway County | 664 | 6 | 42 | 99 | 224 | 244 | 49 | – | 33.6 | 32.1 |
| Leitrim | 113 | 2 | 5 | 16 | 50 | 33 | 7 | – | 33.3 | 32.2 |
| Mayo | 386 | 7 | 27 | 59 | 161 | 109 | 23 | – | 32.8 | 30.8 |
| Roscommon | 210 | 3 | 17 | 37 | 73 | 62 | 18 | – | 32.9 | 30.9 |
| Sligo | 220 | 5 | 18 | 41 | 84 | 58 | 14 | – | 32.2 | 30.2 |
| ULSTER (PART OF) | 930 | 15 | 86 | 201 | 359 | 213 | 56 | – | 32.0 | 29.7 |
| Cavan | 264 | 6 | 24 | 54 | 106 | 54 | 20 | – | 32.1 | 29.5 |
| Donegal | 481 | 6 | 48 | 112 | 177 | 112 | 26 | – | 31.9 | 29.7 |
| Monaghan | 185 | 3 | 14 | 35 | 76 | 47 | 10 | – | 32.3 | 30.0 |
| REGIONAL AUTHORITIES: | ||||||||||
| Border | 1,703 | 34 | 158 | 351 | 648 | 404 | 108 | – | 32.1 | 29.9 |
| Midland | 1,044 | 28 | 130 | 203 | 359 | 263 | 61 | – | 31.7 | 29.4 |
| West | 1,520 | 20 | 108 | 244 | 557 | 484 | 107 | – | 33.1 | 31.4 |
| Dublin | 5,179 | 77 | 428 | 985 | 1,868 | 1,455 | 366 | – | 32.6 | 31.1 |
| Mid-East | 2,190 | 31 | 184 | 382 | 805 | 635 | 152 | 1 | 32.7 | 30.5 |
| Mid-West | 1,397 | 38 | 138 | 270 | 488 | 370 | 93 | – | 32.2 | 29.9 |
| South-East | 1,731 | 32 | 205 | 352 | 598 | 443 | 101 | – | 31.9 | 29.5 |
| South-West | 2,419 | 39 | 147 | 418 | 894 | 742 | 179 | – | 33.1 | 31.4 |
| Table 10 Births registered outside marriage/civil partnership, classified by area of residence and age of mother, Jan. - Mar. 2015 | |||||||||||||||
| Area of residence | Total | Under 25 | 25-29 | 30-34 | 35-39 | 40 and over | Age not stated | Average age of mother at maternity | |||||||
| All births | First births | ||||||||||||||
| STATE | 6,202 | 1,507 | 1,806 | 1,661 | 930 | 297 | 1 | 29.6 | 27.9 | ||||||
| LEINSTER | 3,783 | 926 | 1,088 | 1,014 | 569 | 185 | 1 | 29.7 | 28.0 | ||||||
| Carlow | 117 | 41 | 33 | 24 | 17 | 2 | – | 28.1 | 26.9 | ||||||
| Dublin City | 848 | 200 | 242 | 224 | 138 | 44 | – | 29.8 | 28.6 | ||||||
| South Dublin | 469 | 111 | 159 | 123 | 62 | 14 | – | 29.1 | 27.0 | ||||||
| Fingal | 453 | 78 | 138 | 142 | 72 | 23 | – | 30.6 | 29.5 | ||||||
| Dun Laoghaire Rathdown | 178 | 31 | 40 | 46 | 42 | 19 | – | 31.7 | 30.3 | ||||||
| Kildare | 290 | 83 | 81 | 68 | 43 | 15 | – | 29.3 | 26.6 | ||||||
| Kilkenny | 122 | 31 | 37 | 31 | 19 | 4 | – | 29.2 | 27.5 | ||||||
| Laois | 111 | 39 | 28 | 27 | 15 | 2 | – | 28.4 | 25.6 | ||||||
| Longford | 59 | 22 | 12 | 18 | 6 | 1 | – | 28.0 | 26.8 | ||||||
| Louth | 186 | 51 | 60 | 42 | 27 | 6 | – | 29.0 | 26.7 | ||||||
| Meath | 266 | 56 | 73 | 82 | 37 | 18 | – | 30.2 | 28.0 | ||||||
| Offaly | 122 | 26 | 32 | 37 | 15 | 12 | – | 30.3 | 29.6 | ||||||
| Westmeath | 123 | 40 | 41 | 25 | 12 | 5 | – | 28.2 | 25.7 | ||||||
| Wexford | 222 | 71 | 56 | 61 | 27 | 7 | – | 28.7 | 26.9 | ||||||
| Wicklow | 217 | 46 | 56 | 64 | 37 | 13 | 1 | 30.3 | 28.7 | ||||||
| MUNSTER | 1,587 | 376 | 467 | 441 | 228 | 75 | – | 29.6 | 28.0 | ||||||
| Clare | 142 | 40 | 41 | 37 | 18 | 6 | – | 29.0 | 27.3 | ||||||
| Cork City | 164 | 38 | 47 | 51 | 19 | 9 | – | 29.7 | 28.3 | ||||||
| Cork County | 478 | 91 | 137 | 133 | 87 | 30 | – | 30.4 | 29.0 | ||||||
| Kerry | 139 | 25 | 42 | 35 | 28 | 9 | – | 30.5 | 29.3 | ||||||
| Limerick City | 122 | 45 | 36 | 29 | 8 | 4 | – | 27.9 | 26.6 | ||||||
| Limerick County | 150 | 37 | 45 | 39 | 21 | 8 | – | 29.7 | 27.2 | ||||||
| North Tipperary | 88 | 24 | 25 | 24 | 13 | 2 | – | 29.0 | 26.8 | ||||||
| South Tipperary | 111 | 32 | 41 | 25 | 13 | – | – | 28.0 | 26.7 | ||||||
| Waterford City | 96 | 20 | 22 | 40 | 10 | 4 | – | 30.0 | 28.7 | ||||||
| Waterford County | 97 | 24 | 31 | 28 | 11 | 3 | – | 29.4 | 26.4 | ||||||
| CONNACHT | 522 | 115 | 157 | 135 | 93 | 22 | – | 29.9 | 28.1 | ||||||
| Galway City | 71 | 15 | 22 | 24 | 8 | 2 | – | 29.7 | 28.4 | ||||||
| Galway County | 172 | 34 | 49 | 40 | 43 | 6 | – | 30.6 | 29.1 | ||||||
| Leitrim | 28 | 4 | 9 | 9 | 4 | 2 | – | 30.9 | 30.3 | ||||||
| Mayo | 113 | 29 | 32 | 27 | 19 | 6 | – | 29.5 | 27.3 | ||||||
| Roscommon | 57 | 15 | 16 | 13 | 10 | 3 | – | 29.8 | 26.9 | ||||||
| Sligo | 81 | 18 | 29 | 22 | 9 | 3 | – | 28.7 | 26.9 | ||||||
| ULSTER (PART OF) | 310 | 90 | 94 | 71 | 40 | 15 | – | 29.0 | 26.5 | ||||||
| Cavan | 80 | 24 | 26 | 16 | 9 | 5 | – | 28.8 | 26.6 | ||||||
| Donegal | 177 | 50 | 52 | 43 | 23 | 9 | – | 29.1 | 26.2 | ||||||
| Monaghan | 53 | 16 | 16 | 12 | 8 | 1 | – | 28.8 | 27.0 | ||||||
| REGIONAL AUTHORITIES: | |||||||||||||||
| Border | 605 | 163 | 192 | 144 | 80 | 26 | – | 29.0 | 26.7 | ||||||
| Midland | 415 | 127 | 113 | 107 | 48 | 20 | – | 28.8 | 26.7 | ||||||
| West | 413 | 93 | 119 | 104 | 80 | 17 | – | 30.1 | 28.2 | ||||||
| Dublin | 1,948 | 420 | 579 | 535 | 314 | 100 | – | 30.0 | 28.6 | ||||||
| Mid-East | 773 | 185 | 210 | 214 | 117 | 46 | 1 | 29.9 | 27.6 | ||||||
| Mid-West | 502 | 146 | 147 | 129 | 60 | 20 | – | 28.9 | 27.0 | ||||||
| South-East | 765 | 219 | 220 | 209 | 97 | 20 | – | 28.9 | 27.2 | ||||||
| South-West | 781 | 154 | 226 | 219 | 134 | 48 | – | 30.3 | 28.9 | ||||||
| Table 11 Births registered, classified by nationality of mother, marital status and age, Jan. - Mar. 2015 | |||||||
| Nationality of mother | Total births | Births inside marriage/civil partnership | Births outside marriage/civil partnership | Average age of mother at maternity | |||
| Number | Percentage | Number | Percentage | Number | Percentage | ||
| TOTAL | 17,183 | 100.0 | 10,981 | 63.9 | 6,202 | 36.1 | 32.5 |
| Ireland | 13,468 | 78.4 | 8,643 | 64.2 | 4,825 | 35.8 | 32.9 |
| United Kingdom | 395 | 2.3 | 200 | 50.6 | 195 | 49.4 | 31.4 |
| EU15 excl. Irl & UK | 294 | 1.7 | 159 | 54.1 | 135 | 45.9 | 34.2 |
| EU15 to EU 28 * | 1,941 | 11.3 | 1,142 | 58.8 | 799 | 41.2 | 30.6 |
| Other | 1,073 | 6.2 | 828 | 77.2 | 245 | 22.8 | 31.7 |
| Not stated | 12 | 0.1 | 9 | 75.0 | 3 | 25.0 | 33.6 |
| * Croatia included in EU 15 to EU 28 from q3 2013. | |||||||
| Table 12 Deaths registered by county of residence of deceased, January - March 2015 | ||||
| Area of residence | Total | Male | Female | Rate1 |
| STATE | 8,604 | 4,245 | 4,359 | 7.5 |
| LEINSTER | 4,336 | 2,072 | 2,264 | 6.9 |
| Carlow | 123 | 61 | 62 | 8.9 |
| Dublin City | 1,250 | 555 | 695 | 9.7 |
| South Dublin | 289 | 136 | 153 | 4.3 |
| Fingal | 279 | 137 | 142 | 4.0 |
| Dun Laoghaire Rathdown | 464 | 198 | 266 | 9.0 |
| Kildare | 258 | 132 | 126 | 4.9 |
| Kilkenny | 166 | 88 | 78 | 6.9 |
| Laois | 146 | 66 | 80 | 7.1 |
| Longford | 77 | 38 | 39 | 7.8 |
| Louth | 217 | 111 | 106 | 7.0 |
| Meath | 238 | 118 | 120 | 5.1 |
| Offaly | 146 | 87 | 59 | 7.5 |
| Westmeath | 174 | 82 | 92 | 8.0 |
| Wexford | 275 | 144 | 131 | 7.5 |
| Wicklow | 234 | 119 | 115 | 6.8 |
| MUNSTER | 2,570 | 1,274 | 1,296 | 8.2 |
| Clare | 243 | 135 | 108 | 8.3 |
| Cork City | 271 | 135 | 136 | 9.2 |
| Cork County | 663 | 330 | 333 | 6.5 |
| Kerry | 347 | 161 | 186 | 9.6 |
| Limerick City | 169 | 78 | 91 | 11.9 |
| Limerick County | 278 | 142 | 136 | 8.3 |
| North Tipperary | 177 | 88 | 89 | 9.9 |
| South Tipperary | 199 | 100 | 99 | 8.9 |
| Waterford City | 85 | 36 | 49 | 7.3 |
| Waterford County | 138 | 69 | 69 | 8.1 |
| CONNACHT | 1,073 | 570 | 503 | 7.9 |
| Galway City | 109 | 52 | 57 | 6.0 |
| Galway County | 297 | 159 | 138 | 6.7 |
| Leitrim | 86 | 47 | 39 | 10.6 |
| Mayo | 288 | 161 | 127 | 8.8 |
| Roscommon | 142 | 77 | 65 | 8.8 |
| Sligo | 151 | 74 | 77 | 9.2 |
| ULSTER (PART OF) | 625 | 329 | 296 | 8.4 |
| Cavan | 158 | 71 | 87 | 8.5 |
| Donegal | 339 | 188 | 151 | 8.4 |
| Monaghan | 128 | 70 | 58 | 8.3 |
| REGIONAL AUTHORITIES: | ||||
| Border | 1,079 | 561 | 518 | 8.3 |
| Midland | 543 | 273 | 270 | 7.6 |
| West | 836 | 449 | 387 | 7.5 |
| Dublin | 2,282 | 1,026 | 1,256 | 7.2 |
| Mid-East | 730 | 369 | 361 | 5.4 |
| Mid-West | 867 | 443 | 424 | 9.1 |
| South-East | 986 | 498 | 488 | 7.8 |
| South-West | 1,281 | 626 | 655 | 7.7 |
| 1 Deaths per year per 1,000 population. Annual rates based on estimated 2014 Usual Residence population. | ||||
| Table 13 Deaths registered by cause of death and county of residence of deceased, January - March 2015 | ||||||
| Area of residence | Total Deaths | Malignant Neoplasms | Diseases of the Circulatory system | Diseases of the Respiratory system | External causes | All other causes |
| STATE | 8,604 | 2,379 | 2,757 | 1,252 | 264 | 1,952 |
| LEINSTER | 4,336 | 1,214 | 1,353 | 639 | 94 | 1,036 |
| Carlow | 123 | 38 | 42 | 16 | 0 | 27 |
| Dublin City | 1,250 | 341 | 386 | 182 | 21 | 320 |
| South Dublin | 289 | 89 | 83 | 35 | 12 | 70 |
| Fingal | 279 | 86 | 86 | 33 | 8 | 66 |
| Dun Laoghaire Rathdown | 464 | 130 | 144 | 61 | 5 | 124 |
| Kildare | 258 | 83 | 78 | 35 | 9 | 53 |
| Kilkenny | 166 | 35 | 68 | 25 | 8 | 30 |
| Laois | 146 | 44 | 47 | 24 | 4 | 27 |
| Longford | 77 | 25 | 23 | 10 | 1 | 18 |
| Louth | 217 | 52 | 72 | 38 | 2 | 53 |
| Meath | 238 | 75 | 62 | 49 | 2 | 50 |
| Offaly | 146 | 37 | 51 | 25 | 4 | 29 |
| Westmeath | 174 | 38 | 62 | 32 | 6 | 36 |
| Wexford | 275 | 69 | 90 | 38 | 5 | 73 |
| Wicklow | 234 | 72 | 59 | 36 | 7 | 60 |
| MUNSTER | 2,570 | 713 | 833 | 361 | 107 | 556 |
| Clare | 243 | 75 | 82 | 27 | 14 | 45 |
| Cork City | 271 | 88 | 84 | 32 | 15 | 52 |
| Cork County | 663 | 187 | 221 | 84 | 27 | 144 |
| Kerry | 347 | 83 | 122 | 53 | 10 | 79 |
| Limerick City | 169 | 46 | 52 | 32 | 7 | 32 |
| Limerick County | 278 | 72 | 79 | 58 | 9 | 60 |
| North Tipperary | 177 | 51 | 60 | 22 | 8 | 36 |
| South Tipperary | 199 | 43 | 65 | 27 | 6 | 58 |
| Waterford City | 85 | 28 | 24 | 10 | 3 | 20 |
| Waterford County | 138 | 40 | 44 | 16 | 8 | 30 |
| CONNACHT | 1,073 | 289 | 373 | 161 | 43 | 207 |
| Galway City | 109 | 35 | 35 | 15 | 7 | 17 |
| Galway County | 297 | 81 | 102 | 42 | 15 | 57 |
| Leitrim | 86 | 26 | 33 | 9 | 2 | 16 |
| Mayo | 288 | 72 | 111 | 45 | 7 | 53 |
| Roscommon | 142 | 31 | 41 | 27 | 10 | 33 |
| Sligo | 151 | 44 | 51 | 23 | 2 | 31 |
| ULSTER (PART OF) | 625 | 163 | 198 | 91 | 20 | 153 |
| Cavan | 158 | 42 | 51 | 20 | 3 | 42 |
| Donegal | 339 | 88 | 112 | 48 | 9 | 82 |
| Monaghan | 128 | 33 | 35 | 23 | 8 | 29 |
| REGIONAL AUTHORITIES: | ||||||
| Border | 1,079 | 285 | 354 | 161 | 26 | 253 |
| Midland | 543 | 144 | 183 | 91 | 15 | 110 |
| West | 836 | 219 | 289 | 129 | 39 | 160 |
| Dublin | 2,282 | 646 | 699 | 311 | 46 | 580 |
| Mid-East | 730 | 230 | 199 | 120 | 18 | 163 |
| Mid-West | 867 | 244 | 273 | 139 | 38 | 173 |
| South-East | 986 | 253 | 333 | 132 | 30 | 238 |
| South-West | 1,281 | 358 | 427 | 169 | 52 | 275 |
| Table 14 Deaths registered classified by cause of death and age group, January - March 2015 | ||||||||||||||||
| Age Group | ||||||||||||||||
| Cause of Death | 65 COD | ICD-10 | Total | Under 1 | 1-4 | 5-14 | 15-24 | 25-34 | 35-44 | 45-54 | 55-64 | 65-74 | 75-84 | 85 and | ||
| Code | Code | Deaths | over | |||||||||||||
| Total deaths | 0 | A00-Y89 | 8,604 | 55 | 12 | 8 | 45 | 80 | 139 | 327 | 763 | 1,408 | 2,561 | 3,206 | ||
| Infectious and parasitic diseases:- | 1 | A00-B99 | 82 | 0 | 0 | 0 | 1 | 1 | 2 | 3 | 6 | 7 | 33 | 29 | ||
| Tuberculosis | 2 | A15-A19,B90 | 2 | 0 | 0 | 0 | 0 | 0 | 0 | 0 | 2 | 0 | 0 | 0 | ||
| Meningococcal infection | 3 | A39 | 1 | 0 | 0 | 0 | 1 | 0 | 0 | 0 | 0 | 0 | 0 | 0 | ||
| AIDS (HIV Disease) | 4 | B20-B24 | 5 | 0 | 0 | 0 | 0 | 1 | 0 | 2 | 2 | 0 | 0 | 0 | ||
| Viral Hepatitis | 5 | B15-B19 | 3 | 0 | 0 | 0 | 0 | 0 | 1 | 0 | 0 | 0 | 2 | 0 | ||
| Other infectious and parasitic | ||||||||||||||||
| diseases | 71 | 0 | 0 | 0 | 0 | 0 | 1 | 1 | 2 | 7 | 31 | 29 | ||||
| Neoplasms | 6 | C00-D48 | 2,451 | 1 | 3 | 4 | 4 | 12 | 52 | 149 | 375 | 627 | 776 | 448 | ||
| Malignant Neoplasms of the:- | 7 | C00-C97 | 2,379 | 1 | 3 | 4 | 4 | 12 | 52 | 146 | 369 | 615 | 752 | 421 | ||
| Lip, oral cavity, pharynx | 8 | C00-C14 | 47 | 0 | 0 | 0 | 0 | 0 | 1 | 1 | 10 | 13 | 15 | 7 | ||
| Oesophagus | 9 | C15 | 108 | 0 | 0 | 0 | 0 | 0 | 2 | 7 | 20 | 38 | 24 | 17 | ||
| Stomach | 10 | C16 | 87 | 0 | 0 | 0 | 0 | 1 | 2 | 5 | 19 | 19 | 29 | 12 | ||
| Colon | 11 | C18 | 156 | 0 | 0 | 0 | 0 | 1 | 3 | 4 | 24 | 27 | 61 | 36 | ||
| Rectum and anus | 12 | C19-C21 | 126 | 0 | 0 | 0 | 0 | 0 | 4 | 5 | 20 | 31 | 37 | 29 | ||
| Liver and the intrahepatic bile ducts | 13 | C22 | 88 | 0 | 0 | 1 | 0 | 0 | 2 | 5 | 6 | 22 | 37 | 15 | ||
| Pancreas | 14 | C25 | 131 | 0 | 0 | 0 | 0 | 0 | 2 | 7 | 27 | 37 | 40 | 18 | ||
| Larynx and trachea/bronchus /lung | 15 | C32-C34 | 512 | 0 | 0 | 0 | 0 | 1 | 7 | 26 | 89 | 165 | 169 | 55 | ||
| Skin | 16 | C43 | 43 | 0 | 0 | 0 | 0 | 0 | 4 | 2 | 5 | 11 | 14 | 7 | ||
| Breast | 17 | C50 | 200 | 0 | 0 | 0 | 0 | 3 | 7 | 28 | 35 | 42 | 47 | 38 | ||
| Cervix uteri | 18 | C53 | 23 | 0 | 0 | 0 | 0 | 1 | 5 | 7 | 4 | 2 | 2 | 2 | ||
| Other parts of uterus | 19 | C54-C55 | 41 | 0 | 0 | 0 | 0 | 0 | 0 | 3 | 9 | 13 | 10 | 6 | ||
| Ovary | 20 | C56 | 66 | 0 | 0 | 0 | 0 | 0 | 1 | 6 | 14 | 20 | 15 | 10 | ||
| Prostate | 21 | C61 | 138 | 0 | 0 | 0 | 0 | 0 | 0 | 1 | 9 | 17 | 53 | 58 | ||
| Kidney | 22 | C64 | 56 | 0 | 0 | 0 | 0 | 0 | 0 | 5 | 5 | 16 | 23 | 7 | ||
| Bladder | 23 | C67 | 78 | 0 | 0 | 0 | 0 | 0 | 1 | 1 | 4 | 15 | 34 | 23 | ||
| Lymph/haematopoietic tissue | 24 | C81-C96 | 189 | 0 | 1 | 0 | 0 | 0 | 4 | 9 | 25 | 53 | 57 | 40 | ||
| Other malignant neoplasms | 290 | 1 | 2 | 3 | 4 | 5 | 7 | 24 | 44 | 74 | 85 | 41 | ||||
| Diseases of the blood and | ||||||||||||||||
| blood-forming organs, | ||||||||||||||||
| immunological disorders | 25 | D50-D89 | 34 | 0 | 0 | 0 | 0 | 1 | 3 | 3 | 5 | 5 | 7 | 10 | ||
| Endocrine, Nutritional and metabolic | ||||||||||||||||
| diseases | 26 | E00-E90 | 203 | 3 | 1 | 0 | 2 | 3 | 3 | 7 | 5 | 31 | 59 | 89 | ||
| Diabetes mellitus | 27 | E10-E14 | 150 | 0 | 0 | 0 | 0 | 1 | 2 | 6 | 4 | 23 | 41 | 73 | ||
| Mental and behavioural disorders | 28 | F00-F99 | 478 | 0 | 0 | 0 | 0 | 0 | 1 | 4 | 10 | 17 | 156 | 290 | ||
| Alcohol abuse (including alcoholic | ||||||||||||||||
| psychosis) | 29 | F10 | 6 | 0 | 0 | 0 | 0 | 0 | 1 | 1 | 3 | 1 | 0 | 0 | ||
| Drug dependence, toxicomania | 30 | F11-F16,F18-F19 | 0 | 0 | 0 | 0 | 0 | 0 | 0 | 0 | 0 | 0 | 0 | 0 | ||
| Diseases of the nervous system and | ||||||||||||||||
| the sense organs | 31 | G00-H95 | 480 | 0 | 3 | 2 | 3 | 3 | 11 | 10 | 23 | 75 | 170 | 180 | ||
| Meningitis | 32 | G00-G03 | 1 | 0 | 0 | 0 | 0 | 0 | 0 | 0 | 0 | 0 | 0 | 1 | ||
| Diseases of the Circulatory System:- | 33 | I00-I99 | 2,757 | 0 | 0 | 0 | 4 | 5 | 22 | 88 | 206 | 364 | 778 | 1,290 | ||
| Ischaemic heart disease | 34 | I20-I25 | 1,349 | 0 | 0 | 0 | 0 | 2 | 6 | 54 | 129 | 212 | 378 | 568 | ||
| of which: (Acute myocardial infarction) | I21 | 622 | 0 | 0 | 0 | 0 | 1 | 2 | 19 | 55 | 84 | 179 | 282 | |||
| Other heart disease | 35 | I30-I33,I39-I52 | 448 | 0 | 0 | 0 | 4 | 1 | 3 | 11 | 26 | 35 | 104 | 264 | ||
| Cerebrovascular disease | 36 | I60-I69 | 561 | 0 | 0 | 0 | 0 | 1 | 4 | 9 | 29 | 58 | 172 | 288 | ||
| Other diseases of circulatory system | 399 | 0 | 0 | 0 | 0 | 1 | 9 | 14 | 22 | 59 | 124 | 170 | ||||
| Diseases of the Respiratory system | 37 | J00-J99 | 1,252 | 0 | 0 | 0 | 0 | 0 | 1 | 10 | 59 | 177 | 397 | 608 | ||
| Influenza | 38 | J10-J11 | 22 | 0 | 0 | 0 | 0 | 0 | 0 | 0 | 3 | 1 | 8 | 10 | ||
| Pneumonia | 39 | J12-J19 | 379 | 0 | 0 | 0 | 0 | 0 | 1 | 4 | 13 | 24 | 87 | 250 | ||
| Chronic Lower respiratory disease | 40 | J40-J47 | 544 | 0 | 0 | 0 | 0 | 0 | 0 | 4 | 27 | 104 | 206 | 203 | ||
| of which: Asthma | 41 | J45-J46 | 20 | 0 | 0 | 0 | 0 | 0 | 0 | 1 | 1 | 2 | 6 | 10 | ||
| Other diseases of the respiratory | ||||||||||||||||
| system | 307 | 0 | 0 | 0 | 0 | 0 | 0 | 2 | 16 | 48 | 96 | 145 | ||||
| Diseases of the Digestive system | 42 | K00-K93 | 255 | 0 | 0 | 0 | 0 | 3 | 8 | 25 | 30 | 41 | 71 | 77 | ||
| Ulcer of stomach, duodenum and | ||||||||||||||||
| jejunum | 43 | K25-K28 | 22 | 0 | 0 | 0 | 0 | 0 | 0 | 0 | 1 | 6 | 5 | 10 | ||
| Chronic liver disease | 44 | K70,K73-K74 | 64 | 0 | 0 | 0 | 0 | 2 | 6 | 17 | 15 | 11 | 10 | 3 | ||
| Other diseases of the digestive | ||||||||||||||||
| system | 169 | 0 | 0 | 0 | 0 | 1 | 2 | 8 | 14 | 24 | 56 | 64 | ||||
| Diseases of the skin and subcutaneous | ||||||||||||||||
| tissue | 45 | L00-L99 | 17 | 0 | 0 | 0 | 0 | 0 | 0 | 0 | 2 | 1 | 6 | 8 | ||
| Diseases of the musculoskeletal | ||||||||||||||||
| system/connective tissue | 46 | M00-M99 | 68 | 1 | 0 | 0 | 0 | 0 | 1 | 1 | 2 | 11 | 19 | 33 | ||
| Rheumatoid arthritis and | ||||||||||||||||
| osteoarthrosis | 47 | M05-M06,M15-M19 | 22 | 0 | 0 | 0 | 0 | 0 | 0 | 0 | 0 | 3 | 9 | 10 | ||
| Diseases of the genitourinary system | 48 | N00-N99 | 173 | 0 | 0 | 0 | 0 | 1 | 1 | 1 | 6 | 18 | 56 | 90 | ||
| Diseases of the kidney and ureter | 49 | N00-N29 | 126 | 0 | 0 | 0 | 0 | 1 | 1 | 0 | 6 | 14 | 42 | 62 | ||
| Complications of pregnancy, childbirth | ||||||||||||||||
| and puerperium | 50 | O00-O99 | 0 | 0 | 0 | 0 | 0 | 0 | 0 | 0 | 0 | 0 | 0 | 0 | ||
| Certain conditions originating in the | ||||||||||||||||
| perinatal period1 | 51 | P00-P96 | 22 | 22 | 0 | 0 | 0 | 0 | 0 | 0 | 0 | 0 | 0 | 0 | ||
| Congenital malformations and | ||||||||||||||||
| chromosomal abnomalities | 52 | Q00-Q99 | 43 | 24 | 3 | 0 | 1 | 3 | 3 | 0 | 4 | 2 | 3 | 0 | ||
| Congenital malformations of the:- | ||||||||||||||||
| Nervous system | 53 | Q00-Q07 | 5 | 3 | 1 | 0 | 0 | 1 | 0 | 0 | 0 | 0 | 0 | 0 | ||
| Circulatory system | 54 | Q20-Q28 | 14 | 5 | 2 | 0 | 0 | 1 | 1 | 0 | 0 | 2 | 3 | 0 | ||
| Symptoms, signs, abnormal | ||||||||||||||||
| findings, ill-defined causes | 55 | R00-R99 | 25 | 3 | 0 | 0 | 0 | 0 | 2 | 1 | 1 | 2 | 3 | 13 | ||
| Sudden infant death syndrome | 56 | R95 | 3 | 3 | 0 | 0 | 0 | 0 | 0 | 0 | 0 | 0 | 0 | 0 | ||
| Unknown and unspecified causes | 57 | R96-R99 | 7 | 0 | 0 | 0 | 0 | 0 | 2 | 1 | 1 | 1 | 0 | 2 | ||
| External causes of injury and poisoning | 58 | V01-Y89 | 264 | 1 | 2 | 2 | 30 | 48 | 29 | 25 | 29 | 30 | 27 | 41 | ||
| Accidents | 59 | V01-X59 | 173 | 1 | 1 | 2 | 14 | 30 | 12 | 14 | 17 | 19 | 22 | 41 | ||
| of which: Transport accidents | 60 | V01-V99 | 36 | 1 | 0 | 2 | 6 | 6 | 2 | 3 | 4 | 6 | 4 | 2 | ||
| Accidental falls | 61 | W00-W19 | 23 | 0 | 0 | 0 | 1 | 0 | 0 | 2 | 5 | 2 | 5 | 8 | ||
| Accidental poisoning | 62 | X40-X49 | 42 | 0 | 0 | 0 | 4 | 16 | 10 | 3 | 4 | 5 | 0 | 0 | ||
| other accidents | 72 | 0 | 1 | 0 | 3 | 8 | 0 | 6 | 4 | 6 | 13 | 31 | ||||
| Suicide and intentional self harm | 63 | X60-X84 | 77 | 0 | 0 | 0 | 15 | 15 | 16 | 11 | 11 | 7 | 2 | 0 | ||
| Homicide/assault | 64 | X85-Y09 | 4 | 0 | 1 | 0 | 0 | 3 | 0 | 0 | 0 | 0 | 0 | 0 | ||
| Events of undetermined intent | 65 | Y10-Y34 | 4 | 0 | 0 | 0 | 1 | 0 | 1 | 0 | 1 | 1 | 0 | 0 | ||
| All other external causes | 6 | 0 | 0 | 0 | 0 | 0 | 0 | 0 | 0 | 3 | 3 | 0 | ||||
| 1Stillbirths not included | ||||||||||||||||
| Table 15 Male deaths registered classified by Eurostat shortlist cause and age group, January - March 2015 | ||||||||||||||||
| Age Group | ||||||||||||||||
| Cause of Death | 65 COD | ICD-10 | Total | Under 1 | 1-4 | 5-14 | 15-24 | 25-34 | 35-44 | 45-54 | 55-64 | 65-74 | 75-84 | 85 and | ||
| Code | Code | Males | over | |||||||||||||
| Total Male Deaths | 0 | A00-Y89 | 4,245 | 33 | 8 | 2 | 37 | 55 | 96 | 195 | 452 | 847 | 1,352 | 1,168 | ||
| Infectious and parasitic diseases:- | 1 | A00-B99 | 38 | 0 | 0 | 0 | 0 | 1 | 2 | 3 | 3 | 1 | 14 | 14 | ||
| Tuberculosis | 2 | A15-A19,B90 | 1 | 0 | 0 | 0 | 0 | 0 | 0 | 0 | 1 | 0 | 0 | 0 | ||
| Meningococcal infection | 3 | A39 | 0 | 0 | 0 | 0 | 0 | 0 | 0 | 0 | 0 | 0 | 0 | 0 | ||
| AIDS (HIV Disease) | 4 | B20-B24 | 4 | 0 | 0 | 0 | 0 | 1 | 0 | 2 | 1 | 0 | 0 | 0 | ||
| Viral Hepatitis | 5 | B15-B19 | 2 | 0 | 0 | 0 | 0 | 0 | 1 | 0 | 0 | 0 | 1 | 0 | ||
| Other infectious and parasitic | ||||||||||||||||
| diseases | 31 | 0 | 0 | 0 | 0 | 0 | 1 | 1 | 1 | 1 | 13 | 14 | ||||
| Neoplasms | 6 | C00-D48 | 1,300 | 1 | 2 | 2 | 2 | 5 | 32 | 64 | 194 | 360 | 425 | 213 | ||
| Malignant Neoplasms of the:- | 7 | C00-C97 | 1,261 | 1 | 2 | 2 | 2 | 5 | 32 | 61 | 190 | 352 | 414 | 200 | ||
| Lip, oral cavity, pharynx | 8 | C00-C14 | 35 | 0 | 0 | 0 | 0 | 0 | 1 | 1 | 7 | 11 | 11 | 4 | ||
| Oesophagus | 9 | C15 | 73 | 0 | 0 | 0 | 0 | 0 | 2 | 7 | 14 | 27 | 17 | 6 | ||
| Stomach | 10 | C16 | 61 | 0 | 0 | 0 | 0 | 0 | 1 | 3 | 14 | 14 | 23 | 6 | ||
| Colon | 11 | C18 | 85 | 0 | 0 | 0 | 0 | 1 | 1 | 2 | 13 | 15 | 35 | 18 | ||
| Rectum and anus | 12 | C19-C21 | 71 | 0 | 0 | 0 | 0 | 0 | 2 | 3 | 12 | 21 | 19 | 14 | ||
| Liver and the intrahepatic bile ducts | 13 | C22 | 53 | 0 | 0 | 0 | 0 | 0 | 2 | 2 | 3 | 16 | 22 | 8 | ||
| Pancreas | 14 | C25 | 75 | 0 | 0 | 0 | 0 | 0 | 2 | 5 | 14 | 26 | 23 | 5 | ||
| Larynx and trachea/bronchus /lung | 15 | C32-C34 | 286 | 0 | 0 | 0 | 0 | 1 | 6 | 12 | 53 | 98 | 89 | 27 | ||
| Skin | 16 | C43 | 28 | 0 | 0 | 0 | 0 | 0 | 3 | 2 | 4 | 9 | 9 | 1 | ||
| Breast | 17 | C50 | 0 | 0 | 0 | 0 | 0 | 0 | 0 | 0 | 0 | 0 | 0 | 0 | ||
| Cervix uteri | 18 | C53 | 0 | 0 | 0 | 0 | 0 | 0 | 0 | 0 | 0 | 0 | 0 | 0 | ||
| Other parts of uterus | 19 | C54-C55 | 0 | 0 | 0 | 0 | 0 | 0 | 0 | 0 | 0 | 0 | 0 | 0 | ||
| Ovary | 20 | C56 | 0 | 0 | 0 | 0 | 0 | 0 | 0 | 0 | 0 | 0 | 0 | 0 | ||
| Prostate | 21 | C61 | 138 | 0 | 0 | 0 | 0 | 0 | 0 | 1 | 9 | 17 | 53 | 58 | ||
| Kidney | 22 | C64 | 35 | 0 | 0 | 0 | 0 | 0 | 0 | 5 | 4 | 11 | 12 | 3 | ||
| Bladder | 23 | C67 | 58 | 0 | 0 | 0 | 0 | 0 | 1 | 1 | 2 | 11 | 28 | 15 | ||
| Lymph/haematopoietic tissue | 24 | C81-C96 | 102 | 0 | 0 | 0 | 0 | 0 | 4 | 5 | 13 | 30 | 30 | 20 | ||
| Other malignant neoplasms | 161 | 1 | 2 | 2 | 2 | 3 | 7 | 12 | 28 | 46 | 43 | 15 | ||||
| Diseases of the blood and | ||||||||||||||||
| blood-forming organs, | ||||||||||||||||
| immunological disorders | 25 | D50-D89 | 13 | 0 | 0 | 0 | 0 | 0 | 2 | 1 | 3 | 2 | 3 | 2 | ||
| Endocrine, Nutritional and metabolic | ||||||||||||||||
| diseases | 26 | E00-E90 | 107 | 2 | 1 | 0 | 1 | 3 | 3 | 5 | 2 | 21 | 32 | 37 | ||
| Diabetes mellitus | 27 | E10-E14 | 82 | 0 | 0 | 0 | 0 | 1 | 2 | 5 | 1 | 16 | 24 | 33 | ||
| Mental and behavioural disorders | 28 | F00-F99 | 177 | 0 | 0 | 0 | 0 | 0 | 1 | 3 | 7 | 9 | 77 | 80 | ||
| Alcohol abuse (including alcoholic | ||||||||||||||||
| psychosis) | 29 | F10 | 3 | 0 | 0 | 0 | 0 | 0 | 1 | 0 | 2 | 0 | 0 | 0 | ||
| Drug dependence, toxicomania | 30 | F11-F16,F18-F19 | 0 | 0 | 0 | 0 | 0 | 0 | 0 | 0 | 0 | 0 | 0 | 0 | ||
| Diseases of the nervous system and | ||||||||||||||||
| the sense organs | 31 | G00-H95 | 199 | 0 | 2 | 0 | 3 | 2 | 8 | 6 | 11 | 40 | 78 | 49 | ||
| Meningitis | 32 | G00-G03 | 1 | 0 | 0 | 0 | 0 | 0 | 0 | 0 | 0 | 0 | 0 | 1 | ||
| Diseases of the Circulatory System:- | 33 | I00-I99 | 1,348 | 0 | 0 | 0 | 3 | 3 | 16 | 71 | 150 | 238 | 439 | 428 | ||
| Ischaemic heart disease | 34 | I20-I25 | 779 | 0 | 0 | 0 | 0 | 1 | 6 | 46 | 103 | 151 | 254 | 218 | ||
| of which: (Acute myocardial infarction) | I21 | 343 | 0 | 0 | 0 | 0 | 0 | 2 | 16 | 46 | 62 | 118 | 99 | |||
| Other heart disease | 35 | I30-I33,I39-I52 | 176 | 0 | 0 | 0 | 3 | 1 | 1 | 8 | 18 | 25 | 48 | 72 | ||
| Cerebrovascular disease | 36 | I60-I69 | 229 | 0 | 0 | 0 | 0 | 0 | 3 | 7 | 20 | 33 | 81 | 85 | ||
| Other diseases of circulatory system | 164 | 0 | 0 | 0 | 0 | 1 | 6 | 10 | 9 | 29 | 56 | 53 | ||||
| Diseases of the Respiratory system | 37 | J00-J99 | 579 | 0 | 0 | 0 | 0 | 0 | 1 | 8 | 34 | 102 | 186 | 248 | ||
| Influenza | 38 | J10-J11 | 10 | 0 | 0 | 0 | 0 | 0 | 0 | 0 | 2 | 0 | 3 | 5 | ||
| Pneumonia | 39 | J12-J19 | 146 | 0 | 0 | 0 | 0 | 0 | 1 | 3 | 5 | 13 | 36 | 88 | ||
| Chronic Lower respiratory disease | 40 | J40-J47 | 255 | 0 | 0 | 0 | 0 | 0 | 0 | 3 | 14 | 53 | 93 | 92 | ||
| of which: Asthma | 41 | J45-J46 | 3 | 0 | 0 | 0 | 0 | 0 | 0 | 0 | 0 | 0 | 2 | 1 | ||
| Other diseases of the respiratory | ||||||||||||||||
| system | 168 | 0 | 0 | 0 | 0 | 0 | 0 | 2 | 13 | 36 | 54 | 63 | ||||
| Diseases of the Digestive system | 42 | K00-K93 | 138 | 0 | 0 | 0 | 0 | 2 | 3 | 17 | 18 | 31 | 41 | 26 | ||
| Ulcer of stomach, duodenum and | ||||||||||||||||
| jejunum | 43 | K25-K28 | 11 | 0 | 0 | 0 | 0 | 0 | 0 | 0 | 1 | 5 | 3 | 2 | ||
| Chronic liver disease | 44 | K70,K73-K74 | 43 | 0 | 0 | 0 | 0 | 2 | 3 | 13 | 10 | 8 | 5 | 2 | ||
| Other diseases of the digestive | ||||||||||||||||
| system | 84 | 0 | 0 | 0 | 0 | 0 | 0 | 4 | 7 | 18 | 33 | 22 | ||||
| Diseases of the skin and subcutaneous | ||||||||||||||||
| tissue | 45 | L00-L99 | 9 | 0 | 0 | 0 | 0 | 0 | 0 | 0 | 1 | 0 | 3 | 5 | ||
| Diseases of the musculoskeletal | ||||||||||||||||
| system/connective tissue | 46 | M00-M99 | 23 | 0 | 0 | 0 | 0 | 0 | 1 | 0 | 1 | 7 | 5 | 9 | ||
| Rheumatoid arthritis and | ||||||||||||||||
| osteoarthrosis | 47 | M05-M06,M15-M19 | 3 | 0 | 0 | 0 | 0 | 0 | 0 | 0 | 0 | 1 | 1 | 1 | ||
| Diseases of the genitourinary system | 48 | N00-N99 | 79 | 0 | 0 | 0 | 0 | 0 | 0 | 0 | 4 | 10 | 30 | 35 | ||
| Diseases of the kidney and ureter | 49 | N00-N29 | 62 | 0 | 0 | 0 | 0 | 0 | 0 | 0 | 4 | 9 | 25 | 24 | ||
| Complications of pregnancy, childbirth | ||||||||||||||||
| and puerperium | 50 | O00-O99 | 0 | 0 | 0 | 0 | 0 | 0 | 0 | 0 | 0 | 0 | 0 | 0 | ||
| Certain conditions originating in the | ||||||||||||||||
| perinatal period1 | 51 | P00-P96 | 13 | 13 | 0 | 0 | 0 | 0 | 0 | 0 | 0 | 0 | 0 | 0 | ||
| Congenital malformations and | ||||||||||||||||
| chromosomal abnomalities | 52 | Q00-Q99 | 25 | 14 | 1 | 0 | 1 | 1 | 2 | 0 | 4 | 1 | 1 | 0 | ||
| Congenital malformations of the:- | ||||||||||||||||
| Nervous system | 53 | Q00-Q07 | 2 | 1 | 0 | 0 | 0 | 1 | 0 | 0 | 0 | 0 | 0 | 0 | ||
| Circulatory system | 54 | Q20-Q28 | 5 | 2 | 1 | 0 | 0 | 0 | 0 | 0 | 0 | 1 | 1 | 0 | ||
| Symptoms, signs, abnormal | ||||||||||||||||
| findings, ill-defined causes | 55 | R00-R99 | 11 | 2 | 0 | 0 | 0 | 0 | 1 | 1 | 1 | 1 | 0 | 5 | ||
| Sudden infant death syndrome | 56 | R95 | 2 | 2 | 0 | 0 | 0 | 0 | 0 | 0 | 0 | 0 | 0 | 0 | ||
| Unknown and unspecified causes | 57 | R96-R99 | 4 | 0 | 0 | 0 | 0 | 0 | 1 | 1 | 1 | 0 | 0 | 1 | ||
| External causes of injury and poisoning | 58 | V01-Y89 | 186 | 1 | 2 | 0 | 27 | 38 | 24 | 16 | 19 | 24 | 18 | 17 | ||
| Accidents | 59 | V01-X59 | 109 | 1 | 1 | 0 | 11 | 24 | 9 | 9 | 8 | 15 | 14 | 17 | ||
| of which: Transport accidents | 60 | V01-V99 | 25 | 1 | 0 | 0 | 4 | 6 | 0 | 2 | 3 | 5 | 3 | 1 | ||
| Accidental falls | 61 | W00-W19 | 10 | 0 | 0 | 0 | 1 | 0 | 0 | 1 | 1 | 2 | 2 | 3 | ||
| Accidental poisoning | 62 | X40-X49 | 32 | 0 | 0 | 0 | 3 | 13 | 9 | 2 | 1 | 4 | 0 | 0 | ||
| other accidents | 42 | 0 | 1 | 0 | 3 | 5 | 0 | 4 | 3 | 4 | 9 | 13 | ||||
| Suicide and intentional self harm | 63 | X60-X84 | 65 | 0 | 0 | 0 | 15 | 11 | 14 | 7 | 10 | 6 | 2 | 0 | ||
| Homicide/assault | 64 | X85-Y09 | 4 | 0 | 1 | 0 | 0 | 3 | 0 | 0 | 0 | 0 | 0 | 0 | ||
| Events of undetermined intent | 65 | Y10-Y34 | 4 | 0 | 0 | 0 | 1 | 0 | 1 | 0 | 1 | 1 | 0 | 0 | ||
| All other external causes | 4 | 0 | 0 | 0 | 0 | 0 | 0 | 0 | 0 | 2 | 2 | 0 | ||||
| 1Stillbirths not included | ||||||||||||||||
| Table 16 Female deaths registered classified by cause of death and age group, January - March 2015 | ||||||||||||||||
| Age Group | ||||||||||||||||
| Cause of Death | 65 COD | ICD-10 | Total | Under 1 | 1-4 | 5-14 | 15-24 | 25-34 | 35-44 | 45-54 | 55-64 | 65-74 | 75-84 | 85 and | ||
| Code | Code | Females | over | |||||||||||||
| Total Female Deaths | 0 | A00-Y89 | 4,359 | 22 | 4 | 6 | 8 | 25 | 43 | 132 | 311 | 561 | 1,209 | 2,038 | ||
| Infectious and parasitic diseases:- | 1 | A00-B99 | 44 | 0 | 0 | 0 | 1 | 0 | 0 | 0 | 3 | 6 | 19 | 15 | ||
| Tuberculosis | 2 | A15-A19,B90 | 1 | 0 | 0 | 0 | 0 | 0 | 0 | 0 | 1 | 0 | 0 | 0 | ||
| Meningococcal infection | 3 | A39 | 1 | 0 | 0 | 0 | 1 | 0 | 0 | 0 | 0 | 0 | 0 | 0 | ||
| AIDS (HIV Disease) | 4 | B20-B24 | 1 | 0 | 0 | 0 | 0 | 0 | 0 | 0 | 1 | 0 | 0 | 0 | ||
| Viral Hepatitis | 5 | B15-B19 | 1 | 0 | 0 | 0 | 0 | 0 | 0 | 0 | 0 | 0 | 1 | 0 | ||
| Other infectious and parasitic | ||||||||||||||||
| diseases | 40 | 0 | 0 | 0 | 0 | 0 | 0 | 0 | 1 | 6 | 18 | 15 | ||||
| Neoplasms | 6 | C00-D48 | 1,151 | 0 | 1 | 2 | 2 | 7 | 20 | 85 | 181 | 267 | 351 | 235 | ||
| Malignant Neoplasms of the:- | 7 | C00-C97 | 1,118 | 0 | 1 | 2 | 2 | 7 | 20 | 85 | 179 | 263 | 338 | 221 | ||
| Lip, oral cavity, pharynx | 8 | C00-C14 | 12 | 0 | 0 | 0 | 0 | 0 | 0 | 0 | 3 | 2 | 4 | 3 | ||
| Oesophagus | 9 | C15 | 35 | 0 | 0 | 0 | 0 | 0 | 0 | 0 | 6 | 11 | 7 | 11 | ||
| Stomach | 10 | C16 | 26 | 0 | 0 | 0 | 0 | 1 | 1 | 2 | 5 | 5 | 6 | 6 | ||
| Colon | 11 | C18 | 71 | 0 | 0 | 0 | 0 | 0 | 2 | 2 | 11 | 12 | 26 | 18 | ||
| Rectum and anus | 12 | C19-C21 | 55 | 0 | 0 | 0 | 0 | 0 | 2 | 2 | 8 | 10 | 18 | 15 | ||
| Liver and the intrahepatic bile ducts | 13 | C22 | 35 | 0 | 0 | 1 | 0 | 0 | 0 | 3 | 3 | 6 | 15 | 7 | ||
| Pancreas | 14 | C25 | 56 | 0 | 0 | 0 | 0 | 0 | 0 | 2 | 13 | 11 | 17 | 13 | ||
| Larynx and trachea/bronchus /lung | 15 | C32-C34 | 226 | 0 | 0 | 0 | 0 | 0 | 1 | 14 | 36 | 67 | 80 | 28 | ||
| Skin | 16 | C43 | 15 | 0 | 0 | 0 | 0 | 0 | 1 | 0 | 1 | 2 | 5 | 6 | ||
| Breast | 17 | C50 | 200 | 0 | 0 | 0 | 0 | 3 | 7 | 28 | 35 | 42 | 47 | 38 | ||
| Cervix uteri | 18 | C53 | 23 | 0 | 0 | 0 | 0 | 1 | 5 | 7 | 4 | 2 | 2 | 2 | ||
| Other parts of uterus | 19 | C54-C55 | 41 | 0 | 0 | 0 | 0 | 0 | 0 | 3 | 9 | 13 | 10 | 6 | ||
| Ovary | 20 | C56 | 66 | 0 | 0 | 0 | 0 | 0 | 1 | 6 | 14 | 20 | 15 | 10 | ||
| Prostate | 21 | C61 | 0 | 0 | 0 | 0 | 0 | 0 | 0 | 0 | 0 | 0 | 0 | 0 | ||
| Kidney | 22 | C64 | 21 | 0 | 0 | 0 | 0 | 0 | 0 | 0 | 1 | 5 | 11 | 4 | ||
| Bladder | 23 | C67 | 20 | 0 | 0 | 0 | 0 | 0 | 0 | 0 | 2 | 4 | 6 | 8 | ||
| Lymph/haematopoietic tissue | 24 | C81-C96 | 87 | 0 | 1 | 0 | 0 | 0 | 0 | 4 | 12 | 23 | 27 | 20 | ||
| Other malignant neoplasms | 129 | 0 | 0 | 1 | 2 | 2 | 0 | 12 | 16 | 28 | 42 | 26 | ||||
| Diseases of the blood and | ||||||||||||||||
| blood-forming organs, | ||||||||||||||||
| immunological disorders | 25 | D50-D89 | 21 | 0 | 0 | 0 | 0 | 1 | 1 | 2 | 2 | 3 | 4 | 8 | ||
| Endocrine, Nutritional and metabolic | ||||||||||||||||
| diseases | 26 | E00-E90 | 96 | 1 | 0 | 0 | 1 | 0 | 0 | 2 | 3 | 10 | 27 | 52 | ||
| Diabetes mellitus | 27 | E10-E14 | 68 | 0 | 0 | 0 | 0 | 0 | 0 | 1 | 3 | 7 | 17 | 40 | ||
| Mental and behavioural disorders | 28 | F00-F99 | 301 | 0 | 0 | 0 | 0 | 0 | 0 | 1 | 3 | 8 | 79 | 210 | ||
| Alcohol abuse (including alcoholic | ||||||||||||||||
| psychosis) | 29 | F10 | 3 | 0 | 0 | 0 | 0 | 0 | 0 | 1 | 1 | 1 | 0 | 0 | ||
| Drug dependence, toxicomania | 30 | F11-F16,F18-F19 | 0 | 0 | 0 | 0 | 0 | 0 | 0 | 0 | 0 | 0 | 0 | 0 | ||
| Diseases of the nervous system and | ||||||||||||||||
| the sense organs | 31 | G00-H95 | 281 | 0 | 1 | 2 | 0 | 1 | 3 | 4 | 12 | 35 | 92 | 131 | ||
| Meningitis | 32 | G00-G03 | 0 | 0 | 0 | 0 | 0 | 0 | 0 | 0 | 0 | 0 | 0 | 0 | ||
| Diseases of the Circulatory System:- | 33 | I00-I99 | 1,409 | 0 | 0 | 0 | 1 | 2 | 6 | 17 | 56 | 126 | 339 | 862 | ||
| Ischaemic heart disease | 34 | I20-I25 | 570 | 0 | 0 | 0 | 0 | 1 | 0 | 8 | 26 | 61 | 124 | 350 | ||
| of which: (Acute myocardial infarction) | I21 | 279 | 0 | 0 | 0 | 0 | 1 | 0 | 3 | 9 | 22 | 61 | 183 | |||
| Other heart disease | 35 | I30-I33,I39-I52 | 272 | 0 | 0 | 0 | 1 | 0 | 2 | 3 | 8 | 10 | 56 | 192 | ||
| Cerebrovascular disease | 36 | I60-I69 | 332 | 0 | 0 | 0 | 0 | 1 | 1 | 2 | 9 | 25 | 91 | 203 | ||
| Other diseases of circulatory system | 235 | 0 | 0 | 0 | 0 | 0 | 3 | 4 | 13 | 30 | 68 | 117 | ||||
| Diseases of the Respiratory system | 37 | J00-J99 | 673 | 0 | 0 | 0 | 0 | 0 | 0 | 2 | 25 | 75 | 211 | 360 | ||
| Influenza | 38 | J10-J11 | 12 | 0 | 0 | 0 | 0 | 0 | 0 | 0 | 1 | 1 | 5 | 5 | ||
| Pneumonia | 39 | J12-J19 | 233 | 0 | 0 | 0 | 0 | 0 | 0 | 1 | 8 | 11 | 51 | 162 | ||
| Chronic Lower respiratory disease | 40 | J40-J47 | 289 | 0 | 0 | 0 | 0 | 0 | 0 | 1 | 13 | 51 | 113 | 111 | ||
| of which: Asthma | 41 | J45-J46 | 17 | 0 | 0 | 0 | 0 | 0 | 0 | 1 | 1 | 2 | 4 | 9 | ||
| Other diseases of the respiratory | ||||||||||||||||
| system | 139 | 0 | 0 | 0 | 0 | 0 | 0 | 0 | 3 | 12 | 42 | 82 | ||||
| Diseases of the Digestive system | 42 | K00-K93 | 117 | 0 | 0 | 0 | 0 | 1 | 5 | 8 | 12 | 10 | 30 | 51 | ||
| Ulcer of stomach, duodenum and | ||||||||||||||||
| jejunum | 43 | K25-K28 | 11 | 0 | 0 | 0 | 0 | 0 | 0 | 0 | 0 | 1 | 2 | 8 | ||
| Chronic liver disease | 44 | K70,K73-K74 | 21 | 0 | 0 | 0 | 0 | 0 | 3 | 4 | 5 | 3 | 5 | 1 | ||
| Other diseases of the digestive | ||||||||||||||||
| system | 85 | 0 | 0 | 0 | 0 | 1 | 2 | 4 | 7 | 6 | 23 | 42 | ||||
| Diseases of the skin and subcutaneous | ||||||||||||||||
| tissue | 45 | L00-L99 | 8 | 0 | 0 | 0 | 0 | 0 | 0 | 0 | 1 | 1 | 3 | 3 | ||
| Diseases of the musculoskeletal | ||||||||||||||||
| system/connective tissue | 46 | M00-M99 | 45 | 1 | 0 | 0 | 0 | 0 | 0 | 1 | 1 | 4 | 14 | 24 | ||
| Rheumatoid arthritis and | ||||||||||||||||
| osteoarthrosis | 47 | M05-M06,M15-M19 | 19 | 0 | 0 | 0 | 0 | 0 | 0 | 0 | 0 | 2 | 8 | 9 | ||
| Diseases of the genitourinary system | 48 | N00-N99 | 94 | 0 | 0 | 0 | 0 | 1 | 1 | 1 | 2 | 8 | 26 | 55 | ||
| Diseases of the kidney and ureter | 49 | N00-N29 | 64 | 0 | 0 | 0 | 0 | 1 | 1 | 0 | 2 | 5 | 17 | 38 | ||
| Complications of pregnancy, childbirth | ||||||||||||||||
| and puerperium | 50 | O00-O99 | 0 | 0 | 0 | 0 | 0 | 0 | 0 | 0 | 0 | 0 | 0 | 0 | ||
| Certain conditions originating in the | ||||||||||||||||
| perinatal period1 | 51 | P00-P96 | 9 | 9 | 0 | 0 | 0 | 0 | 0 | 0 | 0 | 0 | 0 | 0 | ||
| Congenital malformations and | ||||||||||||||||
| chromosomal abnomalities | 52 | Q00-Q99 | 18 | 10 | 2 | 0 | 0 | 2 | 1 | 0 | 0 | 1 | 2 | 0 | ||
| Congenital malformations of the:- | ||||||||||||||||
| Nervous system | 53 | Q00-Q07 | 3 | 2 | 1 | 0 | 0 | 0 | 0 | 0 | 0 | 0 | 0 | 0 | ||
| Circulatory system | 54 | Q20-Q28 | 9 | 3 | 1 | 0 | 0 | 1 | 1 | 0 | 0 | 1 | 2 | 0 | ||
| Symptoms, signs, abnormal | ||||||||||||||||
| findings, ill-defined causes | 55 | R00-R99 | 14 | 1 | 0 | 0 | 0 | 0 | 1 | 0 | 0 | 1 | 3 | 8 | ||
| Sudden infant death syndrome | 56 | R95 | 1 | 1 | 0 | 0 | 0 | 0 | 0 | 0 | 0 | 0 | 0 | 0 | ||
| Unknown and unspecified causes | 57 | R96-R99 | 3 | 0 | 0 | 0 | 0 | 0 | 1 | 0 | 0 | 1 | 0 | 1 | ||
| External causes of injury and poisoning | 58 | V01-Y89 | 78 | 0 | 0 | 2 | 3 | 10 | 5 | 9 | 10 | 6 | 9 | 24 | ||
| Accidents | 59 | V01-X59 | 64 | 0 | 0 | 2 | 3 | 6 | 3 | 5 | 9 | 4 | 8 | 24 | ||
| of which: Transport accidents | 60 | V01-V99 | 11 | 0 | 0 | 2 | 2 | 0 | 2 | 1 | 1 | 1 | 1 | 1 | ||
| Accidental falls | 61 | W00-W19 | 13 | 0 | 0 | 0 | 0 | 0 | 0 | 1 | 4 | 0 | 3 | 5 | ||
| Accidental poisoning | 62 | X40-X49 | 10 | 0 | 0 | 0 | 1 | 3 | 1 | 1 | 3 | 1 | 0 | 0 | ||
| other accidents | 30 | 0 | 0 | 0 | 0 | 3 | 0 | 2 | 1 | 2 | 4 | 18 | ||||
| Suicide and intentional self harm | 63 | X60-X84 | 12 | 0 | 0 | 0 | 0 | 4 | 2 | 4 | 1 | 1 | 0 | 0 | ||
| Homicide/assault | 64 | X85-Y09 | 0 | 0 | 0 | 0 | 0 | 0 | 0 | 0 | 0 | 0 | 0 | 0 | ||
| Events of undetermined intent | 65 | Y10-Y34 | 0 | 0 | 0 | 0 | 0 | 0 | 0 | 0 | 0 | 0 | 0 | 0 | ||
| All other external causes | 2 | 0 | 0 | 0 | 0 | 0 | 0 | 0 | 0 | 1 | 1 | 0 | ||||
| 1 Stillbirths not included. | ||||||||||||||||
| Table 17 Infant and neonatal mortality by area of residence of deceased, January - March 2015 | |||||
| Infant mortality | Neonatal mortality | ||||
| Area of residence | Number | Rate | Number | Rate | |
| STATE | 55 | 3.2 | 31 | 1.8 | |
| LEINSTER | 32 | 3.2 | 18 | 1.8 | |
| Carlow | 2 | 7.9 | 2 | 7.9 | |
| Dublin City | 3 | 1.5 | 2 | 1.0 | |
| South Dublin | 3 | 2.7 | 1 | 0.9 | |
| Fingal | 6 | 4.6 | 2 | 1.5 | |
| Dun Laoghaire Rathdown | 3 | 3.9 | 1 | 1.3 | |
| Kildare | 2 | 2.2 | 1 | 1.1 | |
| Kilkenny | 0 | 0.0 | 0 | 0.0 | |
| Laois | 1 | 3.3 | 1 | 3.3 | |
| Longford | 2 | 15.6 | 2 | 15.6 | |
| Louth | 2 | 4.5 | 1 | 2.3 | |
| Meath | 1 | 1.4 | 1 | 1.4 | |
| Offaly | 2 | 7.0 | 2 | 7.0 | |
| Westmeath | 1 | 3.0 | 0 | 0.0 | |
| Wexford | 2 | 4.1 | 1 | 2.0 | |
| Wicklow | 2 | 3.6 | 1 | 1.8 | |
| MUNSTER | 13 | 2.9 | 9 | 2.0 | |
| Clare | 2 | 4.8 | 2 | 4.8 | |
| Cork City | 1 | 2.8 | 1 | 2.8 | |
| Cork County | 4 | 2.5 | 3 | 1.8 | |
| Kerry | 1 | 2.3 | 0 | 0.0 | |
| Limerick City | 1 | 4.7 | 0 | 0.0 | |
| Limerick County | 2 | 4.1 | 2 | 4.1 | |
| North Tipperary | 1 | 3.7 | 1 | 3.7 | |
| South Tipperary | 0 | 0.0 | 0 | 0.0 | |
| Waterford City | 0 | 0.0 | 0 | 0.0 | |
| Waterford County | 1 | 4.4 | 0 | 0.0 | |
| CONNACHT | 4 | 2.2 | 2 | 1.1 | |
| Galway City | 0 | 0.0 | 0 | 0.0 | |
| Galway County | 1 | 1.5 | 0 | 0.0 | |
| Leitrim | 0 | 0.0 | 0 | 0.0 | |
| Mayo | 2 | 5.2 | 1 | 2.6 | |
| Roscommon | 0 | 0.0 | 0 | 0.0 | |
| Sligo | 1 | 4.5 | 1 | 4.5 | |
| ULSTER (PART OF) | 6 | 6.5 | 2 | 2.2 | |
| Cavan | 0 | 0.0 | 0 | 0.0 | |
| Donegal | 4 | 8.3 | 1 | 2.1 | |
| Monaghan | 2 | 10.8 | 1 | 5.4 | |
| REGIONAL AUTHORITIES: | |||||
| Border | 9 | 5.3 | 4 | 2.3 | |
| Midland | 6 | 5.7 | 5 | 4.8 | |
| West | 3 | 2.0 | 1 | 0.7 | |
| Dublin | 15 | 2.9 | 6 | 1.2 | |
| Mid-East | 5 | 2.3 | 3 | 1.4 | |
| Mid-West | 6 | 4.3 | 5 | 3.6 | |
| South-East | 5 | 2.9 | 3 | 1.7 | |
| South-West | 6 | 2.5 | 4 | 1.7 | |
| Infant mortality rates: Deaths of infants under one year per 1,000 live births, classified by area of residence of mother. | |||||
| Neonatal mortality rates: Deaths of infants under 28 days per 1,000 live births, classified by area of residence of mother. | |||||
| Infant and neonatal mortality rates in some areas, based on small numbers are subject to considerable fluctuation and caution should be exercised in their interpretation. | |||||
Introduction
This report has been prepared by the Central Statistics Office for the Minister for Social Protection in accordance with the provisions of Section 2 of the Vital Statistics and Births, Deaths and Marriages Registration Act, 1952, Section 73 of the Civil Registration Act 2004 and Government Order SI 831 of 2007.
Methodology
All figures in this report are classified by quarter of registration.
The extension of the Limerick City boundary, which came into operation on 1st March 2008, has been taken into account in the compilation of the statistics from the Second Quarter of 2008. As a result, data for Limerick City and County are not directly comparable with any quarter prior to the Second Quarter 2008.
This publication continues with the 3 major changes in the methods by which mortality statistics are compiled. These changes were introduced in the Vital Statistics First Quarter 2007 publication.
1) Underlying Cause of Death is classified according to International Classification of Diseases, Version 10 (ICD10) instead of to International Classification of Diseases, Version 9 (ICD9). In addition, this and future publications will incorporate certain official updates to ICD-10. In particular, mental and behavioral disorders due to psychoactive substance use (F10-F19), with mention of intestinal infectious diseases (A00-A09), accidental, intentional self and undetermined intent poisoning by and exposure to noxious substances (X40-X49, X60-X69, Y10-Y19) or assault by chemical or noxious substance (X85-X90), are now coded to the latter.
http://www.who.int/classifications/icd/OfficialWHOUpdatesCombined1996-2008VOLUME2.pdf
2) Deaths where there was not an inquest have been coded using the automated coding system developed by the U.S National Centre for Health Statistics (NCHS). Previously the Underlying Cause of Death was chosen manually for all deaths.
3) All deaths registered in the quarter have been included in the statistics, in some cases with a provisional cause of death. Previously the practice was not to include deaths in the quarterly statistics until the cause of death had been definitely established.
Because of these changes, caution should be taken in directly comparing these mortality statistics with those of previous quarters. Many countries have found that moving to ICD10 does affect certain specific categories of causes of death. In particular, a significant drop in the number of deaths attributed to pneumonia and bronchopneumonia has been observed in some countries after moving to ICD10. These deaths were instead assigned to other conditions included on the death certificate.
The effect of the second change above has been to increase the number of deaths in our statistics as compared with previous years. Statistics for deaths due to external causes are particularly affected by this change. The previous method meant that some deaths were included in a later quarter of the year, than when they had been registered, because of the delay involved in establishing a definite cause of death.
Revised rates This report contains revisions to previously published rates for Marriages, Births and Deaths with effect from the second quarter of 2006. This is due to revised population estimates and the change from using De Facto population data to Usual Residence population data. All rates for periods prior to the second quarter of 2006 remain unchanged. These revisions were first published in the Vital Statistics First Quarter 2012 report.
Revised figures This report contains upward revisions to previously published figures for births registered in quarter 3 of 2008, quarter 1 of 2009 and 2010, and also for the previously published numbers for deaths registered in quarter 1 of 2010 and 2011. The natural increase and totals for these years were also revised. These revisions were first published in the Vital Statistics Second Quarter 2011 report.
Stated Parity Refers to the number of previous live births excluding any not stated.
NUTS2 and NUTS3 Regional Authority areas
The regional classifications in this release are based on the NUTS (Nomenclature of Territorial Units) classification used by Eurostat. The NUTS3 regions correspond to the eight Regional Authorities established under the Local Government Act, 1991 (Regional Authorities) (Establishment) Order, 1993, which came into operation on 1 January 1994. The NUTS2 regions, which were proposed by Government and agreed by Eurostat in 1999, are groupings of the NUTS3 regions. The composition of the regions is set out below.
Border, Midland and Western NUTS2 Region Southern and Eastern NUTS2 Region
| Border | Cavan | Dublin | Dublin City | |
| Donegal | Dun Laoghaire-Rathdown | |||
| Leitrim | Fingal | |||
| Louth | South Dublin | |||
| Monaghan | ||||
| Sligo | Mid-East | Kildare | ||
| Meath | ||||
| Midland | Laois | Wicklow | ||
| Longford | ||||
| Offaly | Mid-West | Clare | ||
| Westmeath | Limerick City | |||
| Limerick County | ||||
| West | Galway City | North Tipperary | ||
| Galway County | ||||
| Mayo | South-East | Carlow | ||
| Roscommon | Kilkenny | |||
| South Tipperary | ||||
| Waterford City | ||||
| Waterford County | ||||
| Wexford | ||||
| South-West | Cork City | |||
| Cork County | ||||
| Kerry |
EU-28 countries
Austria, Belgium, Bulgaria, Croatia, Cyprus, Czech Republic, Denmark, Estonia, Finland, France, Germany, Greece, Hungary, Ireland, Italy, Latvia, Lithuania, Luxembourg, Malta, the Netherlands, Poland, Portugal, Romania, Slovakia, Slovenia, Spain, Sweden, United Kingdom.
Croatia is included in EU 15 to EU28 from quarter 3 2013
 Hide Background Notes
Scan the QR code below to view this release online or go to
http://www.cso.ie/en/releasesandpublications/ep/p-vs/vitalstatisticsfirstquarter2015/
 Show Table 1 Births classified by age of mother at maternity by quarter, 2009, 2013 and 2014 and their corresponding annual age specific (ASFR) and total period fertility rates (TPFR)
 Hide Table 1 Births classified by age of mother at maternity by quarter, 2009, 2013 and 2014 and their corresponding annual age specific (ASFR) and total period fertility rates (TPFR)