
Natural gas consumption decreased by 7% in 2023 compared with 2022 (See Table 1).
Gas consumption decreased in all sectors: power plants (-7%), non-residential (-5%), and residential (-10%) (See Table 1).
In 2023, 65% of networked gas consumption was from power plants, 24% was from non-residential meters, and 11% was from residential meters (See Figure 2 and Table 1).
Almost half (47%) of residential gas consumption in 2023 occurred during the first three months of the year (See Figure 2 and Table 2D).
The median household gas consumption was 7,544 kilowatt hours (kWh) in 2023, the lowest for the period 2014-2023 (See Table 5B).
By county, median household gas consumption was lowest in Waterford (6,016 kWh) and highest in Cavan (8,706 kWh) (See Figure 3 and Table 5B).
By Dublin postal district, median household gas consumption was lowest in Dublin 02 (4,796 kWh) and highest in Dublin 06W (9,201 kWh) (See Table 5C).
Figure 1 shows the relative proportion of consumption for residential (11%), non-residential (24%), and power plant (65%) sectors in 2023 (See Figure 1 and Table 1).
| Power Plants | Non-Residential | Residential | |
| 2023 | 34.063 | 12.531 | 5.981 |
There was a strong pattern of seasonal variation in residential gas consumption in 2023, with 47% occurring in Q1 (January-March) and 6% in Q3 (July-September) (See Figure 2 and Table 2D).
| Jan-Mar | Apr-Jun | Jul-Sep | Oct-Dec | |
| 2014 | 4.454 | 1.961 | 0.416 | 1.804 |
| 2015 | 4.522 | 2.151 | 0.557 | 1.86 |
| 2016 | 3.989 | 2.416 | 0.415 | 2.001 |
| 2017 | 3.992 | 1.989 | 0.483 | 2.036 |
| 2018 | 4.658 | 2.444 | 0.367 | 2.305 |
| 2019 | 3.773 | 2.301 | 0.501 | 2.357 |
| 2020 | 4.308 | 2.012 | 0.675 | 2.415 |
| 2021 | 4.548 | 2.329 | 0.485 | 1.878 |
| 2022 | 3.853 | 1.818 | 0.377 | 1.634 |
| 2023 | 3.403 | 1.509 | 0.314 | 1.64 |
In the residential sector, Dublin County (1,004 GWh) and Dublin Postal Districts (2,642 GWh) combined were 61% of total consumption. The corresponding proportion in the non-residential sector was 31% (See Table 3A).
By county, median household gas consumption was lowest in Waterford (6,016 kWh) and highest in Cavan (8,706 kWh) (See Figure 3 and Table 5B). The median household networked gas consumption was 7,544 kWh in 2023, representing an 11% decrease since 2022 (See Table 5B).
| X-axis label | Consumption |
|---|---|
| Dublin County | 8.264 |
| Cavan | 8.706 |
| Kildare | 8.033 |
| Meath | 8.225 |
| Dublin Postal Districts | 7.806 |
| Offaly | 7.543 |
| Carlow | 7.269 |
| Wicklow | 7.242 |
| Laois | 7.522 |
| Tipperary | 7.062 |
| Louth | 7.14 |
| Monaghan | 7.267 |
| Kilkenny | 6.922 |
| Westmeath | 7.006 |
| Limerick | 6.602 |
| Clare | 7.177 |
| Cork | 6.55 |
| Galway | 6.718 |
| Waterford | 6.016 |
| Mayo | 6.427 |
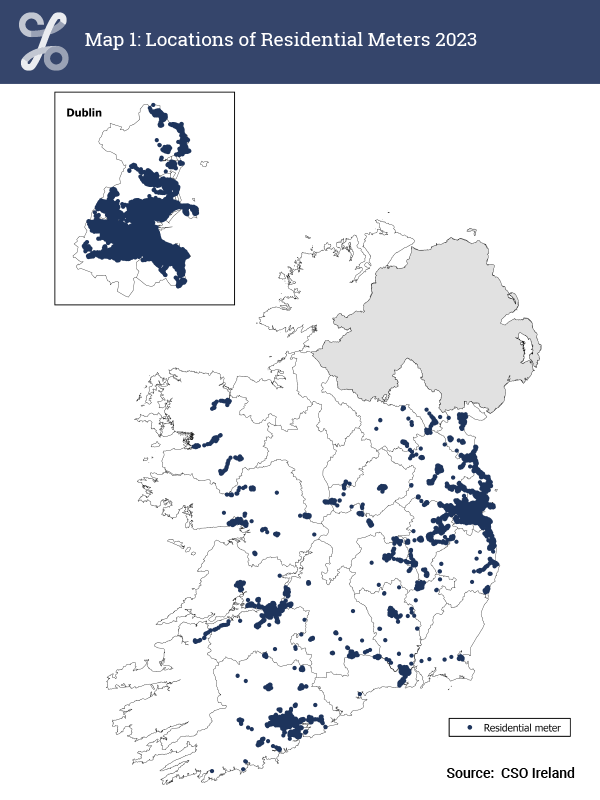
The locations of residential meters for 2023 is shown in Map 1. The largest concentration of residential meters were in Dublin Postal Districts (43%), Dublin County (15%), and Cork (12%) (See Map 1 and Table 6B).
Learn about our data and confidentiality safeguards, and the steps we take to produce statistics that can be trusted by all.
Statistician's Comment
The Central Statistics Office (CSO) has today (28 August 2024) released Networked Gas Consumption 2023.
Commenting on the release, Kevin Hunt, Statistician in the Climate and Energy Division said: "Natural gas consumption fell by 7% in 2023 compared with 2022, for a total of 52,575 Gigawatt hours (GWh) consumed across all sectors. This was the lowest total consumption figure since 2015 (See Table 1).
Networked Gas Consumption by Sector
Figure 1 shows the relative proportion of consumption for power plant (65%), non-residential (24%), and residential (11%) sectors in 2023. At 65%, the proportion of gas consumption by power plants in 2023 was the highest over the ten-year period 2014-2023 (See Figure 1 and Table 1).
Gas consumption by the residential sector decreased by 10% from 2022 to 2023 and by 23% from 2021 (See Table 1). Total residential gas consumption for 2023 was 5,981 GWh, the lowest figure seen over the period 2014-2023 (See Table 1).
Non-residential gas consumption decreased in 2023 by 5% compared with 2022 (See Table 1).
Gas usage by power plants to generate electricity decreased by 7% in 2023 compared with 2022 (See Table 1).
Networked Gas Consumption by Quarter
Figure 2 shows the strong pattern of seasonal variation in residential gas consumption. This is due to the use of gas for heating in colder months.
January to March contributed 47% of total residential consumption for 2023, compared with 6% in July to September (See Figure 2 and Table 2D).
Median networked gas consumption for the residential sector varied from 3,403 kWh in January to March 2023 to 314 kWh in July to September 2023 (See Table 5D).
Networked Gas Consumption by County and Dublin Postal District
In the residential sector, Dublin postal districts accounted for 44% of consumption in 2023, followed by Dublin County (17%) and Cork (11%) (See Table 3B). Counties Donegal, Sligo, and Leitrim are not connected to the gas network.
In the non-residential sector (excluding power plants), the highest contributing areas in 2023 were the Dublin Postal Districts (25%), Cork (22%), Kildare (7%), Dublin County (6%), Cavan (6%), and Limerick (6%) (See Table 3A).
Dublin 15 had the highest total residential consumption in 2023 among Dublin Postal Districts at 300 GWh (11%), followed by Dublin 24 with 182 GWh (7%). The lowest residential consumption levels in the Dublin postal districts were 24 GWh in Dublin 02 (1%) and 25 GWh in Dublin 01 (1%) (See Table 4B).
Networked Gas Consumption by Household
The median household networked gas consumption was 7,544 kWh in 2023. This was the lowest annual figure for the period 2014-2023. It represents an 11% decrease from the 2022 median of 8,449 kWh, which had previously been the lowest figure (See Table 5B).
Figure 3 shows the annual median residential consumption at county level. Figures for Kerry, Longford, Roscommon, and Wexford are based on low meter numbers (See Table 6B) and have been omitted from the graph. The lowest county by median residential consumption in 2023 was Waterford (6,016 kWh) and the highest was Cavan (8,706 kWh) (See Table 5B and Figure 3).
Among Dublin postal districts, the three lowest by median consumption in 2023 were Dublin 02 (4,796 kWh), Dublin 01 (4,880 kWh), and Dublin 08 (5,917 kWh). The three highest were Dublin 06W (9,201 kWh), Dublin 06 (9,008 kWh), and Dublin 05 (8,836 kWh) (See Table 5C).
Meter Numbers
The number of non-residential meters increased by 7% from 2014 to 2023, to a total of 29,903 in 2023 (See Table 6A). The number of residential meters increased by 8% between 2014 and 2023, to a total of 696,902 (See Table 6B). Dublin Postal District areas accounted for 42% of non-residential meters and 43% of residential meters in 2023 (See Tables 6A and 6B).
The locations of residential meters for 2023 are shown in Map 1. Residential meters are concentrated in large urban areas such as Dublin, Cork, and Limerick (See Map 1 and Table 6B)."