
This chapter presents distances to nine key transport services across multiple geographic levels, from State level down to Small Area. Because distributions of distance to transport services are highly skewed - with a minority of households and individuals located very far from certain services - the median is used as the primary measure throughout, as it provides a more reliable indication of typical access than the mean, which can be disproportionately influenced by extreme values.
Unless otherwise stated, the statistics in this chapter refer to households rather than individual persons. See Background Notes for more information on statistics provided.
Nationally, three in four households were located within 1.4 km of either a bus, rail, or LUAS stop (‘All Public Transport Stops’). The median distance to ‘All Public Transport Stops’ was 0.5 km, meaning that half of all households were located within 0.5 km of their nearest public transport stop, while half of all households were located further than 0.5 km. Distance to ‘Bus Stops’ specifically showed a very similar pattern, with half of all households located within 0.5 km and three in four households located within 1.4 km of their nearest stop.
High frequency public transport stops were defined as stops served more than 10 times between 6 am and 8 pm on a midweek day. LUAS services were classified as high frequency by default, as these trams typically run every 3-15 minutes in Dublin. In addition to the separate high frequency bus and rail service categories (‘High Frequency Bus Stops’ and ‘High Frequency Rail Stops’), a combined category, ‘All High Frequency Stops’ was created to represent any high frequency bus, rail and LUAS stops.
Nationally, the median distance to both ‘High Frequency Bus Stops’ and ‘All High Frequency Stops’ was 0.7 km. Three in four households were located within 4.0 km of ‘High Frequency Bus Stops’ and within 3.8 km of ‘All High Frequency Stops’. Rail services were less geographically accessible at State level. Half of all households were within 5.5 km of ‘Rail Stops’, while one quarter were located within 2.2 km and one quarter were more than 15.6 km away. Distances to ‘High Frequency Rail Stops’ were similar, with a median distance of 5.8 km and one in four households located more than 17.0 km away.
‘Fuel Stations’ were among the most accessible services measured, capturing retail outlets supplying fuel for motor vehicles. Three in four households were located within 2.9 km of their nearest fuel station, while half were within 1.4 km.
Public bike share systems are designed to provide an affordable and flexible mode of transport in urban areas, and are currently available in Dublin, Cork, Galway, Limerick and Waterford Cities (see Glossary of Terms for more information). This release looks only at bike-sharing systems that operate as docked networks, where bicycles are rented from and returned to fixed stations (‘Bike Share Stations excl. Dockless Bikes’). The median distance was 29.6 km, with one quarter of households located more than 67.3 km from the nearest station, which reflected the concentration of such bike share schemes in a small number of urban centres. Similarly, ‘LUAS Stops’ recorded the largest median distances nationally due to the location of these trams within Dublin only (97.7 km).
The distribution of households across distance bands provides further context for these findings. Details on specific distance bands are available in the Background Notes.
Nationally, households were generally located close to public transport services. Four in five households (80.0%) were located within 2.0 km of ‘Bus Stops’. This figure was calculated by summing the proportion of households in the distance bands 'Less than 500 metres' (47.6%), '500 metres - <1km' (20.6%) and '1 -< 2km' (11.8%) (see MDSI25). Similarly, 80.1% of households were located within 2.0 km of ‘All Public Transport Stops’. Very few households (0.4%) were located more than 10.0 km from a public transport stop.
High frequency stops were somewhat less accessible but remained within reasonable reach for the majority of households. Around four in ten (41.1%) households were located 'Less than 500 metres' from a public transport stop that was served more than 10 times within 6 am and 8 pm on a weekday. Approximately 1.0 % of households were located '20km or more' from one of these high frequency public transport stops.
Rail services were less accessible and more geographically concentrated than bus services. Approximately 1.9% of households were located 'Less than 500 metres' of ‘Rail Stops’, while the largest share (26.4%) were located between '2 -< 5km'. Almost one in five households (19.5%) were located '20km or more' from their nearest rail stop. A similar pattern was observed for ‘High Frequency Rail Stops’, with 21.4% of households located '20km or more' from their nearest service.
Additional data on proportion of households and individuals in regional and local distance bands can be found in the Data chapter of this release.
Administrative Counties correspond with Local Authority areas.
Roscommon County Council recorded the longest median distance to both ‘Bus Stops’ (2.1 km) and ‘High Frequency Bus Stops’ (7.2 km), while Leitrim County Council also recorded relatively large median distances to bus stops served more than 10 times during a midweek day (6.9 km). The difference in median distance to ‘Bus Stops’ compared with ‘High Frequency Bus Stops’ was particularly evident in Roscommon County Council (2.1 km vs. 7.2 km), Leitrim County Council (1.3 km vs. 6.9 km) and Mayo County Council (1.6 km vs. 5.1 km), indicating that while basic bus infrastructure was relatively widespread, frequent midweek services were less available in these areas.
Rail services were considerably more concentrated geographically. Donegal County Council recorded the longest median distance to ‘Rail Stops’ (111.0 km), followed by Monaghan County Council (42.8 km) and Cavan County Council (41.8 km). While rail infrastructure was lacking in Donegal County Council, half of all households were located within 1.2 km of their nearest bus stop and 3.1 km from a bus stop served more than 10 times on a midweek day.
Access to high frequency public transport services was generally lower in west and north-west Administrative Counties. Roscommon County Council (6.9 km), Leitrim County Council (6.1 km), Mayo County Council (4.4 km) and Cavan County Council (4.2 km) recorded the highest median distances to ‘All High Frequency Stops’ (i.e. bus, rail or LUAS). In Roscommon County Council and Leitrim County Council, one in four households were located more than 11.0 km and 10.4 km respectively from these stops.
‘Fuel Stations’ were among the most accessible service examined, although notable differences remained. Leitrim County Council recorded the highest median distance at 6.5 km, more than double the corresponding median in Roscommon County Council (3.2 km), the county with the second-highest value. One quarter of households in Leitrim were located more than 10.7 km from their nearest fuel station.
At County level, City Council and County Council areas are combined into a single geographic unit, in contrast to the Administrative County level where they are presented separately. As a result, distances by County are similar to that presented for Administrative Counties.
Dublin recorded the shortest median distances to most transport services. Half of all households in Dublin were within 0.3 km of both ‘Bus Stops’ and ‘High Frequency Bus Stops’, 2.6 km of both ‘Rail Stops’ and ‘High Frequency Rail Stops’ and 3.5 km of ‘LUAS Stops’. Roscommon recorded the longest median distances to ‘Bus Stops’ (2.1 km), 'All Public Transport Stops' (2.1 km), 'All High Frequency Stops' (6.9 km) and 'High Frequency Bus Stops' (7.2 km).
Donegal had the highest proportion of households located '20km or more' from ‘Rail Stops’ (100.0%), followed by Cavan (99.9%) and Monaghan (95.3%).
For the purposes of local authority elections, each County and City are divided into Local Electoral Areas (LEAs). For further information, see Census 2022 Small Area Population Statistics.
Amongst Dublin LEAs, Donaghmede (8.5 km), Lucan (7.6 km) and Artane-Whitehall (5.9 km) had the longest median distances to ‘LUAS Stops’.
Considerable variation in distance to transport services was evident at LEA level, specifically public transport. Belmullet, Co. Mayo had the longest median distance to both ‘All High Frequency Stops’ and ‘High Frequency Bus Stops’, at 24.1 km in each case. One quarter of households in Belmullet were located more than 32.6 km from their nearest frequently served bus stop. Other LEAs with relatively large median distances to frequently served bus stops included Kanturk, Co. Cork (18.4 km), Milford, Co. Donegal (17.5 km), Ballymahon, Co. Longford (13.6 km) and Ballymote-Tobercurry, Co. Sligo (11.8 km).
Castleisland, Co. Kerry recorded the highest median distance to both ‘Bus Stops’ and ‘All Public Transport Stops’, at 4.4 km, with one quarter of households located more than 7.8 km from the nearest stop. Athlone, Co. Roscommon and Loughrea, Co. Galway also recorded relatively high median distances of 3.3 km to ‘Bus Stops’.
The LEA of Ballinamore, Co. Leitrim recorded the longest median distance to ‘Fuel Stations’ at 6.9 km, followed by Manorhamilton, Co. Leitrim (6.1 km) and Conamara North, Co. Galway (6.0 km). Accessibility was particularly varied within the LEA of Carrick-on-Shannon, Co. Leitrim, where one quarter of households were located within 1.0 km of their nearest fuel station, while one quarter were located more than 12.2 km away.
Towns refer to a Built Up Area (BUA) with a population of at least 1,500.
Rail services were least accessible in a number of towns located away from the national rail network. Outside of Donegal, Skibbereen, Co. Cork (74.9 km), Clones, Co. Monaghan (63.7 km), Bantry, Co. Cork (57.4 km) and Cootehill, Co. Cavan (50.0 km) recorded some of the highest median distances to the national rail network among approximately 2,000 towns in Ireland. In each of these Towns, half of all households were located at least 50.0 km from the nearest Rail Stop.
Accessibility to ‘High Frequency Bus Stops’ was particularly limited in some Towns. In Portumna, Co. Galway, three quarters of households were located more than 23.9 km from a ‘High Frequency Bus Stop’.
Public bicycle sharing networks are now available in several urban settlements across Ireland, with ‘Bike Share Stations excluding Dockless Bikes’ located in Dublin City, Galway City, Limerick City, Waterford City and Cork City. Across these Built Up Areas (BUA) or Towns, the median distances to the nearest bike share station ranged from 1.0 km in Waterford City and suburbs to 5.6 km in Dublin City and suburbs.
Electoral Divisions (EDs) are the smallest legally defined administrative areas in the State. For Census 2022, the CSO published data for 3,420 Electoral Divisions.
This section uses the six-category urban and rural classification set out in Urban and Rural Life in Ireland, 2025.
Access to public transport generally decreased with increasing rurality. In 'Cities', the median distance to ‘All Public Transport Stops’ was 0.3 km, compared with 2.2 km in 'Rural areas with high urban influence' and 2.0 km in 'Highly rural / remote areas'. A similar pattern was observed for stops serving buses specifically. Median distances to ‘Bus Stops’ increased from 0.3 km in 'Cities' to 2.5 km in 'Rural areas with moderate urban influence', before falling slightly to 2.0 km in 'Highly rural / remote areas'. Households in 'Cities', 'Satellite urban towns' and 'Independent urban towns' all recorded median distances of 0.5 km. In contrast, one in four households in 'Rural areas with moderate urban influence' were located more than 4.4 km from 'Bus stops', compared with 0.5 km for households in 'Cities'.
The urban-rural divide was considerably more pronounced for ‘High Frequency Bus Stops’, defined as bus stops serviced more than ten times between 6 am and 8 pm on a midweek day. Median distances increased from 0.3 km in 'Cities' and 0.5 km in 'Satellite urban towns' to 4.7 km in 'Rural areas with high urban influence', 6.6 km in 'Rural areas with moderate urban influence' and 8.4 km in 'Highly rural / remote areas'. The median distance in 'Highly rural / remote areas' was twelve times the national median of 0.7 km, highlighting the more limited availability of frequent public transport services in rural locations.
‘Fuel Stations’ were more evenly distributed across the urban-rural continuum than the public transport services explored in this release. Nevertheless, households in 'Highly rural / remote areas' recorded a median distance of 4.7 km to their nearest fuel station, compared with 1.1 km for households in 'Cities'.
Small Areas were first published for Census 2011 following work undertaken by the National Institute of Regional and Spatial Analysis (NIRSA) on behalf of Ordnance Survey Ireland (now Tailte Éireann) and in consultation with the CSO. They are designed as the lowest level of geography for the compilation of statistics in line with data protection guidelines and typically contain between 50 and 200 dwellings. For further information see Census 2022 Small Area Population Statistics.
To view this interactive map please click on the image below. Please note due to the large amount of data, the map will take additional time to load. The data is available in PxStat Table MDSI01. Apologies for any inconvenience caused.
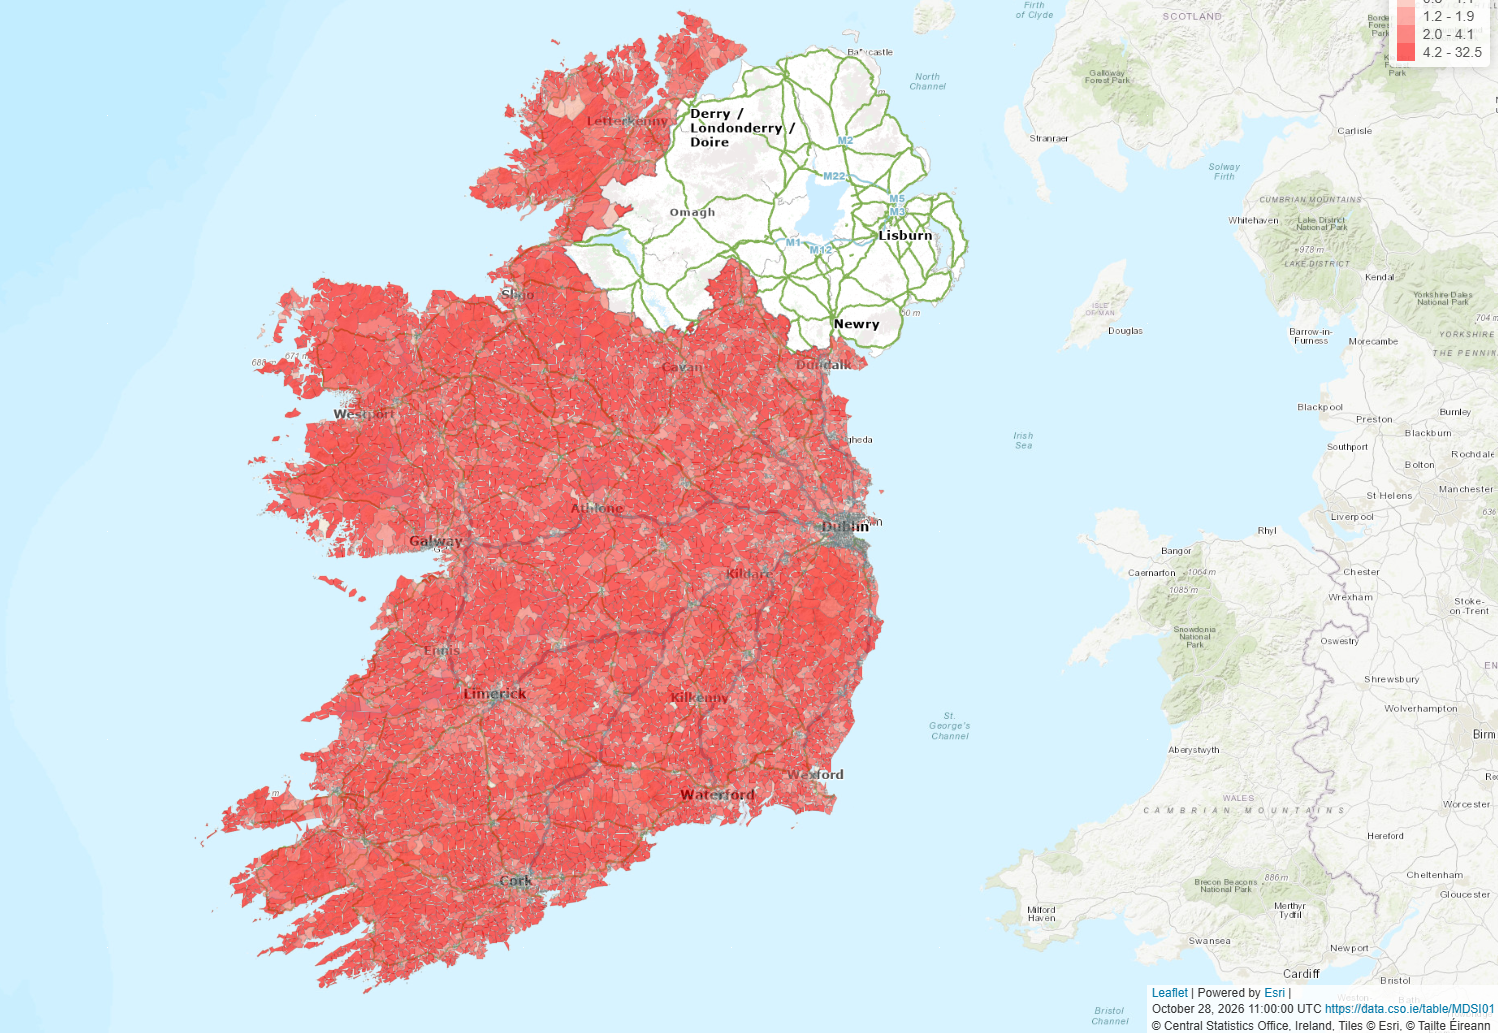
Median distances to transport services are also presented at 1 km grid level through an interactive map, providing a more detailed view of geographic accessibility across Ireland. The map allows users to explore how proximity to transport services varies within counties and regions, highlighting local patterns that may not be visible from larger administrative area statistics.
The grid is based on a standard 1 km × 1 km polygon grid, with median distances calculated and displayed for each grid cell. To ensure national coverage while avoiding the inclusion of areas outside the State, only grid cells that intersect the CSO National Statistical Boundaries 2022 are included in the map.
The source grid was originally produced in the ETRS89 Lambert Azimuthal Equal-Area (EPSG:3035) coordinate reference system and was subsequently reprojected to the Irish Transverse Mercator (ITM; EPSG:2157) coordinate system for use in this publication. This ensures consistency with other spatial datasets published by the CSO and supports accurate mapping and analysis within an Irish geographic context. By presenting results at a 1 km grid level, the interactive map complements the national, regional and county-level statistics available elsewhere in the release, allowing users to examine variations in accessibility at a much finer geographic scale.
Learn about our data and confidentiality safeguards, and the steps we take to produce statistics that can be trusted by all.