Your feedback can help us improve and enhance our services to the public. Tell us what matters to you in our online Customer Satisfaction Survey.
Multinationals play an important role in the economies of many countries. Increasingly, multinationals create a physical presence in several countries around the world in order to maximise their global earnings.
This chapter presents statistics on the activities of the affiliates of Irish multinationals abroad and the contribution made by the affiliates of Foreign multinationals in Ireland. See Tables 7.1, 7.2 and 7.3 at the end of this section for more detail on the data in the graphs.
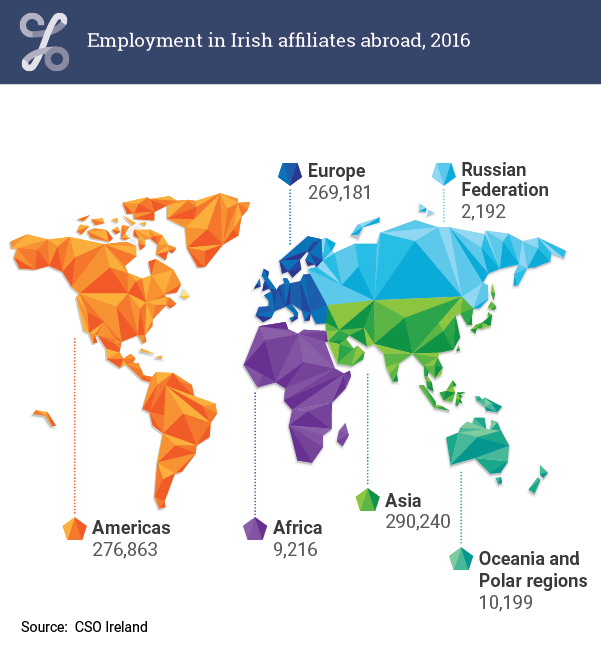
Figure 7.1 Employment in Irish affiliates abroad, 2016

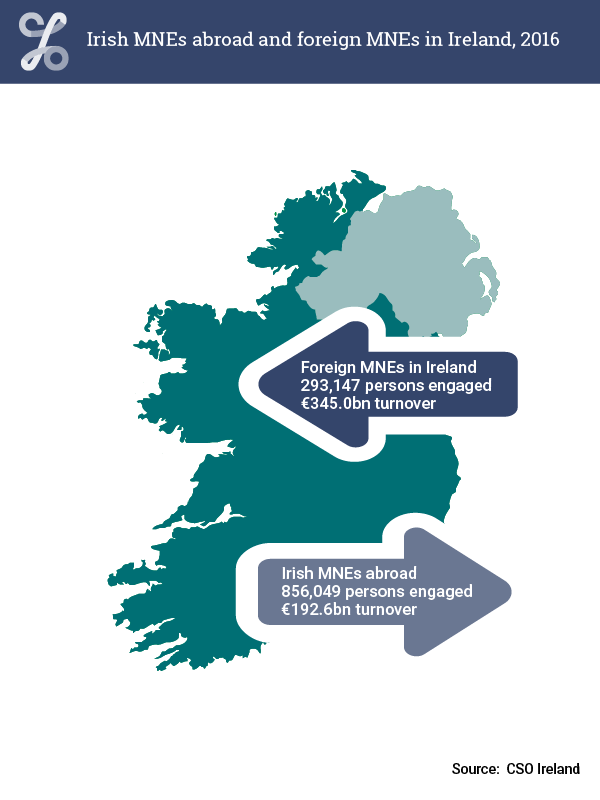
Figure 7.2 Irish MNEs abroad and foreign MNEs in Ireland, 2016

| For long labels below use to display on multiple lines | Turnover |
|---|---|
| United States | 37.1 |
| United Kingdom | 20.8 |
| France | 3.7 |
| Germany | 3.7 |
| Other countries | 34.6 |
| For long labels below use to display on multiple lines | Persons engaged |
|---|---|
| United States | 23.2 |
| United Kingdom | 12.4 |
| China | 3.4 |
| Germany | 2.8 |
| Other countries | 58.2 |
| 2016 | |
| United States | 198668 |
| United Kingdom | 106126 |
| China | 29198 |
| Germany | 24213 |
| France | 23488 |
| Spain | 17815 |
| Italy | 17673 |
| Netherlands | 16552 |
| Mexico | 15606 |
| Canada | 13540 |
| 2016 | |
| United States | 71.5 |
| United Kingdom | 40.1 |
| France | 7.2 |
| Germany | 7.1 |
| Netherlands | 6.4 |
| Poland | 4 |
| Canada | 3.8 |
| Italy | 3.4 |
| Spain | 3.2 |
| Belgium | 2.4 |
| For long labels below use to display on multiple lines | Persons engaged |
|---|---|
| Manufacturing | 15.2 |
| Other industrial | 0.5 |
| Construction | 0.1 |
| Services | 84.2 |
| For long labels below use to display on multiple lines | Turnover |
|---|---|
| Manufacturing | 15.3 |
| Other industrial | 2 |
| Construction | 0.3 |
| Services | 82.4 |
| Turnover | |
| Services | 46.5 |
| Distribution | 35.9 |
| Manufacturing | 15.3 |
| Other Industrial | 2 |
| Construction | 0.3 |
| Services | Manufacturing | |
| Irish | 74.8 | 24.8 |
| British | 38.1 | 40.5 |
| French | 51.8 | 36.8 |
| German | 57.4 | 41.3 |
| Italian | 29.2 | 57.3 |
| 0 | 0 | |
| EU-28 | 50.7 | 41 |
The Financial and Insurance sector is excluded from this section. Accordingly, all the measures below relate to the non-financial business economy only (which encompasses the broad sectors of Industry, Services, Distribution and Construction).
| 2015 | 2016 | |
| Number of enterprises | 1.3 | 1.1 |
| Persons engaged | 22.2 | 20.3 |
| Turnover | 56.4 | 53.5 |
| GVA | 63.3 | 58.8 |
| 2015 | 2016 | |
| Number of enterprises | 3.9 | 2.8 |
| Persons engaged | 41.7 | 35.8 |
| Turnover | 86 | 82 |
| GVA | 89.2 | 85.3 |
| 2015 | 2016 | |
| Number of enterprises | 1.8 | 1.7 |
| Persons engaged | 24.5 | 23.4 |
| Turnover | 32.8 | 29.8 |
| GVA | 36.4 | 33.4 |
| 2015 | 2016 | |
| Number of enterprises | 1.3 | 1 |
| Persons engaged | 18.1 | 16.6 |
| Turnover | 43.2 | 47.7 |
| GVA | 38.9 | 36.9 |
| Gross Value Added | |
| Ireland | 58.7 |
| Hungary | 52.5 |
| Luxembourg | 47.6 |
| Slovakia | 45.8 |
| Romania | 43.9 |
| Czech Republic | 41.8 |
| Latvia | 33.5 |
| Bulgaria | 32.7 |
| Poland | 29.9 |
| United Kingdom | 29.6 |
| Lithuania | 28.2 |
| Netherlands | 28.1 |
| Sweden | 27.5 |
| Belgium | 27.1 |
| Austria | 26.9 |
| Estonia | 26.4 |
| Slovenia | 26.3 |
| Croatia | 25.3 |
| EU28 | 24.5 |
| Portugal | 24 |
| Malta | 22.3 |
| Spain | 21.9 |
| Denmark | 21.5 |
| Finland | 21.1 |
| Germany | 20.1 |
| France | 16.41 |
| Italy | 15.2 |
| Greece | 13.7 |
| Cyprus | 12.8 |
Go to next chapter >>> Financial Sector
Learn about our data and confidentiality safeguards, and the steps we take to produce statistics that can be trusted by all.