
| 4.15 Numbers of farms, 1915 and 2010 | |||
| 1915 | 2010 | % change in farm numbers | |
| State | 359,700 | 139,860 | -61.1 |
| Leinster | 88,100 | 34,814 | -60.5 |
| Carlow | 3,900 | 1,802 | -53.8 |
| Dublin | 4,800 | 798 | -83.4 |
| Kildare | 6,100 | 2,578 | -57.7 |
| Kilkenny | 9,400 | 3,737 | -60.2 |
| Laois | 7,800 | 3,312 | -57.5 |
| Longford | 7,400 | 2,601 | -64.9 |
| Louth | 5,900 | 1,676 | -71.6 |
| Meath | 9,100 | 4,569 | -49.8 |
| Offaly | 7,900 | 3,462 | -56.2 |
| Westmeath | 8,600 | 3,459 | -59.8 |
| Wexford | 11,500 | 4,426 | -61.5 |
| Wicklow | 5,700 | 2,394 | -58.0 |
| Munster | 101,700 | 45,675 | -55.1 |
| Clare | 15,700 | 6,550 | -58.3 |
| Cork | 29,600 | 14,222 | -52.0 |
| Kerry | 18,800 | 8,412 | -55.3 |
| Limerick | 13,100 | 5,991 | -54.3 |
| Tipperary | 18,000 | 7,739 | -57.0 |
| Waterford | 6,500 | 2,761 | -57.5 |
| Connaught | 109,000 | 40,284 | -63.0 |
| Galway | 31,000 | 13,445 | -56.6 |
| Leitrim | 12,700 | 3,673 | -71.1 |
| Mayo | 33,100 | 12,458 | -62.4 |
| Roscommon | 18,700 | 6,313 | -66.2 |
| Sligo | 13,500 | 4,395 | -67.4 |
| Ulster (part) | 60,900 | 19,087 | -68.7 |
| Cavan | 17,900 | 5,282 | -70.5 |
| Donegal | 29,000 | 9,240 | -68.1 |
| Monaghan | 14,000 | 4,565 | -67.4 |
| Source: Farming since the Famine CSO, Census of Agriculture CSO | |||
| 1915 | 2010 | |
| Carlow | 3900 | 1802 |
| Dublin | 4800 | 798 |
| Kildare | 6100 | 2578 |
| Kilkenny | 9400 | 3737 |
| Laois | 7800 | 3312 |
| Longford | 7400 | 2601 |
| Louth | 5900 | 1676 |
| Meath | 9100 | 4569 |
| Offaly | 7900 | 3462 |
| Westmeath | 8600 | 3459 |
| Wexford | 11500 | 4426 |
| Wicklow | 5700 | 2394 |
| Clare | 15700 | 6550 |
| Cork | 29600 | 14222 |
| Kerry | 18800 | 8412 |
| Limerick | 13100 | 5991 |
| Tipperary | 18000 | 7739 |
| Waterford | 6500 | 2761 |
| Galway | 31000 | 13445 |
| Leitrim | 12700 | 3673 |
| Mayo | 33100 | 12458 |
| Roscommon | 18700 | 6313 |
| Sligo | 13500 | 4395 |
| Cavan | 17900 | 5282 |
| Donegal | 29000 | 9240 |
| Monaghan | 14000 | 4565 |
| 4.16 Area in Agricultural use and size of farms, 1915 and 2010 | ||||||
| '000 hectares | hectares | |||||
| Agricultural area used | Average Farm Size | |||||
| 1915 | 2010 | % change | 1915 | 2010 | % change | |
| State | 4,932 | 4,569 | -7 | 14 | 33 | 138 |
| Leinster | 1,615 | 1,373 | -15 | 18 | 39 | 115 |
| Carlow | 78 | 71 | -9 | 20 | 39 | 96 |
| Dublin | 76 | 38 | -50 | 16 | 48 | 201 |
| Kildare | 146 | 114 | -22 | 24 | 44 | 84 |
| Kilkenny | 183 | 165 | -10 | 19 | 44 | 127 |
| Laois | 141 | 123 | -13 | 18 | 37 | 105 |
| Longford | 84 | 73 | -13 | 11 | 28 | 147 |
| Louth | 69 | 61 | -12 | 12 | 36 | 211 |
| Meath | 216 | 192 | -11 | 24 | 42 | 77 |
| Offaly | 139 | 126 | -9 | 18 | 37 | 107 |
| Westmeath | 150 | 128 | -14 | 17 | 37 | 113 |
| Wexford | 208 | 182 | -12 | 18 | 41 | 128 |
| Wicklow | 124 | 101 | -18 | 22 | 42 | 94 |
| Munster | 1,798 | 1,687 | -6 | 18 | 37 | 109 |
| Clare | 241 | 213 | -11 | 15 | 33 | 112 |
| Cork | 565 | 541 | -4 | 19 | 38 | 100 |
| Kerry | 276 | 286 | 4 | 15 | 34 | 132 |
| Limerick | 238 | 207 | -13 | 18 | 35 | 90 |
| Tipperary | 347 | 313 | -10 | 19 | 40 | 110 |
| Waterford | 132 | 126 | -5 | 20 | 46 | 125 |
| Connacht | 1,042 | 1,005 | -4 | 10 | 25 | 161 |
| Galway | 350 | 347 | -1 | 11 | 26 | 129 |
| Leitrim | 112 | 92 | -18 | 9 | 25 | 185 |
| Mayo | 261 | 279 | 7 | 8 | 22 | 184 |
| Roscommon | 194 | 171 | -12 | 10 | 27 | 161 |
| Sligo | 126 | 115 | -8 | 9 | 26 | 182 |
| Ulster (part of) | 477 | 504 | 6 | 8 | 26 | 237 |
| Cavan | 158 | 139 | -12 | 9 | 26 | 199 |
| Donegal | 206 | 258 | 25 | 7 | 28 | 293 |
| Monaghan | 113 | 106 | -6 | 8 | 23 | 189 |
| Source: Farming since the Famine CSO, Census of Agriculture CSO | ||||||
| 4.17 Agricultural land use in Ireland, 1916 and 2010 | ||
| 000 hectares | ||
| 1916 | 2010 | |
| Grassland | 4,227 | 4,215 |
| Potatoes | 172 | 12 |
| Barley | 60 | 175 |
| Wheat | 26 | 78 |
| Oats | 294 | 20 |
| Other crops | 138 | 69 |
| Total | 4,917 | 4,569 |
| Source: Farming since the Famine CSO, Census of Agriculture CSO | ||
| 1916 | 2010 | |
| Other crops | 138000 | 69399 |
| Oats | 294000 | 19707 |
| Wheat | 26000 | 77824 |
| Barley | 60000 | 174800 |
| Potatoes | 172000 | 12198 |
| 4.18 Areas and yields of selected crops, 1916 and 2014 | ||||||
| Crop | 1916 | 2014 | ||||
| Area (Hectares) | Yield (tons) | Yield (tons per hectare) | Area (Hectares) | Yield (tons) | Yield (tons per hectare) | |
| Wheat | 26,000 | 76,961 | 3 | 71,600 | 717,000 | 10 |
| Oats | 294,000 | 905,317 | 3 | 18,600 | 150,000 | 8 |
| Barley | 60,000 | 142,374 | 2 | 216,000 | 1,731,000 | 8 |
| Potatoes | 172,000 | 2,443,346 | 14 | 9,500 | 383,000 | 41 |
| Source: Agriculture Statistics Ireland 1916, Farming since the Famine CSO, Area, yield and production of Crops CSO | ||||||
| 4.19 Tenancy of Farms, 1916 and 2010 | |||||||||
| 1916 | 2010 | ||||||||
| Total Holdings (including those of less than 1 acre) | Tenanted Holdings | Tenanted Holdings as a % of Total Holdings | Total Farms | Farms with some land rented | Farms where all land is rented | % of farms with some land rented | % of farms where all land is rented | ||
| State | 443,695 | 157,470 | 35.5 | 139,860 | 41,440 | 4,811 | 29.6 | 3.4 | |
| Leinster | 124,866 | 56,806 | 45.5 | 34,814 | 12,123 | 1,519 | 34.8 | 4.4 | |
| Carlow | 6,147 | 4,313 | 70.2 | 1,802 | 649 | 93 | 36.0 | 5.2 | |
| Dublin | 10,087 | 7,098 | 70.4 | 798 | 327 | 55 | 41.0 | 6.9 | |
| Kildare | 8,725 | 3,996 | 45.8 | 2,578 | 817 | 131 | 31.7 | 5.1 | |
| Kilkenny | 12,488 | 3,894 | 31.2 | 3,737 | 1,380 | 118 | 36.9 | 3.2 | |
| Laois | 10,297 | 5,900 | 57.3 | 3,312 | 1,039 | 112 | 31.4 | 3.4 | |
| Longford | 8,954 | 1,817 | 20.3 | 2,601 | 760 | 83 | 29.2 | 3.2 | |
| Louth | 8,775 | 4,531 | 51.6 | 1,676 | 686 | 86 | 40.9 | 5.1 | |
| Meath | 13,324 | 6,136 | 46.1 | 4,569 | 1,684 | 220 | 36.9 | 4.8 | |
| Offaly | 10,384 | 4,684 | 45.1 | 3,462 | 1,084 | 137 | 31.3 | 4.0 | |
| Westmeath | 11,891 | 3,988 | 33.5 | 3,459 | 1,133 | 131 | 32.8 | 3.8 | |
| Wexford | 15,612 | 6,150 | 39.4 | 4,426 | 1,706 | 223 | 38.5 | 5.0 | |
| Wicklow | 8,182 | 4,299 | 52.5 | 2,394 | 858 | 130 | 35.8 | 5.4 | |
| Munster | 134,237 | 50,476 | 37.6 | 45,675 | 14,067 | 1,713 | 30.8 | 3.8 | |
| Clare | 18,024 | 8,035 | 44.6 | 6,550 | 1,467 | 138 | 22.4 | 2.1 | |
| Cork | 41,070 | 16,239 | 39.5 | 14,222 | 4,701 | 547 | 33.1 | 3.8 | |
| Kerry | 22,625 | 5,043 | 22.3 | 8,412 | 2,238 | 291 | 26.6 | 3.5 | |
| Limerick | 19,284 | 6,860 | 35.6 | 5,991 | 1,996 | 262 | 33.3 | 4.4 | |
| Tipperary | 23,045 | 8,703 | 37.8 | 7,739 | 2,703 | 331 | 34.9 | 4.3 | |
| Waterford | 10,189 | 5,596 | 54.9 | 2,761 | 962 | 144 | 34.8 | 5.2 | |
| Connacht | 117,657 | 26,642 | 22.6 | 40,284 | 9,622 | 825 | 23.9 | 2.0 | |
| Galway | 33,265 | 10,165 | 30.6 | 13,445 | 3,059 | 267 | 22.8 | 2.0 | |
| Leitrim | 13,670 | 1,769 | 12.9 | 3,673 | 982 | 90 | 26.7 | 2.5 | |
| Mayo | 35,633 | 7,725 | 21.7 | 12,458 | 2,649 | 238 | 21.3 | 1.9 | |
| Roscommon | 20,304 | 4,090 | 20.1 | 6,313 | 1,722 | 122 | 27.3 | 1.9 | |
| Sligo | 14,785 | 2,893 | 19.6 | 4,395 | 1,210 | 108 | 27.5 | 2.5 | |
| Ulster (part of) | 66,935 | 23,546 | 35.2 | 19,087 | 5,628 | 754 | 29.5 | 4.0 | |
| Cavan | 19,698 | 5,565 | 28.3 | 5,282 | 1,580 | 140 | 29.9 | 2.7 | |
| Donegal | 32,007 | 14,565 | 45.5 | 9,240 | 2,532 | 467 | 27.4 | 5.1 | |
| Monaghan | 15,230 | 3,416 | 22.4 | 4,565 | 1,516 | 147 | 33.2 | 3.2 | |
| Source: Agricultural Statistics of Ireland 1916, Census of Agriculture CSO | |||||||||
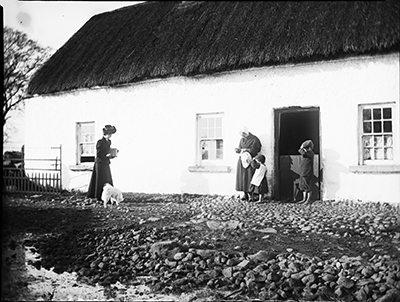
Photo: Edith Dillon carrying a box camera, approaching woman and 2 children standing outside thatched cottage
| 4.20 Number of cattle in Ireland, 1916 and 2010 | ||||||
| 1916 | 2010 | % change | ||||
| Dairy cows | Total cattle | Dairy cows | Total cattle | Dairy cows | Total cattle | |
| State | 1,235,231 | 4,166,907 | 1,070,755 | 6,606,585 | -13.3 | 58.5 |
| Leinster | 233,411 | 1,261,885 | 282,201 | 2,083,215 | 20.9 | 65.1 |
| Carlow | 11,368 | 53,266 | 10,616 | 93,795 | -6.6 | 76.1 |
| Dublin | 16,012 | 70,697 | 2,745 | 23,555 | -82.9 | -66.7 |
| Kildare | 12,535 | 107,291 | 11,444 | 124,962 | -8.7 | 16.5 |
| Kilkenny | 42,480 | 153,984 | 58,725 | 321,177 | 38.2 | 108.6 |
| Laois | 21,153 | 95,063 | 27,536 | 223,965 | 30.2 | 135.6 |
| Longford | 15,931 | 69,948 | 7,307 | 114,923 | -54.1 | 64.3 |
| Louth | 10,156 | 51,156 | 11,935 | 80,919 | 17.5 | 58.2 |
| Meath | 16,500 | 220,561 | 44,267 | 295,557 | 168.3 | 34.0 |
| Offaly | 16,827 | 93,060 | 20,527 | 222,486 | 22.0 | 139.1 |
| Westmeath | 15,368 | 127,715 | 17,763 | 206,745 | 15.6 | 61.9 |
| Wexford | 35,477 | 141,902 | 51,800 | 256,174 | 46.0 | 80.5 |
| Wicklow | 19,604 | 77,242 | 17,536 | 118,957 | -10.5 | 54.0 |
| Munster | 636,455 | 1,706,939 | 657,843 | 2,820,506 | 3.4 | 65.2 |
| Clare | 61,201 | 202,898 | 25,409 | 276,947 | -58.5 | 36.5 |
| Cork | 204,185 | 502,544 | 284,050 | 990,603 | 39.1 | 97.1 |
| Kerry | 120,725 | 283,569 | 84,444 | 323,957 | -30.1 | 14.2 |
| Limerick | 112,614 | 262,479 | 94,066 | 388,129 | -16.5 | 47.9 |
| Tipperary | 97,365 | 332,991 | 113,339 | 599,079 | 16.4 | 79.9 |
| Waterford | 40,365 | 122,458 | 56,535 | 241,791 | 40.1 | 97.4 |
| Connacht | 221,709 | 793,855 | 54,356 | 1,092,612 | -75.5 | 37.6 |
| Galway | 50,943 | 215,189 | 24,928 | 420,205 | -51.1 | 95.3 |
| Leitrim | 37,375 | 100,240 | 1,860 | 68,795 | -95.0 | -31.4 |
| Mayo | 63,873 | 217,060 | 15,243 | 281,150 | -76.1 | 29.5 |
| Roscommon | 36,388 | 150,953 | 4,891 | 206,648 | -86.6 | 36.9 |
| Sligo | 33,130 | 110,413 | 7,434 | 115,814 | -77.6 | 4.9 |
| Ulster (part of) | 143,656 | 404,228 | 76,355 | 610,252 | -46.8 | 51.0 |
| Cavan | 47,414 | 131,067 | 30,638 | 219,463 | -35.4 | 67.4 |
| Donegal | 64,318 | 180,294 | 15,456 | 191,288 | -76.0 | 6.1 |
| Monaghan | 31,924 | 92,867 | 30,261 | 199,501 | -5.2 | 114.8 |
| Source:Agricultural Statistics of Ireland 1916, Census of Agriculture CSO | ||||||
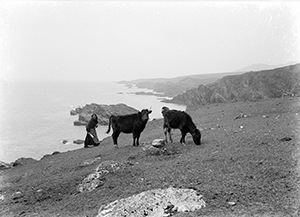
Photo: Irish woman driving cattle, Achill Island, Co. Mayo
| 4.21 Number of sheep in Ireland, 1916 and 2010 | |||
| County | 1916 | 2010 | % change |
| State | 3,354,867 | 4,745,424 | 41.4 |
| Leinster | 1,259,190 | 1,513,218 | 20.2 |
| Carlow | 95,131 | 154,888 | 62.8 |
| Dublin | 64,387 | 38,052 | -40.9 |
| Kildare | 126,724 | 142,881 | 12.7 |
| Kilkenny | 95,720 | 108,406 | 13.3 |
| Laois | 49,909 | 56,916 | 14.0 |
| Longford | 25,847 | 38,782 | 50.0 |
| Louth | 41,036 | 67,000 | 63.3 |
| Meath | 199,585 | 194,747 | -2.4 |
| Offaly | 69,624 | 91,189 | 31.0 |
| Westmeath | 109,347 | 116,809 | 6.8 |
| Wexford | 171,907 | 185,570 | 7.9 |
| Wicklow | 209,973 | 317,978 | 51.4 |
| Munster | 727,899 | 1,002,569 | 37.7 |
| Clare | 104,123 | 28,405 | -72.7 |
| Cork | 231,867 | 247,766 | 6.9 |
| Kerry | 113,710 | 433,546 | 281.3 |
| Limerick | 32,199 | 25,478 | -20.9 |
| Tipperary | 185,097 | 171,095 | -7.6 |
| Waterford | 60,903 | 96,279 | 58.1 |
| Connacht | 1,172,518 | 1,541,315 | 31.5 |
| Galway | 626,544 | 530,267 | -15.4 |
| Leitrim | 17,275 | 121,793 | 605.0 |
| Mayo | 296,355 | 490,076 | 65.4 |
| Roscommon | 164,831 | 242,593 | 47.2 |
| Sligo | 67,513 | 156,586 | 131.9 |
| Ulster (part of) | 195,260 | 688,322 | 252.5 |
| Cavan | 18,916 | 67,237 | 255.5 |
| Donegal | 163,196 | 576,463 | 253.2 |
| Monaghan | 13,148 | 44,622 | 239.4 |
| Source: Agricultural Statistics of Ireland 1916, Census of Agriculture CSO | |||
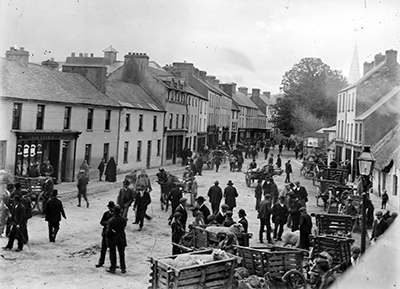
Photo: Busy market day in an unknown provincial town, 1900-1920
|
Note: An error in the number of sheep in Munster was corrected on 5 November 2018. |
| 4.22 Seasonal migrant agricultural workers in Ireland, 1914 | |||||
| County | Population in 1911 | Seasonal Migrants 1914 | |||
| State | 3,139,668 | 7,246 | |||
| Leinster | 1,162,024 | 23 | |||
| Carlow | 36,252 | 0 | |||
| Dublin | 477,196 | 0 | |||
| Kildare | 66,627 | 1 | |||
| Kilkenny | 74,952 | 8 | |||
| Offaly | 56,832 | 1 | |||
| Longford | 43,820 | 0 | |||
| Louth | 63,655 | 13 | |||
| Meath | 65,091 | 0 | |||
| Laois | 54,629 | 0 | |||
| Westmeath | 59,986 | 0 | |||
| Wexford | 102,273 | 0 | |||
| Wicklow | 60,711 | 0 | |||
| Munster | 1,035,495 | 145 | |||
| Clare | 104,232 | 2 | |||
| Cork | 392,104 | 12 | |||
| Kerry | 159,691 | 90 | |||
| Limerick | 143,069 | 0 | |||
| Tipperary | 152,433 | 40 | |||
| Waterford | 83,966 | 1 | |||
| Connacht | 610,984 | 5,438 | |||
| Galway | 182,224 | 490 | |||
| Leitrim | 63,582 | 17 | |||
| Mayo | 192,177 | 4,282 | |||
| Roscommon | 93,956 | 417 | |||
| Sligo | 79,045 | 232 | |||
| Ulster (part of) | 331,165 | 1,640 | |||
| Cavan | 91,173 | 0 | |||
| Donegal | 168,537 | 1,640 | |||
| Monaghan | 71,455 | 0 | |||
| Source: Agricultural statistics of Ireland 1914 | |||||
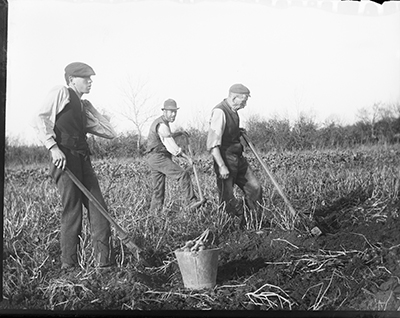
Photo: 3 men digging potatoes in a field
Go to next chapter >>> Transport
Learn about our data and confidentiality safeguards, and the steps we take to produce statistics that can be trusted by all.