
| GVA at constant (2018) basic prices for sectors dominated by Foreign-owned MNEs and Other Sectors - seasonally adjusted1 | ||
| Q3 2020 | ||
| Amount €m | Quarterly % change | |
| Foreign-owned MNE dominated | 43,993 | 8.2 |
| Other | 41,785 | 16.0 |
| Total GVA (MNE dominated + Other) | 85,778 | 11.9 |
| 1 Seasonally Adjusted data are non-additive, see Background Notes for further details | ||
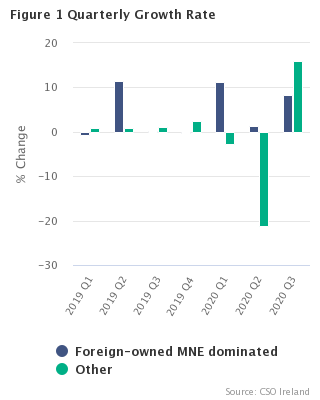
On a seasonally adjusted basis, initial estimates indicate that Gross Value Added (GVA) in volume terms for the non-MNE dominated sectors of the economy increased by 16.0% for the third quarter of 2020. GVA in the Foreign-owned MNE dominated sector grew by 8.2% over the same period.
Real GVA for the total economy was almost €86 billion in the Q3 2020 reference period, an increase of 11.9% on the previous period, with GVA for MNE dominated sectors representing approximately 51.3% of Total GVA while GVA for the non-MNE dominated sectors represented approximately 48.7% of the total.
The share of total GVA at constant prices accounted for by the foreign-owned MNE dominated sectors stood at 43.4% in 2019, an increase from 42.8% in 2018.
|
The calculation methods for quarterly Gross Value Added (GVA) for Foreign-owned Multinational Enterprises and Other sectors are similar to those used in the CSO’s annual GVA for Foreign-owned Multinational Enterprises and Other Sectors release. As some of the sources available quarterly are of lesser reliability than those used for the annual accounts, the quarterly estimates are subject to a greater margin of error than the equivalent annual figures. These preliminary quarterly estimates will therefore be revised when the next detailed annual results are published. Data for the reference quarters contained in the tables of this release as well as data for earlier reference quarters can be downloaded from the PxStat database service on the CSO Website. For annual data for years 1995-2019 at the more detailed 37 sectoral breakdown level, please refer to Tables 21 and 22 of the National Income & Expenditure 2019 publication issued in August 2020 (For long time series of these annual data see PxStat Tables N1921 &N1922). For information on chain linking see NIE 2019 Methodology Note. |