
| Indicator | Q1 11 | Q1 12 | Q1 13 | Q1 14 | Q1 15 | Q1 16 | Q1 17 | Change Q1 16 to Q1 17 |
| Total Employed | 1,841,800 | 1,825,000 | 1,845,600 | 1,888,200 | 1,929,500 | 1,976,500 | 2,045,100 | + 68,600 |
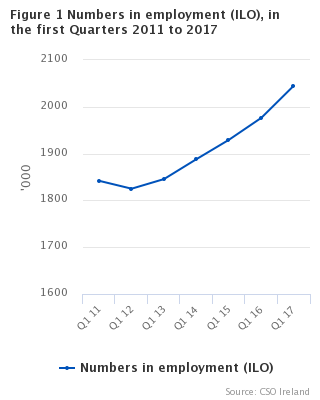
In Q1 2017, the number of persons in employment was 2,045,100, and this represented an increase of 68,600 (+3.5%) since Q1 2016. Full-time employment increased by 84,200 (+5.5%) to 1,604,500 during the same period and accounted for 78.5% of total employment in Q1 2017. On the other hand, part-time employment fell by 15,600 (-3.4%) to 440,600 and accounted for 21.5% of total employment. See Tables 1 and 6.
The number of persons in employment has increased by 203,300 (+11.0%) between Q1 2011 and Q1 2017. Full-time employment (+202,700) accounted for virtually all of this increase while there was a very slight increase in part-time employment. See Table 1.
Employment Status
The total number of persons classified as self-employed increased by 18,000 (+6.1%) to 312,300 between Q1 2011 and Q1 2017. The number of employees increased by 12.1% from 1,535,900 to 1,721,200 over the same period. See Table 4.
While there was an increase in the number of employees in most economic sectors over this period, the most notable increases were in the Accommodation and food service activities (+43,400 or 45.4%) and Construction (+30,600 or 45.9%) economic sectors. By contrast, the number of self employed persons fell in a number of economic sectors with the greater decrease occuring in the Wholesale and retail trade; repair of motor vehicles and motorcycles sector (-7,500). See Table 4.
The Skilled trades and Professional occupational groups, rising by 45,700 and 30,400 respectively, showed the largest increase in the number of employees over the period. The greater increases in self-employed were recorded in the Skilled trades and Managers, directors and senior officials groups with increases of 14,100 and 10,500 respectively. See Table 5.