
| Indicator | Q1 10 | Q1 11 | Q1 12 | Q1 13 | Q1 14 | Q1 15 | Q1 16 | Change Q1 15 to Q1 16 |
| Total Employed | 1,891,900 | 1,841,800 | 1,825,000 | 1,845,600 | 1,888,200 | 1,929,500 | 1,976,500 | + 46,900 |
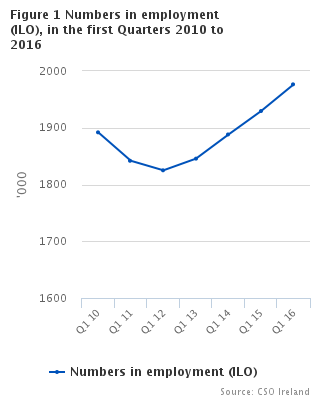
The number of persons in employment was 1,976,500 in Q1 2016, an increase of 46,900 (+2.4%) over the year.
Between Q1 2010 and Q1 2016 the number in employment increased by 84,600 (+4.5%). The number employed in Q1 decreased on an annual basis each year from Q1 2010 to Q1 2012, before showing an increase of 20,500 (+1.1%) in the year to Q1 2013 when it stood at 1,845,600. Annual increases in employment were also recorded in the year to Q1 2014 (+42,700 or +2.3%) and in the year to Q1 2015 (+41,300 or +2.2%). See Tables 1, 2 and 3.
Employment Status
The total number of persons classified as self-employed increased by 5.5% from 308,500 in Q1 2010 to 325,500 in Q1 2016. The number of employees increased from 1,569,200 to 1,636,400 (+67,200 or +4.3%) during this time. See Table 4.
The number of employees in the Human health and social work activities sector increased by 14,700 (+6.7%) from Q1 2010 to Q1 2016, increasing from 219,900 to 234,600.Total employment in this sector increased from 234,600 in Q1 2010 to 248,700 in Q1 2016. See Table 4.
The number of self-employed persons in the Skilled trades occupational group increased by 11,400 (+9.2%) between Q1 2010 and Q1 2016. Total employment in this group increased by 7.1% to 318,100 persons in Q1 2016. The largest rate of increase of employment in an occupational group during this period was recorded in the Managers, directors and senior officials group where the number of persons employed increased by 21,600 (+15.2%) from 142,500 in Q1 2010 to 164,100 in Q1 2016. See Table 5 and Figure 2.
| Broad Occupational Group | Self Employed | Employees |
|---|---|---|
| 1 | 58700 | 104600 |
| 2 | 40000 | 316700 |
| 3 | 33400 | 198800 |
| 4 | 6000 | 199000 |
| 5 | 135900 | 177900 |
| 6 | 12800 | 144600 |
| 7 | 5900 | 153800 |
| 8 | 25600 | 123700 |
| 9 | 6300 | 200900 |
| 10 | 0 | 16400 |
| KEY | |
| 1- | Managers, directors and senior officials |
| 2- | Professional |
| 3- | Associate professional and technical |
| 4- | Administrative and secretarial |
| 5- | Skilled trades |
| 6- | Caring, leisure and other services |
| 7- | Sales and customer service |
| 8- | Process, plant and machine operatives |
| 9- | Elementary |
| 10- | Other/Not stated |
Full-time/Part-time Status
Part-time employment increased in ten of the fourteen economic sectors in the year to Q1 2016, with full-time employment also having increased in ten economic sectors. The largest annual increase in part-time employment was in the Administrative and support service activities sector (+4,000 or +20.0%). The Accommodation and food service activities sector recorded the largest annual increase in full-time employment (+8,800 or +11.2%) during this period. See Table 6.
In Q1 2016, the Elementary occupational group had the largest number of part-time employees at 84,500 (40.2%) persons followed by the Sales and customer service group with 72,700 (45.2%) part-time employees. See Table 7.
In Q1 2010, part-time employment accounted for 22.5% (425,100) of total employment. This proportion had risen to 23.1% (456,200) in Q1 2016. See Tables 6 and 7.
Average Usual Hours Worked per Week
The average usual hours worked per week in Q1 2016 was 35.8 hours. Of the fourteen economic sectors, the Agriculture, forestry and fishing sector had the highest average usual hours worked per week at 49.1 hours in Q1 2016 with the Education sector having the lowest at 29.4 hours worked per week in the same period. The overall average usual hours worked per week was 34.9 hours in Q1 2010. See Table 8.
Average usual hours worked per week classified by occupational group showed that Managers, directors and senior officials had the highest usual hours worked per week of 43.0 hours in Q1 2016. The Sales and customer service occupational group had the lowest average hours worked per week of 29.9 hours in the same period. See Table 9.
Self-employed persons had average usual hours worked per week of 44.0 hours in Q1 2016 with employees working 34.6 average usual hours per week. Persons in part-time employment worked an average usual hours of 19.3 hours per week in Q1 2016. See Tables 10 and 11.
Duration of Employment
There were 1,625,500 persons in their current employment for 1 year or more in Q1 2016, with 1,289,000 in their current employment for 48 months and greater. There was an annual increase (+13,100 or +23.9%) in the numbers employed in their current employment for 18-23 months from 54,900 persons in Q1 2015 to 68,000 persons in Q1 2016. See Table 12.
Size of Firm
Medium and large firms (50 persons or more) employed 655,100 persons in Q1 2016 with smaller firms (less than 50 persons) employing 838,600 persons in the same period. It should be noted that size of firm information was not available for just under 250,000 persons in Q1 2016. See Table 13.
Reasons for Part-time Employment
There were 456,200 persons in part-time employment in Q1 2016. The most common reason given for being in part-time employment was Person could not find a full-time job, (31.0% or 141,400 persons). This compares with Q1 2010 when 110,400 or 26.0% of persons in part-time employment gave their reason for being in part-time employment as Person could not find a full-time job. See Table 14.
Permanency of Employment
The number of temporary employees decreased by 8,300 (-6.2%) in the year to Q1 2016 bringing the total number of temporary employees to 126,400 persons. The number of temporary employees as a percentage of total employees (1,636,400) stood at 7.7% in Q1 2016. The comparable figure in Q1 2010 was 8.9% (139,600) of total employees (1,569,200).
In the Education sector there was a decrease of 5,500 (-23.9%) in the number of temporary employees from 23,000 in Q1 2010 to 17,500 in Q1 2016. Temporary employment accounted for 12.1% of total employment in the Education sector in Q1 2016 compared with 16.4% in Q1 2010. See Table 15.
In the year to Q1 2016, the largest rate of increase in permanent employees was seen in the Managers, directors and senior officials occupational group (+8.5% or +8,000). See Table 16.
Temporary employees were categorised by the type of temporary employment and, in Q1 2016, the most common type of temporary employment was Lasted only for a specific duration (44.0% or 55,600) followed by Casual work (35.2% or 44,500). See Table 17.
The most common reason given for being in temporary employment in Q1 2016 was Person could not find a permanent job (50.6% or 64,000). See Table 18.
Supervisory Duties
Out of a total of 1,636,400 employees in Q1 2016, there were 450,100 (27.5%) employees classified as having supervisory duties while 1,165,200 employees were classified as not having supervisory duties. The number of employees classified as having supervisory duties increased by 26,700 (+6.3%) in the year to Q1 2016.The overall number of employees increased by 2.4% (+37,900) over the year. See Table 19.
| Table 1 Persons aged 15 years and over in employment (ILO) classified by detailed NACE Rev. 2 Economic Sector | ||||||||||||||||
| '000 | ||||||||||||||||
| Detailed NACE Rev. 2 Economic Sector | Q1 10 | Q1 11 | Q1 12 | Q1 13 | Q1 14 | Q1 15 | Q1 16 | |||||||||
| 01 Crop and animal production, hunting and related service activities | 75.5 | 77.3 | 76.4 | 89.6 | 103.9 | 102.5 | 104.2 | |||||||||
| 02 Forestry and logging | * | [3.0] | * | [3.1] | [3.2] | * | * | |||||||||
| 03 Fishing and aquaculture | [2.8] | [2.9] | * | [3.4] | [3.4] | [3.4] | * | |||||||||
| 05 Mining of coal and lignite | * | * | * | * | * | * | * | |||||||||
| 06 Extraction of crude petroleum and natural gas | * | * | * | * | * | * | * | |||||||||
| 07 Mining of metal ores | * | * | * | * | * | * | * | |||||||||
| 08 Other mining and quarrying | 4.8 | 4.3 | [4.0] | 5.6 | [4.4] | 5.2 | [4.3] | |||||||||
| 09 Mining support service activities | * | * | * | * | * | * | * | |||||||||
| 10 Manufacture of food products | 39.4 | 44.1 | 45.6 | 44.9 | 46.1 | 47.1 | 48.1 | |||||||||
| 11 Manufacture of beverages | 6.1 | 5.4 | 6.0 | 6.2 | 5.3 | 5.8 | [4.9] | |||||||||
| 12 Manufacture of tobacco products | * | * | * | * | * | * | * | |||||||||
| 13 Manufacture of textiles | [2.7] | * | [2.5] | [2.6] | [2.8] | [3.4] | * | |||||||||
| 14 Manufacture of wearing apparel | 4.0 | [3.2] | [2.9] | [2.9] | [3.3] | [3.5] | * | |||||||||
| 15 Manufacture of leather and related products | * | * | * | * | * | * | * | |||||||||
| 16 Manufacture of wood and of products of wood and cork, except furniture; manufacture of articles of straw and plaiting materials | 6.2 | 6.6 | 5.0 | 5.0 | 5.1 | * | [3.4] | |||||||||
| 17 Manufacture of paper and paper products | [3.0] | * | * | * | [2.8] | * | * | |||||||||
| 18 Printing and reproduction of recorded media | 8.6 | 7.8 | 6.8 | 8.5 | 9.5 | 9.6 | 6.8 | |||||||||
| 19 Manufacture of coke and refined petroleum products | * | * | * | * | * | * | * | |||||||||
| 20 Manufacture of chemicals and chemical products | [2.4] | [3.8] | [2.9] | [3.3] | * | [3.6] | [4.6] | |||||||||
| 21 Manufacture of basic pharmaceutical products and pharmaceutical preparations | 30.3 | 32.9 | 28.0 | 33.5 | 33.6 | 32.5 | 36.1 | |||||||||
| 22 Manufacture of rubber and plastic products | 6.1 | 4.7 | 5.6 | 5.1 | 4.5 | [3.2] | [6.0] | |||||||||
| 23 Manufacture of other non-metallic mineral products | 5.2 | 5.2 | 6.3 | 5.4 | 5.6 | 6.2 | 6.0 | |||||||||
| 24 Manufacture of basic metals | [2.9] | [3.0] | 4.2 | [3.2] | [2.9] | [3.6] | [5.0] | |||||||||
| 25 Manufacture of fabricated metal products, except machinery and equipment | 17.0 | 12.4 | 13.8 | 12.6 | 11.9 | 13.3 | 14.2 | |||||||||
| 26 Manufacture of computer, electronic and optical products | 25.6 | 22.8 | 26.1 | 24.9 | 24.1 | 28.1 | 26.3 | |||||||||
| 27 Manufacture of electrical equipment | * | [3.1] | * | * | * | * | * | |||||||||
| 28 Manufacture of machinery and equipment n.e.c. | 27.9 | 26.7 | 28.9 | 31.2 | 29.6 | 28.9 | 29.3 | |||||||||
| 29 Manufacture of motor vehicles, trailers and semi-trailers | 4.0 | 4.3 | [3.3] | [2.7] | [3.7] | [3.0] | * | |||||||||
| 30 Manufacture of other transport equipment | * | * | * | * | * | * | * | |||||||||
| 31 Manufacture of furniture | 5.7 | 6.3 | 4.1 | [3.9] | [4.1] | 6.6 | 6.2 | |||||||||
| 32 Other manufacturing | 9.0 | 9.3 | 7.1 | 6.7 | 5.7 | 6.5 | 6.6 | |||||||||
| 33 Repair and installation of machinery and equipment | 5.7 | 5.6 | 5.8 | 4.9 | 4.6 | 6.2 | 7.1 | |||||||||
| 35 Electricity, gas, steam and air conditioning supply | 13.7 | 9.7 | 10.8 | 9.0 | 10.3 | 9.3 | 11.5 | |||||||||
| 36 Water collection, treatment and supply | [2.3] | [2.8] | [2.4] | * | * | [3.1] | * | |||||||||
| 37 Sewerage | * | * | * | * | * | * | * | |||||||||
| 38 Waste collection, treatment and disposal activities; materials recovery | 9.4 | 8.7 | 7.0 | 8.0 | 8.2 | 7.7 | 6.4 | |||||||||
| 39 Remediation activities and other waste management services | * | * | * | * | * | * | * | |||||||||
| 41 Construction of buildings | 60.1 | 47.5 | 45.4 | 41.2 | 45.6 | 55.2 | 63.4 | |||||||||
| 42 Civil engineering | 5.8 | 7.0 | 6.2 | [3.4] | 6.3 | 6.5 | 6.4 | |||||||||
| 43 Specialised construction activities | 64.6 | 54.0 | 51.7 | 51.7 | 50.4 | 60.1 | 61.4 | |||||||||
| 45 Wholesale and retail trade and repair of motor vehicles and motorcycles | 33.6 | 34.7 | 34.4 | 34.1 | 35.4 | 41.7 | 35.9 | |||||||||
| 46 Wholesale trade, except of motor vehicles and motorcycles | 52.2 | 48.7 | 49.7 | 57.9 | 55.2 | 47.2 | 43.2 | |||||||||
| 47 Retail trade, except of motor vehicles and motorcycles | 189.4 | 187.9 | 187.2 | 182.1 | 177.6 | 181.6 | 193.3 | |||||||||
| 49 Land transport and transport via pipelines | 50.1 | 52.4 | 49.0 | 46.9 | 47.7 | 47.5 | 50.8 | |||||||||
| 50 Water transport | [2.5] | * | * | * | * | * | * | |||||||||
| 51 Air transport | 9.8 | 9.1 | 9.1 | 9.9 | 9.2 | 12.3 | 9.4 | |||||||||
| 52 Warehousing and support activities for transportation | 14.7 | 13.5 | 13.9 | 13.8 | 14.1 | 12.9 | 17.1 | |||||||||
| 53 Postal and courier activities | 16.7 | 17.7 | 16.9 | 16.4 | 15.9 | 15.8 | 15.7 | |||||||||
| 55 Accommodation | 48.6 | 35.4 | 46.5 | 44.8 | 48.0 | 50.3 | 50.1 | |||||||||
| 56 Food and beverage service activities | 82.5 | 75.3 | 71.1 | 75.6 | 85.7 | 82.1 | 92.3 | |||||||||
| 58 Publishing activities | 5.0 | [3.7] | [3.1] | 4.9 | 5.7 | [4.2] | [4.4] | |||||||||
| 59 Motion picture, video and television programme production, sound recording and music publishing activities | [3.3] | [4.1] | [3.7] | [3.5] | [4.4] | [3.0] | [4.0] | |||||||||
| 60 Programming and broadcasting activities | 4.7 | 4.2 | 5.3 | [3.9] | [4.3] | [4.9] | [3.2] | |||||||||
| 61 Telecommunications | 20.8 | 19.8 | 18.9 | 18.0 | 16.1 | 17.7 | 15.6 | |||||||||
| 62 Computer programming, consultancy and related activities | 36.1 | 36.0 | 41.1 | 41.2 | 43.7 | 47.1 | 51.1 | |||||||||
| 63 Information service activities | 6.3 | 4.8 | 6.4 | 5.9 | 6.5 | 5.0 | 6.9 | |||||||||
| 64 Financial service activities, except insurance and pension funding | 64.7 | 62.3 | 62.6 | 65.7 | 63.1 | 61.8 | 60.8 | |||||||||
| 65 Insurance, reinsurance and pension funding, except compulsory social security | 21.2 | 20.8 | 19.3 | 19.6 | 20.7 | 20.4 | 21.3 | |||||||||
| 66 Activities auxiliary to financial services and insurance activities | 9.8 | 8.4 | 7.9 | 5.6 | 5.4 | 7.3 | 7.4 | |||||||||
| 68 Real estate activities | 8.7 | 8.3 | 11.2 | 8.7 | 8.5 | 12.8 | 11.3 | |||||||||
| 69 Legal and accounting activities | 26.7 | 25.8 | 21.7 | 26.5 | 28.8 | 27.5 | 26.6 | |||||||||
| 70 Activities of head offices; management consultancy activities | 6.6 | 7.1 | 6.3 | 6.3 | 6.5 | 5.1 | 7.6 | |||||||||
| 71 Architectural and engineering activities; technical testing and analysis | 26.7 | 22.7 | 27.9 | 27.5 | 31.3 | 30.7 | 28.8 | |||||||||
| 72 Scientific research and development | 4.6 | 6.1 | 4.5 | 5.4 | 6.2 | 7.1 | [6.3] | |||||||||
| 73 Advertising and market research | 6.0 | 6.2 | 8.0 | 7.2 | 7.3 | 5.5 | 7.0 | |||||||||
| 74 Other professional, scientific and technical activities | 27.5 | 33.7 | 26.7 | 27.8 | 31.5 | 30.9 | 30.2 | |||||||||
| 75 Veterinary activities | 4.7 | * | [2.7] | [3.1] | [4.1] | * | [3.8] | |||||||||
| 77 Rental and leasing activities | 5.3 | 5.4 | 5.2 | 4.8 | 5.4 | 4.9 | [5.0] | |||||||||
| 78 Employment activities | 7.2 | 6.7 | 7.7 | 6.6 | 6.1 | 6.0 | 6.1 | |||||||||
| 79 Travel agency, tour operator reservation service and related activities | 6.0 | 6.0 | 5.6 | 5.4 | 6.8 | 6.3 | [5.0] | |||||||||
| 80 Security and investigation activities | 10.8 | 10.8 | 10.1 | 9.8 | 10.7 | 10.4 | 11.0 | |||||||||
| 81 Services to buildings and landscape activities | 21.4 | 25.1 | 23.5 | 23.2 | 20.3 | 24.0 | 28.6 | |||||||||
| 82 Office administrative, office support and other business support activities | 10.8 | 10.9 | 10.4 | 9.7 | 13.3 | 10.5 | 12.4 | |||||||||
| 84 Public administration and defence; compulsory social security | 105.1 | 104.5 | 99.5 | 95.2 | 96.4 | 97.8 | 98.5 | |||||||||
| 85 Education | 148.1 | 148.2 | 146.6 | 147.5 | 150.3 | 154.2 | 153.9 | |||||||||
| 86 Human health activities | 154.8 | 150.7 | 154.9 | 156.5 | 153.1 | 146.0 | 154.7 | |||||||||
| 87 Residential care activities | 22.1 | 25.6 | 23.4 | 26.7 | 26.1 | 28.8 | 25.3 | |||||||||
| 88 Social work activities without accommodation | 57.8 | 58.8 | 61.3 | 64.3 | 65.1 | 71.7 | 68.6 | |||||||||
| 90 Creative, arts and entertainment activities | 12.6 | 13.8 | 12.9 | 12.4 | 13.4 | 14.5 | 16.3 | |||||||||
| 91 Libraries, archives, museums and other cultural activities | 3.8 | [4.0] | [3.2] | [4.0] | [3.4] | 5.0 | [4.4] | |||||||||
| 92 Gambling and betting activities | 4.0 | 4.5 | 5.9 | 5.9 | [4.2] | [4.4] | [5.7] | |||||||||
| 93 Sports activities and amusement and recreation activities | 19.6 | 22.4 | 20.0 | 19.6 | 18.9 | 19.0 | 22.6 | |||||||||
| 94 Activities of membership organisations | 13.9 | 17.4 | 14.2 | 13.8 | 11.2 | 14.8 | 11.3 | |||||||||
| 95 Repair of computers and personal and household goods | * | * | * | * | * | * | * | |||||||||
| 96 Other personal service activities | 28.8 | 27.2 | 28.6 | 30.5 | 32.3 | 30.9 | 32.3 | |||||||||
| 97 Activities of households as employers of domestic personnel | 8.2 | 7.9 | 8.9 | 7.7 | 6.7 | 6.9 | 8.3 | |||||||||
| 99 Activities of extraterritorial organisations and bodies | * | * | [3.1] | [4.3] | 7.0 | [5.2] | * | |||||||||
| Not stated | 8.1 | 6.9 | * | * | * | * | [6.3] | |||||||||
| Total persons | 1,891.9 | 1,841.8 | 1,825.0 | 1,845.6 | 1,888.2 | 1,929.5 | 1,976.5 | |||||||||
| Table 2 Persons aged 15 years and over in employment (ILO) classified by detailed occupational group (UK SOC2010) | ||||||||||||
| '000 | ||||||||||||
| Detailed occupational group | Q1 10 | Q1 11 | Q1 12 | Q1 13 | Q1 14 | Q1 15 | Q1 16 | |||||
| 1 Managers, directors and senior officials | 142.5 | 141.1 | 147.1 | 149.8 | 154.8 | 156.3 | 164.1 | |||||
| 11 Corporate managers and directors | 96.1 | 93.3 | 102.6 | 103.4 | 105.4 | 111.3 | 117.9 | |||||
| 111 Chief Executives and senior officials | * | * | * | [3.5] | [2.7] | * | * | |||||
| 112 Production managers and directors | 11.7 | 12.9 | 13.5 | 12.0 | 14.4 | 15.9 | 16.6 | |||||
| 113 Functional managers and directors | 46.3 | 46.9 | 55.3 | 58.0 | 59.6 | 59.0 | 59.8 | |||||
| 115 Financial institution managers and directors | 5.6 | 6.4 | 6.1 | 5.2 | 4.7 | [4.8] | 7.1 | |||||
| 116 Managers and directors in transport and logistics | 8.2 | 7.2 | 7.1 | 7.4 | 6.6 | 6.7 | 6.5 | |||||
| 117 Senior officers in protective services | * | * | * | * | * | * | * | |||||
| 118 Health and social services managers and directors | [2.1] | * | * | * | * | * | * | |||||
| 119 Managers and directors in retail and wholesale | 18.5 | 15.6 | 15.2 | 14.1 | 15.3 | 19.2 | 21.4 | |||||
| 12 Other managers and proprietors | 46.4 | 47.8 | 44.5 | 46.3 | 49.4 | 45.0 | 46.2 | |||||
| 121 Managers and proprietors in agriculture related services | * | * | * | * | * | * | * | |||||
| 122 Managers and proprietors in hospitality and leisure services | 23.1 | 21.1 | 19.2 | 18.2 | 21.0 | 18.3 | 21.1 | |||||
| 124 Managers and proprietors in health and care services | * | * | * | * | * | * | * | |||||
| 125 Managers and proprietors in other services | 20.5 | 24.0 | 23.0 | 24.6 | 24.1 | 23.1 | 22.6 | |||||
| 2 Professional | 341.8 | 339.5 | 341.5 | 354.3 | 351.0 | 345.2 | 357.2 | |||||
| 21 Science, research, engineering and technology professionals | 74.0 | 71.9 | 72.6 | 74.3 | 78.0 | 72.8 | 80.3 | |||||
| 211 Natural and social science professionals | 13.0 | 11.5 | 9.5 | 10.2 | 10.3 | 8.8 | 8.8 | |||||
| 212 Engineering professionals | 19.9 | 18.2 | 20.7 | 17.6 | 18.3 | 18.2 | 18.2 | |||||
| 213 Information technology and telecommunications professionals | 38.7 | 39.2 | 39.5 | 44.3 | 47.2 | 43.1 | 49.8 | |||||
| 214 Conservation and environment professionals | * | * | [2.5] | * | * | * | * | |||||
| 215 Research and development managers | * | * | * | * | * | * | * | |||||
| 22 Health professionals | 88.3 | 87.7 | 91.3 | 92.1 | 87.5 | 89.6 | 82.7 | |||||
| 221 Health professionals | 24.4 | 22.3 | 24.8 | 25.6 | 25.4 | 25.6 | 23.6 | |||||
| 222 Therapy professionals | 7.3 | 7.6 | 9.6 | 8.2 | 6.8 | 9.2 | 7.0 | |||||
| 223 Nursing and midwifery professionals | 56.7 | 57.7 | 56.9 | 58.2 | 55.3 | 54.8 | 52.2 | |||||
| 23 Teaching and educational professionals | 89.8 | 96.2 | 93.8 | 99.0 | 96.4 | 97.5 | 98.3 | |||||
| 231 Teaching and educational professionals | 89.8 | 96.2 | 93.8 | 99.0 | 96.4 | 97.5 | 98.3 | |||||
| 24 Business, media and public service professionals | 89.7 | 83.8 | 83.7 | 88.9 | 89.1 | 85.2 | 96.0 | |||||
| 241 Legal professionals | 11.0 | 11.3 | 13.2 | 10.7 | 10.0 | 9.3 | 12.8 | |||||
| 242 Business, research and administrative professionals | 49.3 | 45.9 | 44.6 | 50.0 | 52.1 | 50.5 | 50.8 | |||||
| 243 Architects, town planners and surveyors | 10.2 | 7.8 | 9.7 | 9.4 | 8.8 | 8.3 | 9.5 | |||||
| 244 Welfare professionals | 7.0 | 6.3 | 7.1 | 6.3 | 7.1 | 5.3 | 8.4 | |||||
| 245 Librarians and related professionals | [2.8] | [2.5] | * | [3.3] | * | * | * | |||||
| 246 Quality and regulatory professionals | [2.8] | [4.0] | [4.0] | 4.3 | [3.5] | [4.0] | [5.6] | |||||
| 247 Media professionals | 6.6 | 5.9 | [3.4] | 4.9 | 5.4 | 5.0 | 7.0 | |||||
| 3 Associate professional and technical | 203.7 | 210.3 | 220.0 | 213.9 | 220.7 | 226.1 | 232.6 | |||||
| 31 Science, engineering and technology associate professionals | 27.9 | 30.5 | 36.5 | 33.0 | 34.4 | 37.8 | 37.2 | |||||
| 311 Science, engineering and production technicians | 14.5 | 17.5 | 21.1 | 19.4 | 18.2 | 19.8 | 20.3 | |||||
| 312 Draughtspersons and related architectural technicians | [2.3] | [2.6] | [2.9] | * | [2.8] | * | [4.1] | |||||
| 313 Information technology technicians | 11.1 | 10.4 | 12.5 | 11.1 | 13.4 | 15.4 | 12.7 | |||||
| 32 Health and social care associate professionals | 17.2 | 18.4 | 16.5 | 16.5 | 17.4 | 19.0 | 17.6 | |||||
| 321 Health associate professionals | 7.8 | 7.4 | 8.3 | 8.2 | 9.0 | 9.4 | 9.9 | |||||
| 323 Welfare and housing associate professionals | 9.4 | 11.0 | 8.3 | 8.3 | 8.4 | 9.6 | 7.7 | |||||
| 33 Protective service occupations | 26.4 | 31.7 | 27.1 | 24.9 | 25.6 | 23.6 | 23.5 | |||||
| 331 Protective service occupations | 26.4 | 31.7 | 27.1 | 24.9 | 25.6 | 23.6 | 23.5 | |||||
| 34 Culture, media and sports occupations | 28.4 | 28.6 | 26.7 | 29.2 | 29.8 | 31.4 | 32.0 | |||||
| 341 Artistic, literary and media occupations | 14.1 | 15.8 | 14.4 | 14.5 | 16.1 | 16.7 | 16.2 | |||||
| 342 Design occupations | 5.4 | 5.5 | 5.5 | 7.0 | 5.9 | 6.9 | 6.5 | |||||
| 344 Sports and fitness occupations | 8.9 | 7.3 | 6.8 | 7.7 | 7.8 | 7.8 | 9.3 | |||||
| 35 Business and public service associate professionals | 103.7 | 101.2 | 113.2 | 110.3 | 113.4 | 114.3 | 122.3 | |||||
| 351 Transport associate professionals | [2.2] | * | [2.6] | [2.6] | * | * | * | |||||
| 352 Legal associate professionals | * | * | * | * | [2.7] | * | * | |||||
| 353 Business, finance and related associate professionals | 25.6 | 25.7 | 30.5 | 28.8 | 29.3 | 30.7 | 34.3 | |||||
| 354 Sales, marketing and related associate professionals | 52.0 | 50.0 | 54.2 | 53.9 | 54.2 | 53.5 | 57.1 | |||||
| 355 Conservation and environmental associate professionals | * | * | * | * | * | * | * | |||||
| 356 Public services and other associate professionals | 21.5 | 21.8 | 23.6 | 22.8 | 24.8 | 24.5 | 25.4 | |||||
| 4 Administrative and secreterial | 243.2 | 221.7 | 207.9 | 201.8 | 208.8 | 206.6 | 206.8 | |||||
| 41 Administrative occupations | 195.4 | 175.4 | 162.7 | 161.6 | 167.2 | 167.2 | 164.7 | |||||
| 411 Administrative occupations: Government and related organisations | 51.3 | 42.6 | 41.9 | 37.4 | 37.0 | 34.8 | 33.5 | |||||
| 412 Administrative occupations: Finance | 63.9 | 55.9 | 50.5 | 49.4 | 48.6 | 50.2 | 46.7 | |||||
| 413 Administrative occupations: Records | 16.7 | 17.3 | 16.8 | 17.0 | 17.6 | 15.1 | 18.5 | |||||
| 415 Other administrative occupations | 57.4 | 52.9 | 46.8 | 51.8 | 56.2 | 58.5 | 57.2 | |||||
| 416 Administrative occupations: Office managers and supervisors | 6.1 | 6.7 | 6.7 | 6.0 | 7.8 | 8.6 | 8.7 | |||||
| 42 Secretarial and related occupations | 47.8 | 46.2 | 45.2 | 40.1 | 41.5 | 39.4 | 42.1 | |||||
| 421 Secretarial and related occupations | 47.8 | 46.2 | 45.2 | 40.1 | 41.5 | 39.4 | 42.1 | |||||
| 5 Skilled trades | 296.9 | 267.6 | 261.0 | 269.2 | 296.2 | 312.1 | 318.1 | |||||
| 51 Skilled agricultural and related trades | 76.1 | 74.0 | 73.1 | 85.4 | 95.4 | 97.7 | 100.1 | |||||
| 511 Agricultural and related trades | 76.1 | 74.0 | 73.1 | 85.4 | 95.4 | 97.7 | 100.1 | |||||
| 52 Skilled metal, electrical and electronic trades | 91.4 | 85.3 | 84.2 | 85.0 | 90.4 | 92.1 | 94.2 | |||||
| 521 Metal forming, welding and related trades | 8.5 | 6.7 | 7.3 | 7.6 | 9.3 | 10.1 | 11.7 | |||||
| 522 Metal machining, fitting and instrument making trades | 23.4 | 19.8 | 22.5 | 24.9 | 26.1 | 28.8 | 27.6 | |||||
| 523 Vehicle trades | 18.0 | 18.0 | 18.3 | 17.9 | 20.4 | 20.8 | 16.2 | |||||
| 524 Electrical and electronic trades | 39.9 | 39.9 | 34.4 | 32.7 | 33.1 | 30.6 | 36.6 | |||||
| 525 Skilled Metal, electrical and electronic trades supervisors | * | * | * | * | * | * | * | |||||
| 53 Skilled construction and building trades | 75.1 | 58.0 | 52.9 | 51.0 | 55.6 | 65.3 | 65.0 | |||||
| 531 Construction and building trades | 56.3 | 43.5 | 40.7 | 38.9 | 40.9 | 48.2 | 47.0 | |||||
| 532 Building finishing trades | 15.1 | 12.3 | 10.1 | 9.4 | 11.5 | 14.0 | 14.2 | |||||
| 533 Construction and building trades supervisors | 3.7 | * | * | [2.8] | [3.1] | [3.2] | [3.8] | |||||
| 54 Textiles, printing and other skilled trades | 54.2 | 50.3 | 50.7 | 47.8 | 54.9 | 57.0 | 58.8 | |||||
| 541 Textiles and garments trades | * | * | * | * | * | * | * | |||||
| 542 Printing trades | 4.9 | [3.9] | [3.8] | 4.4 | [3.8] | [3.0] | * | |||||
| 543 Food preparation and hospitality trades | 39.9 | 36.5 | 39.0 | 36.5 | 43.5 | 44.6 | 46.7 | |||||
| 544 Other skilled trades | 7.9 | 8.6 | 5.5 | 5.5 | 5.3 | 6.8 | 6.9 | |||||
| 6 Caring, leisure and other services | 146.4 | 145.9 | 145.1 | 143.0 | 142.9 | 157.3 | 159.1 | |||||
| 61 Caring personal service occupations | 103.7 | 103.4 | 102.8 | 102.5 | 99.2 | 111.5 | 112.8 | |||||
| 612 Childcare and related personal services | 36.3 | 37.0 | 38.5 | 35.8 | 37.0 | 38.5 | 39.6 | |||||
| 613 Animal care and control services | * | * | * | * | * | * | * | |||||
| 614 Caring personal services | 65.6 | 64.4 | 62.4 | 65.0 | 60.8 | 70.8 | 70.8 | |||||
| 62 Leisure, travel and related personal service occupations | 42.7 | 42.5 | 42.2 | 40.6 | 43.7 | 45.8 | 46.4 | |||||
| 621 Leisure and travel services | 8.6 | 8.3 | 8.3 | 6.3 | 8.0 | 8.1 | 7.0 | |||||
| 622 Hairdressers and related services | 21.8 | 20.4 | 20.5 | 20.7 | 22.1 | 22.5 | 22.0 | |||||
| 623 Housekeeping and related services | 11.8 | 13.3 | 12.7 | 12.8 | 12.5 | 14.0 | 16.5 | |||||
| 624 Cleaning and housekeeping managers and supervisors | * | * | * | * | * | * | * | |||||
| 7 Sales and customer service | 158.7 | 158.7 | 157.7 | 162.0 | 154.4 | 162.4 | 161.0 | |||||
| 71 Sales occupations | 141.8 | 143.1 | 143.3 | 145.6 | 134.4 | 140.7 | 140.6 | |||||
| 711 Sales assistants and retail cashiers | 124.8 | 126.5 | 128.2 | 129.9 | 119.4 | 124.3 | 125.6 | |||||
| 712 Sales related occupations | 13.3 | 13.3 | 11.4 | 12.1 | 11.9 | 11.7 | 9.6 | |||||
| 713 Sales supervisors | [3.8] | [3.3] | [3.6] | [3.6] | [3.1] | [4.7] | [5.5] | |||||
| 72 Customer service occupations | 16.9 | 15.6 | 14.4 | 16.4 | 19.9 | 21.6 | 20.3 | |||||
| 721 Customer service occupations | 14.5 | 12.0 | 12.6 | 13.7 | 15.7 | 17.8 | 17.1 | |||||
| 722 Customer service managers and supervisors | * | [3.6] | * | [2.7] | [4.3] | [3.8] | * | |||||
| 8 Process, plant and machine operatives | 130.6 | 150.7 | 145.9 | 146.5 | 140.9 | 142.2 | 149.8 | |||||
| 81 Process, plant and machine operatives | 53.2 | 72.3 | 73.9 | 72.0 | 69.6 | 67.7 | 70.0 | |||||
| 811 Process Operatives | 16.3 | 30.1 | 25.2 | 22.6 | 21.4 | 22.3 | 20.2 | |||||
| 812 Plant and machine operatives | 9.2 | 5.8 | 7.9 | 6.5 | 8.6 | 7.1 | 7.7 | |||||
| 813 Assemblers and routine operatives | 20.9 | 26.4 | 30.4 | 33.1 | 29.5 | 28.5 | 27.5 | |||||
| 814 Construction operatives | 6.9 | 10.0 | 10.4 | 9.7 | 10.1 | 9.8 | 14.6 | |||||
| 82 Transport and mobile machine drivers and operatives | 77.3 | 78.4 | 72.0 | 74.6 | 71.3 | 74.5 | 79.8 | |||||
| 821 Road transport drivers | 61.5 | 62.5 | 57.3 | 59.9 | 56.9 | 58.7 | 64.5 | |||||
| 822 Mobile machine drivers and operatives | 10.6 | 10.8 | 10.2 | 11.0 | 9.6 | 11.9 | 11.4 | |||||
| 823 Other drivers and transport operatives | 5.2 | 5.1 | 4.5 | [3.7] | 4.8 | [4.0] | [3.9] | |||||
| 9 Elementary | 222.1 | 198.5 | 192.5 | 200.2 | 211.1 | 211.2 | 210.2 | |||||
| 91 Elementary trades and related occupations | 72.0 | 47.3 | 46.1 | 51.6 | 53.6 | 60.8 | 53.7 | |||||
| 911 Elementary agricultural occupations | 10.7 | 13.6 | 10.3 | 13.7 | 15.9 | 11.6 | 11.0 | |||||
| 912 Elementary construction occupations | 45.7 | 23.1 | 24.1 | 27.5 | 28.9 | 36.6 | 32.5 | |||||
| 913 Elementary process plant occupations | 15.3 | 10.0 | 11.2 | 9.5 | 8.4 | 11.9 | 9.7 | |||||
| 92 Elementary administration and service occupations | 150.2 | 151.2 | 146.4 | 148.6 | 157.5 | 150.3 | 156.5 | |||||
| 921 Elementary administration occupations | 11.6 | 13.0 | 10.1 | 10.7 | 10.2 | 8.2 | 8.9 | |||||
| 923 Elementary cleaning occupations | 33.6 | 37.5 | 38.1 | 37.8 | 40.1 | 38.2 | 37.2 | |||||
| 924 Elementary security occupations | 14.1 | 14.2 | 15.0 | 12.6 | 13.7 | 13.7 | 13.9 | |||||
| 925 Elementary sales occupations | * | * | * | * | * | * | * | |||||
| 926 Elementary storage occupations | 19.5 | 23.3 | 20.3 | 18.9 | 20.6 | 19.4 | 19.1 | |||||
| 927 Other elementary services occupations | 70.4 | 62.3 | 61.7 | 67.1 | 72.0 | 69.6 | 76.7 | |||||
| Other/Not stated | 6.1 | 7.8 | 6.2 | 4.8 | 7.5 | 10.3 | 17.4 | |||||
| Total persons | 1,891.9 | 1,841.8 | 1,825.0 | 1,845.6 | 1,888.2 | 1,929.5 | 1,976.5 | |||||
| Table 3 Persons aged 15 years and over in employment (ILO) classified by NACE Rev. 2 Economic Sector and occupational group (UK SOC2010) | ||||||||||
| '000 | ||||||||||
| NACE Rev.2 Economic Sector/Occupational group | Q1 10 | Q1 11 | Q1 12 | Q1 13 | Q1 14 | Q1 15 | Q1 16 | |||
| A | Agriculture, forestry and fishing | 1. Managers, directors and senior officials | * | * | * | [2.6] | [3.7] | [2.7] | * | |
| 2. Professional | * | * | * | * | * | * | * | |||
| 3. Associate professional and technical | * | * | * | * | * | * | * | |||
| 4. Administrative and secreterial | * | * | * | * | * | * | * | |||
| 5. Skilled trades | 66.1 | 63.3 | 62.6 | 74.6 | 84.9 | 87.0 | 88.4 | |||
| 6. Caring, leisure and other services | * | * | * | * | * | * | * | |||
| 7. Sales and customer service | * | * | * | * | * | * | * | |||
| 8. Process, plant and machine operatives | * | * | * | * | * | * | * | |||
| 9. Elementary | 9.4 | 11.6 | 10.6 | 12.5 | 14.7 | 11.4 | 12.4 | |||
| Other/Not stated | * | * | * | * | * | * | * | |||
| Total | 80.5 | 83.2 | 80.5 | 96.2 | 110.5 | 107.8 | 109.3 | |||
| B-F | Total Industry | 1. Managers, directors and senior officials | 22.8 | 24.4 | 25.5 | 27.1 | 26.5 | 28.6 | 32.4 | |
| 2. Professional | 29.6 | 25.8 | 26.7 | 26.6 | 28.2 | 28.5 | 27.7 | |||
| 3. Associate professional and technical | 33.0 | 34.2 | 39.8 | 34.8 | 36.2 | 39.2 | 41.0 | |||
| 4. Administrative and secreterial | 25.2 | 21.7 | 22.1 | 21.0 | 22.7 | 22.2 | 22.0 | |||
| 5. Skilled trades | 140.2 | 115.2 | 107.5 | 104.6 | 109.8 | 123.4 | 130.1 | |||
| 6. Caring, leisure and other services | * | * | * | * | * | * | [4.0] | |||
| 7. Sales and customer service | 8.0 | 8.0 | 5.5 | 9.8 | 8.4 | 8.0 | 7.7 | |||
| 8. Process, plant and machine operatives | 61.8 | 77.8 | 74.1 | 73.9 | 68.5 | 70.5 | 73.0 | |||
| 9. Elementary | 54.8 | 37.1 | 35.9 | 35.0 | 37.2 | 45.1 | 40.5 | |||
| Other/Not stated | * | * | * | * | * | * | * | |||
| Total | 377.1 | 346.9 | 339.3 | 334.3 | 339.3 | 368.2 | 381.4 | |||
| B-E | Industry | 1. Managers, directors and senior officials | 17.3 | 19.2 | 19.7 | 20.1 | 19.5 | 20.0 | 23.2 | |
| 2. Professional | 26.1 | 22.8 | 24.4 | 24.4 | 25.4 | 25.8 | 23.8 | |||
| 3. Associate professional and technical | 29.4 | 30.5 | 34.3 | 31.4 | 32.7 | 35.6 | 35.4 | |||
| 4. Administrative and secreterial | 18.0 | 16.5 | 17.9 | 16.8 | 17.5 | 16.8 | 17.0 | |||
| 5. Skilled trades | 59.2 | 51.1 | 49.2 | 48.6 | 49.6 | 53.4 | 57.3 | |||
| 6. Caring, leisure and other services | * | * | * | * | * | * | * | |||
| 7. Sales and customer service | 6.3 | 7.2 | 4.6 | 9.1 | 7.4 | 7.2 | 6.6 | |||
| 8. Process, plant and machine operatives | 50.3 | 66.1 | 61.1 | 61.9 | 57.8 | 57.2 | 56.1 | |||
| 9. Elementary | 38.9 | 23.1 | 23.2 | 24.7 | 25.6 | 28.3 | 28.2 | |||
| Other/Not stated | * | * | * | * | * | * | * | |||
| Total | 246.5 | 238.4 | 236.0 | 238.0 | 237.0 | 246.3 | 250.0 | |||
| F | Construction | 1. Managers, directors and senior officials | 5.4 | 5.2 | 5.8 | 7.0 | 7.0 | 8.7 | 9.2 | |
| 2. Professional | [3.5] | [3.0] | * | * | [2.8] | * | [3.9] | |||
| 3. Associate professional and technical | 3.6 | [3.6] | 5.5 | [3.4] | [3.5] | [3.6] | [5.7] | |||
| 4. Administrative and secreterial | 7.2 | 5.1 | [4.2] | 4.2 | 5.2 | 5.3 | [5.1] | |||
| 5. Skilled trades | 81.0 | 64.1 | 58.3 | 55.9 | 60.3 | 70.0 | 72.8 | |||
| 6. Caring, leisure and other services | * | * | * | * | * | * | * | |||
| 7. Sales and customer service | * | * | * | * | * | * | * | |||
| 8. Process, plant and machine operatives | 11.5 | 11.8 | 13.0 | 12.0 | 10.7 | 13.3 | 16.9 | |||
| 9. Elementary | 15.9 | 13.9 | 12.7 | 10.3 | 11.6 | 16.8 | 12.4 | |||
| Other/Not stated | * | * | * | * | * | * | * | |||
| Total | 130.6 | 108.5 | 103.3 | 96.3 | 102.3 | 121.8 | 131.3 | |||
| G-U | Total Services | 1. Managers, directors and senior officials | 117.7 | 114.3 | 119.5 | 119.9 | 124.6 | 124.4 | 129.8 | |
| 2. Professional | 311.4 | 312.2 | 314.0 | 327.1 | 321.6 | 315.7 | 329.0 | |||
| 3. Associate professional and technical | 169.5 | 174.6 | 179.4 | 177.7 | 183.0 | 185.0 | 189.9 | |||
| 4. Administrative and secreterial | 215.7 | 197.5 | 184.9 | 179.2 | 184.5 | 182.8 | 183.2 | |||
| 5. Skilled trades | 89.8 | 88.6 | 90.9 | 90.1 | 101.2 | 101.2 | 99.6 | |||
| 6. Caring, leisure and other services | 144.8 | 143.8 | 143.0 | 141.3 | 141.3 | 154.8 | 154.2 | |||
| 7. Sales and customer service | 150.3 | 150.4 | 152.0 | 152.0 | 145.7 | 153.9 | 153.1 | |||
| 8. Process, plant and machine operatives | 67.2 | 70.4 | 69.6 | 70.2 | 70.2 | 69.3 | 75.0 | |||
| 9. Elementary | 156.8 | 149.3 | 145.6 | 152.4 | 159.0 | 154.5 | 157.3 | |||
| Other/Not stated | [2.9] | [3.8] | [4.4] | [3.5] | 6.6 | 8.9 | 8.4 | |||
| Total | 1,426.2 | 1,404.8 | 1,403.3 | 1,413.5 | 1,437.7 | 1,450.5 | 1,479.6 | |||
| G | Wholesale and retail trade; repair of motor vehicles and motorcycles | 1. Managers, directors and senior officials | 41.6 | 41.0 | 42.9 | 43.1 | 42.5 | 42.4 | 41.7 | |
| 2. Professional | 8.6 | 8.7 | 9.0 | 8.7 | 9.3 | 7.2 | 9.0 | |||
| 3. Associate professional and technical | 25.7 | 22.5 | 24.4 | 24.9 | 24.8 | 24.2 | 26.9 | |||
| 4. Administrative and secreterial | 19.4 | 19.0 | 16.8 | 21.4 | 21.5 | 17.0 | 20.7 | |||
| 5. Skilled trades | 25.3 | 24.6 | 24.3 | 26.2 | 25.4 | 28.8 | 21.7 | |||
| 6. Caring, leisure and other services | * | * | * | * | * | * | * | |||
| 7. Sales and customer service | 120.9 | 123.1 | 120.8 | 117.3 | 112.8 | 119.6 | 120.7 | |||
| 8. Process, plant and machine operatives | 11.8 | 11.5 | 13.8 | 13.9 | 11.9 | 11.0 | 12.5 | |||
| 9. Elementary | 20.5 | 18.7 | 17.4 | 16.3 | 18.3 | 18.4 | 18.1 | |||
| Other/Not stated | * | * | * | * | * | * | * | |||
| Total | 275.3 | 271.3 | 271.3 | 274.1 | 268.2 | 270.5 | 272.5 | |||
| H | Transportation and storage | 1. Managers, directors and senior officials | 6.7 | 6.4 | 6.3 | 5.1 | 6.0 | 6.1 | 7.6 | |
| 2. Professional | * | * | * | * | * | * | * | |||
| 3. Associate professional and technical | 5.0 | 5.1 | 5.1 | 5.2 | 5.4 | 5.2 | [5.3] | |||
| 4. Administrative and secreterial | 11.8 | 11.9 | 10.8 | 9.3 | 9.3 | 10.0 | 9.1 | |||
| 5. Skilled trades | [3.4] | [3.6] | [4.0] | [3.5] | [4.2] | [3.0] | [3.9] | |||
| 6. Caring, leisure and other services | [3.4] | * | * | * | * | * | * | |||
| 7. Sales and customer service | * | * | * | * | [3.1] | [3.1] | * | |||
| 8. Process, plant and machine operatives | 43.9 | 45.4 | 42.4 | 43.1 | 42.8 | 44.2 | 47.6 | |||
| 9. Elementary | 15.5 | 16.3 | 14.7 | 16.1 | 15.5 | 14.3 | 15.5 | |||
| Other/Not stated | * | * | * | * | * | * | * | |||
| Total | 93.7 | 94.6 | 90.2 | 88.8 | 89.5 | 90.7 | 95.0 | |||
| I | Accommodation and food service activities | 1. Managers, directors and senior officials | 22.9 | 19.2 | 19.2 | 18.0 | 18.7 | 18.0 | 21.9 | |
| 2. Professional | * | * | * | * | * | * | * | |||
| 3. Associate professional and technical | * | * | * | * | [3.5] | [3.8] | [4.0] | |||
| 4. Administrative and secreterial | 7.8 | 4.7 | 6.5 | 6.3 | 5.4 | 7.2 | 6.4 | |||
| 5. Skilled trades | 22.9 | 20.1 | 22.1 | 19.1 | 26.9 | 26.9 | 31.8 | |||
| 6. Caring, leisure and other services | [3.5] | [3.6] | 4.8 | [3.7] | [4.2] | [4.6] | [5.0] | |||
| 7. Sales and customer service | 5.9 | [4.0] | 6.0 | 7.1 | 6.8 | 5.8 | [4.8] | |||
| 8. Process, plant and machine operatives | * | * | * | * | * | * | * | |||
| 9. Elementary | 64.3 | 55.2 | 54.9 | 60.5 | 65.4 | 63.3 | 66.0 | |||
| Other/Not stated | * | * | * | * | * | * | * | |||
| Total | 131.1 | 110.7 | 117.6 | 120.3 | 133.8 | 132.3 | 142.4 | |||
| J | Information and communication | 1. Managers, directors and senior officials | 7.2 | 6.8 | 8.6 | 7.5 | 6.9 | 6.8 | 9.0 | |
| 2. Professional | 26.8 | 28.5 | 26.9 | 29.6 | 32.3 | 30.3 | 37.9 | |||
| 3. Associate professional and technical | 18.2 | 15.4 | 20.6 | 20.0 | 19.6 | 22.2 | 18.5 | |||
| 4. Administrative and secreterial | 5.6 | 5.3 | 5.3 | 4.4 | 5.3 | 5.6 | 5.4 | |||
| 5. Skilled trades | 9.3 | 8.9 | 8.2 | 6.2 | 7.5 | 6.8 | 7.6 | |||
| 6. Caring, leisure and other services | * | * | * | * | * | * | * | |||
| 7. Sales and customer service | 5.4 | [3.5] | 5.9 | 6.6 | 4.8 | 5.4 | [3.2] | |||
| 8. Process, plant and machine operatives | * | * | * | * | * | * | * | |||
| 9. Elementary | * | * | * | * | * | * | * | |||
| Other/Not stated | * | * | * | * | * | * | * | |||
| Total | 76.1 | 72.6 | 78.5 | 77.4 | 80.7 | 81.8 | 85.2 | |||
| K-L | Financial, insurance and real estate activities | 1. Managers, directors and senior officials | 11.5 | 12.7 | 12.3 | 12.6 | 12.8 | 13.1 | 14.0 | |
| 2. Professional | 14.0 | 13.1 | 17.3 | 19.1 | 20.0 | 18.3 | 21.0 | |||
| 3. Associate professional and technical | 20.9 | 21.0 | 25.0 | 23.2 | 20.1 | 24.0 | 26.0 | |||
| 4. Administrative and secreterial | 50.4 | 42.6 | 37.6 | 35.7 | 34.2 | 34.1 | 27.7 | |||
| 5. Skilled trades | * | * | * | * | * | * | * | |||
| 6. Caring, leisure and other services | * | * | * | * | * | * | * | |||
| 7. Sales and customer service | 5.2 | 6.7 | 5.6 | 6.3 | 6.2 | 7.3 | 8.0 | |||
| 8. Process, plant and machine operatives | * | * | * | * | * | * | * | |||
| 9. Elementary | * | * | * | * | * | * | * | |||
| Other/Not stated | * | * | * | * | * | * | * | |||
| Total | 104.4 | 99.7 | 101.0 | 99.7 | 97.8 | 102.3 | 100.7 | |||
| M | Professional, scientific and technical activities | 1. Managers, directors and senior officials | 5.6 | 5.3 | 6.3 | 7.2 | 9.3 | 8.4 | 6.7 | |
| 2. Professional | 53.8 | 50.4 | 48.8 | 51.4 | 51.6 | 47.8 | 52.3 | |||
| 3. Associate professional and technical | 15.4 | 20.0 | 18.5 | 18.5 | 20.3 | 18.5 | 19.4 | |||
| 4. Administrative and secreterial | 14.5 | 12.8 | 10.6 | 10.5 | 14.8 | 15.1 | 13.4 | |||
| 5. Skilled trades | 6.7 | 7.5 | 8.4 | 10.3 | 12.0 | 11.3 | 9.7 | |||
| 6. Caring, leisure and other services | * | * | * | * | * | * | * | |||
| 7. Sales and customer service | * | [2.7] | * | * | * | * | * | |||
| 8. Process, plant and machine operatives | * | * | * | * | * | * | * | |||
| 9. Elementary | * | * | * | * | * | * | * | |||
| Other/Not stated | * | * | * | * | * | * | * | |||
| Total | 102.8 | 103.6 | 98.0 | 103.9 | 115.7 | 109.3 | 110.3 | |||
| N | Administrative and support service activities | 1. Managers, directors and senior officials | 3.7 | 4.0 | [3.9] | 5.1 | [4.3] | 5.2 | [4.3] | |
| 2. Professional | * | * | * | * | * | * | * | |||
| 3. Associate professional and technical | 5.3 | 5.5 | 5.8 | 5.8 | 7.5 | 5.1 | 5.5 | |||
| 4. Administrative and secreterial | 11.8 | 10.8 | 9.6 | 9.8 | 10.0 | 10.7 | 9.6 | |||
| 5. Skilled trades | 5.6 | 7.3 | 6.4 | 7.2 | 7.0 | 6.4 | 8.1 | |||
| 6. Caring, leisure and other services | [3.5] | 5.2 | [4.7] | * | [3.3] | [3.3] | [3.7] | |||
| 7. Sales and customer service | 5.1 | 5.0 | [3.3] | [2.9] | [4.1] | [4.3] | 6.5 | |||
| 8. Process, plant and machine operatives | * | * | [2.8] | * | * | * | * | |||
| 9. Elementary | 21.7 | 22.4 | 23.8 | 23.1 | 21.8 | 23.6 | 25.4 | |||
| Other/Not stated | * | * | * | * | * | * | * | |||
| Total | 61.5 | 64.9 | 62.5 | 59.5 | 62.5 | 62.1 | 68.2 | |||
| O | Public administration and defence; compulsory social security | 1. Managers, directors and senior officials | 5.6 | 4.2 | [3.4] | 5.3 | 4.4 | 5.5 | 6.1 | |
| 2. Professional | 8.2 | 8.2 | 9.2 | 10.5 | 9.1 | 10.7 | 9.5 | |||
| 3. Associate professional and technical | 33.8 | 37.3 | 34.5 | 33.4 | 34.9 | 33.1 | 34.5 | |||
| 4. Administrative and secreterial | 47.9 | 45.8 | 41.4 | 35.7 | 38.6 | 39.7 | 37.0 | |||
| 5. Skilled trades | * | * | * | * | * | * | * | |||
| 6. Caring, leisure and other services | * | * | * | * | * | * | * | |||
| 7. Sales and customer service | * | * | * | * | * | * | * | |||
| 8. Process, plant and machine operatives | * | * | * | * | * | * | * | |||
| 9. Elementary | 4.4 | 4.1 | 5.2 | [4.0] | [3.7] | [2.7] | [4.1] | |||
| Other/Not stated | * | * | * | * | * | * | * | |||
| Total | 105.1 | 104.5 | 99.5 | 95.2 | 96.4 | 97.8 | 98.5 | |||
| P | Education | 1. Managers, directors and senior officials | * | * | * | * | [3.1] | [3.6] | * | |
| 2. Professional | 95.6 | 97.6 | 94.1 | 97.8 | 95.1 | 97.6 | 98.0 | |||
| 3. Associate professional and technical | 9.6 | 10.2 | 9.4 | 8.9 | 11.5 | 9.9 | 9.4 | |||
| 4. Administrative and secreterial | 12.8 | 10.3 | 10.5 | 9.4 | 10.2 | 9.7 | 12.1 | |||
| 5. Skilled trades | * | * | * | * | * | [3.8] | * | |||
| 6. Caring, leisure and other services | 19.5 | 19.4 | 20.8 | 20.7 | 19.0 | 20.5 | 20.0 | |||
| 7. Sales and customer service | * | * | * | * | * | * | * | |||
| 8. Process, plant and machine operatives | * | * | * | * | * | * | * | |||
| 9. Elementary | 5.5 | 5.4 | 5.8 | 5.1 | 6.7 | 6.0 | 6.7 | |||
| Other/Not stated | * | * | * | * | * | * | * | |||
| Total | 148.1 | 148.2 | 146.6 | 147.5 | 150.3 | 154.2 | 153.9 | |||
| Q | Human health and social work activities | 1. Managers, directors and senior officials | 5.7 | 5.4 | 7.2 | 6.7 | 8.6 | 6.5 | 7.7 | |
| 2. Professional | 90.4 | 91.7 | 95.0 | 95.2 | 90.8 | 90.8 | 88.0 | |||
| 3. Associate professional and technical | 17.3 | 17.6 | 17.4 | 18.0 | 18.2 | 19.1 | 19.1 | |||
| 4. Administrative and secreterial | 22.1 | 21.9 | 24.0 | 25.1 | 25.1 | 23.1 | 29.1 | |||
| 5. Skilled trades | 6.0 | 4.4 | 5.9 | 5.9 | 5.6 | 4.8 | [3.9] | |||
| 6. Caring, leisure and other services | 77.9 | 76.7 | 74.8 | 76.7 | 76.0 | 86.3 | 85.8 | |||
| 7. Sales and customer service | * | * | * | [3.0] | * | * | * | |||
| 8. Process, plant and machine operatives | * | [2.7] | * | * | [2.8] | * | * | |||
| 9. Elementary | 11.7 | 12.5 | 11.1 | 14.8 | 14.9 | 12.2 | 10.6 | |||
| Other/Not stated | * | * | * | * | * | * | * | |||
| Total | 234.6 | 235.1 | 239.6 | 247.5 | 244.3 | 246.5 | 248.7 | |||
| R-U | Other NACE activities | 1. Managers, directors and senior officials | 5.6 | 7.4 | 7.4 | 7.0 | 8.0 | 8.8 | 8.0 | |
| 2. Professional | 9.3 | 9.4 | 8.9 | 9.9 | 8.4 | 8.1 | 8.9 | |||
| 3. Associate professional and technical | 16.1 | 17.7 | 16.2 | 17.6 | 17.2 | 19.9 | 21.4 | |||
| 4. Administrative and secreterial | 11.7 | 12.4 | 11.9 | 11.4 | 10.1 | 10.6 | 12.6 | |||
| 5. Skilled trades | 6.2 | 8.6 | 7.2 | 7.4 | 7.6 | 6.0 | 6.7 | |||
| 6. Caring, leisure and other services | 32.3 | 31.6 | 31.3 | 30.9 | 31.4 | 31.7 | 34.7 | |||
| 7. Sales and customer service | * | * | [3.6] | [3.4] | * | [3.0] | * | |||
| 8. Process, plant and machine operatives | * | * | * | * | * | * | * | |||
| 9. Elementary | 9.0 | 9.1 | 8.8 | 8.5 | 7.7 | 8.6 | 7.0 | |||
| Other/Not stated | * | * | * | * | [4.6] | [5.0] | * | |||
| Total | 93.5 | 99.4 | 98.5 | 99.8 | 98.6 | 103.0 | 104.1 | |||
| Not stated | 1. Managers, directors and senior officials | * | * | * | * | * | * | * | ||
| 2. Professional | * | * | * | * | * | * | * | |||
| 3. Associate professional and technical | * | * | * | * | * | * | * | |||
| 4. Administrative and secreterial | * | * | * | * | * | * | * | |||
| 5. Skilled trades | * | * | * | * | * | * | * | |||
| 6. Caring, leisure and other services | * | * | * | * | * | * | * | |||
| 7. Sales and customer service | * | * | * | * | * | * | * | |||
| 8. Process, plant and machine operatives | * | * | * | * | * | * | * | |||
| 9. Elementary | * | * | * | * | * | * | * | |||
| Other/Not stated | [2.5] | * | * | * | * | * | [6.0] | |||
| Total | 8.1 | 6.9 | * | * | * | * | [6.3] | |||
| All persons | 1. Managers, directors and senior officials | 142.5 | 141.1 | 147.1 | 149.8 | 154.8 | 156.3 | 164.1 | ||
| 2. Professional | 341.8 | 339.5 | 341.5 | 354.3 | 351.0 | 345.2 | 357.2 | |||
| 3. Associate professional and technical | 203.7 | 210.3 | 220.0 | 213.9 | 220.7 | 226.1 | 232.6 | |||
| 4. Administrative and secreterial | 243.2 | 221.7 | 207.9 | 201.8 | 208.8 | 206.6 | 206.8 | |||
| 5. Skilled trades | 296.9 | 267.6 | 261.0 | 269.2 | 296.2 | 312.1 | 318.1 | |||
| 6. Caring, leisure and other services | 146.4 | 145.9 | 145.1 | 143.0 | 142.9 | 157.3 | 159.1 | |||
| 7. Sales and customer service | 158.7 | 158.7 | 157.7 | 162.0 | 154.4 | 162.4 | 161.0 | |||
| 8. Process, plant and machine operatives | 130.6 | 150.7 | 145.9 | 146.5 | 140.9 | 142.2 | 149.8 | |||
| 9. Elementary | 222.1 | 198.5 | 192.5 | 200.2 | 211.1 | 211.2 | 210.2 | |||
| Other/Not stated | 6.1 | 7.8 | 6.2 | 4.8 | 7.5 | 10.3 | 17.4 | |||
| Total persons | 1,891.9 | 1,841.8 | 1,825.0 | 1,845.6 | 1,888.2 | 1,929.5 | 1,976.5 | |||
| Table 4 Persons aged 15 years and over in employment (ILO) classified by NACE Rev. 2 Economic Sector and employment status | ||||||||||||
| '000 | ||||||||||||
| NACE Rev.2 Economic Sector/Employment status | Q1 10 | Q1 11 | Q1 12 | Q1 13 | Q1 14 | Q1 15 | Q1 16 | |||||
| A | Agriculture, forestry and fishing | Self-employed (with paid employees) | 6.0 | 5.1 | 5.3 | 7.7 | 7.4 | 8.1 | 9.6 | |||
| Self-employed (with no paid employees) | 57.1 | 54.5 | 55.0 | 61.8 | 73.1 | 71.9 | 70.4 | |||||
| Total self employed | 63.0 | 59.6 | 60.3 | 69.5 | 80.5 | 80.1 | 80.1 | |||||
| Employee | 12.6 | 18.2 | 16.0 | 20.0 | 23.8 | 23.1 | 22.9 | |||||
| Assisting relative | 4.8 | 5.4 | 4.3 | 6.7 | 6.3 | 4.7 | 6.3 | |||||
| Total | 80.5 | 83.2 | 80.5 | 96.2 | 110.5 | 107.8 | 109.3 | |||||
| B-F | Total Industry | Self-employed (with paid employees) | 25.5 | 18.4 | 21.0 | 19.2 | 17.7 | 20.9 | 19.4 | |||
| Self-employed (with no paid employees) | 46.5 | 40.5 | 36.9 | 41.2 | 41.7 | 43.9 | 48.9 | |||||
| Total self employed | 72.0 | 59.0 | 58.0 | 60.4 | 59.4 | 64.8 | 68.3 | |||||
| Employee | 302.9 | 286.8 | 279.4 | 272.7 | 278.0 | 301.8 | 311.7 | |||||
| Assisting relative | [2.2] | * | * | * | * | * | * | |||||
| Total | 377.1 | 346.9 | 339.3 | 334.3 | 339.3 | 368.2 | 381.4 | |||||
| B-E | Industry | Self-employed (with paid employees) | 8.5 | 7.1 | 10.4 | 8.6 | 7.4 | 6.7 | 6.5 | |||
| Self-employed (with no paid employees) | 14.0 | 10.6 | 10.1 | 12.5 | 13.3 | 13.3 | 15.2 | |||||
| Total self employed | 22.5 | 17.8 | 20.6 | 21.1 | 20.7 | 20.0 | 21.7 | |||||
| Employee | 222.8 | 220.3 | 214.5 | 216.4 | 215.4 | 225.9 | 227.6 | |||||
| Assisting relative | * | * | * | * | * | * | * | |||||
| Total | 246.5 | 238.4 | 236.0 | 238.0 | 237.0 | 246.3 | 250.0 | |||||
| F | Construction | Self-employed (with paid employees) | 17.0 | 11.3 | 10.6 | 10.6 | 10.2 | 14.2 | 12.9 | |||
| Self-employed (with no paid employees) | 32.5 | 29.9 | 26.8 | 28.7 | 28.4 | 30.6 | 33.7 | |||||
| Total self employed | 49.5 | 41.2 | 37.4 | 39.3 | 38.7 | 44.8 | 46.6 | |||||
| Employee | 80.2 | 66.6 | 64.9 | 56.3 | 62.5 | 75.9 | 84.2 | |||||
| Assisting relative | * | * | * | * | * | * | * | |||||
| Total | 130.6 | 108.5 | 103.3 | 96.3 | 102.3 | 121.8 | 131.3 | |||||
| G-U | Total Services | Self-employed (with paid employees) | 69.0 | 68.3 | 65.1 | 61.3 | 62.2 | 60.4 | 63.4 | |||
| Self-employed (with no paid employees) | 104.2 | 106.9 | 107.5 | 112.1 | 116.2 | 112.9 | 113.4 | |||||
| Total self employed | 173.2 | 175.2 | 172.6 | 173.4 | 178.4 | 173.3 | 176.8 | |||||
| Employee | 1,245.8 | 1,224.6 | 1,225.7 | 1,233.2 | 1,253.1 | 1,271.2 | 1,295.9 | |||||
| Assisting relative | 7.2 | 5.0 | 4.9 | 6.9 | 6.1 | 6.0 | 6.8 | |||||
| Total | 1,426.2 | 1,404.8 | 1,403.3 | 1,413.5 | 1,437.7 | 1,450.5 | 1,479.6 | |||||
| G | Wholesale and retail trade; repair of motor vehicles and motorcycles | Self-employed (with paid employees) | 20.5 | 19.9 | 19.2 | 17.2 | 17.1 | 17.7 | 18.1 | |||
| Self-employed (with no paid employees) | 15.7 | 17.3 | 15.0 | 17.3 | 19.2 | 16.7 | 13.4 | |||||
| Total self employed | 36.1 | 37.2 | 34.2 | 34.5 | 36.2 | 34.4 | 31.6 | |||||
| Employee | 237.2 | 233.0 | 235.9 | 237.7 | 230.7 | 234.9 | 239.2 | |||||
| Assisting relative | * | * | * | * | * | * | * | |||||
| Total | 275.3 | 271.3 | 271.3 | 274.1 | 268.2 | 270.5 | 272.5 | |||||
| H | Transportation and storage | Self-employed (with paid employees) | 3.9 | 4.8 | 3.9 | [3.6] | [3.5] | [3.6] | [4.7] | |||
| Self-employed (with no paid employees) | 20.6 | 19.6 | 19.8 | 17.6 | 18.9 | 18.9 | 18.6 | |||||
| Total self employed | 24.5 | 24.4 | 23.7 | 21.2 | 22.4 | 22.5 | 23.3 | |||||
| Employee | 68.6 | 70.0 | 66.2 | 66.9 | 66.4 | 67.8 | 71.3 | |||||
| Assisting relative | * | * | * | * | * | * | * | |||||
| Total | 93.7 | 94.6 | 90.2 | 88.8 | 89.5 | 90.7 | 95.0 | |||||
| I | Accommodation and food service activities | Self-employed (with paid employees) | 10.8 | 10.4 | 10.3 | 7.0 | 9.1 | 8.3 | 9.8 | |||
| Self-employed (with no paid employees) | 5.0 | [3.8] | 4.0 | 5.0 | 4.8 | [5.0] | 5.2 | |||||
| Total self employed | 15.8 | 14.1 | 14.4 | 12.0 | 14.0 | 13.2 | 15.0 | |||||
| Employee | 113.9 | 95.7 | 102.2 | 107.6 | 119.0 | 118.3 | 126.2 | |||||
| Assisting relative | * | * | * | * | * | * | * | |||||
| Total | 131.1 | 110.7 | 117.6 | 120.3 | 133.8 | 132.3 | 142.4 | |||||
| J | Information and communication | Self-employed (with paid employees) | [2.2] | [2.7] | [3.6] | * | [2.9] | * | * | |||
| Self-employed (with no paid employees) | 7.3 | 8.2 | 8.2 | 8.3 | 8.6 | 8.5 | 9.1 | |||||
| Total self employed | 9.5 | 10.9 | 11.8 | 10.9 | 11.5 | 10.2 | 10.8 | |||||
| Employee | 66.4 | 61.8 | 66.7 | 66.2 | 69.2 | 71.4 | 74.5 | |||||
| Assisting relative | * | * | * | * | * | * | * | |||||
| Total | 76.1 | 72.6 | 78.5 | 77.4 | 80.7 | 81.8 | 85.2 | |||||
| K-L | Financial, insurance and real estate activities | Self-employed (with paid employees) | [2.6] | [3.2] | [2.9] | [3.2] | [2.7] | [3.2] | * | |||
| Self-employed (with no paid employees) | 3.9 | 5.1 | 5.6 | 4.6 | [4.1] | 5.6 | 5.6 | |||||
| Total self employed | 6.4 | 8.2 | 8.5 | 7.8 | 6.8 | 8.8 | 8.1 | |||||
| Employee | 97.6 | 91.5 | 92.4 | 91.8 | 90.8 | 93.2 | 92.4 | |||||
| Assisting relative | * | * | * | * | * | * | * | |||||
| Total | 104.4 | 99.7 | 101.0 | 99.7 | 97.8 | 102.3 | 100.7 | |||||
| M | Professional, scientific and technical activities | Self-employed (with paid employees) | 12.2 | 11.7 | 8.6 | 10.1 | 10.8 | 10.4 | 11.2 | |||
| Self-employed (with no paid employees) | 16.8 | 18.0 | 20.5 | 21.8 | 21.2 | 20.0 | 18.7 | |||||
| Total self employed | 29.0 | 29.7 | 29.0 | 31.8 | 32.1 | 30.4 | 29.9 | |||||
| Employee | 73.5 | 73.3 | 68.7 | 71.6 | 83.4 | 78.4 | 79.8 | |||||
| Assisting relative | * | * | * | * | * | * | * | |||||
| Total | 102.8 | 103.6 | 98.0 | 103.9 | 115.7 | 109.3 | 110.3 | |||||
| N | Administrative and support service activities | Self-employed (with paid employees) | [3.2] | [3.0] | [3.3] | [2.7] | * | * | * | |||
| Self-employed (with no paid employees) | 5.0 | 5.1 | 5.8 | 6.2 | 6.1 | [4.3] | 6.0 | |||||
| Total self employed | 8.2 | 8.2 | 9.1 | 8.9 | 8.7 | 6.3 | 8.3 | |||||
| Employee | 53.1 | 56.2 | 53.2 | 50.6 | 53.5 | 55.6 | 59.7 | |||||
| Assisting relative | * | * | * | * | * | * | * | |||||
| Total | 61.5 | 64.9 | 62.5 | 59.5 | 62.5 | 62.1 | 68.2 | |||||
| O | Public administration and defence; compulsory social security | Self-employed (with paid employees) | * | * | * | * | * | * | * | |||
| Self-employed (with no paid employees) | * | * | * | * | * | * | * | |||||
| Total self employed | * | * | * | * | * | * | * | |||||
| Employee | 104.3 | 103.8 | 98.8 | 93.8 | 95.5 | 96.6 | 96.9 | |||||
| Assisting relative | * | * | * | * | * | * | * | |||||
| Total | 105.1 | 104.5 | 99.5 | 95.2 | 96.4 | 97.8 | 98.5 | |||||
| P | Education | Self-employed (with paid employees) | * | * | * | * | * | * | * | |||
| Self-employed (with no paid employees) | 5.9 | 6.5 | 5.2 | 5.8 | 5.7 | 5.4 | 6.7 | |||||
| Total self employed | 7.7 | 8.1 | 6.5 | 8.4 | 8.2 | 8.0 | 8.3 | |||||
| Employee | 140.3 | 140.1 | 140.0 | 139.1 | 141.8 | 146.1 | 145.2 | |||||
| Assisting relative | * | * | * | * | * | * | * | |||||
| Total | 148.1 | 148.2 | 146.6 | 147.5 | 150.3 | 154.2 | 153.9 | |||||
| Q | Human health and social work activities | Self-employed (with paid employees) | 5.1 | 5.0 | 6.2 | 6.1 | 4.9 | 4.8 | [4.5] | |||
| Self-employed (with no paid employees) | 8.9 | 6.8 | 8.4 | 7.3 | 7.8 | 8.1 | 8.2 | |||||
| Total self employed | 13.9 | 11.8 | 14.6 | 13.4 | 12.7 | 12.9 | 12.7 | |||||
| Employee | 219.9 | 222.3 | 223.8 | 232.4 | 230.3 | 232.4 | 234.6 | |||||
| Assisting relative | * | * | * | * | * | * | * | |||||
| Total | 234.6 | 235.1 | 239.6 | 247.5 | 244.3 | 246.5 | 248.7 | |||||
| R-U | Other NACE activities | Self-employed (with paid employees) | 6.6 | 5.8 | 5.6 | 6.2 | 5.8 | 6.1 | 6.6 | |||
| Self-employed (with no paid employees) | 14.7 | 16.1 | 14.6 | 17.0 | 19.2 | 19.4 | 20.6 | |||||
| Total self employed | 21.2 | 21.9 | 20.1 | 23.2 | 25.0 | 25.4 | 27.2 | |||||
| Employee | 70.9 | 76.9 | 77.8 | 75.6 | 72.6 | 76.7 | 76.0 | |||||
| Assisting relative | * | * | * | * | * | * | * | |||||
| Total | 93.5 | 99.4 | 98.5 | 99.8 | 98.6 | 103.0 | 104.1 | |||||
| Not stated | Self-employed (with paid employees) | * | * | * | * | * | * | * | ||||
| Self-employed (with no paid employees) | * | * | * | * | * | * | * | |||||
| Total self employed | * | * | * | * | * | * | * | |||||
| Employee | 7.8 | 6.2 | * | * | * | * | [5.9] | |||||
| Assisting relative | * | * | * | * | * | * | * | |||||
| Total | 8.1 | 6.9 | * | * | * | * | [6.3] | |||||
| All persons | Self-employed (with paid employees) | 100.5 | 92.0 | 91.4 | 88.2 | 87.2 | 89.6 | 92.5 | ||||
| Self-employed (with no paid employees) | 208.0 | 202.3 | 199.5 | 215.3 | 231.1 | 229.2 | 233.0 | |||||
| Total self employed | 308.5 | 294.3 | 290.9 | 303.4 | 318.4 | 318.8 | 325.5 | |||||
| Employee | 1,569.2 | 1,535.9 | 1,523.0 | 1,527.3 | 1,555.5 | 1,598.6 | 1,636.4 | |||||
| Assisting relative | 14.2 | 11.7 | 11.2 | 14.9 | 14.3 | 12.2 | 14.5 | |||||
| Total | 1,891.9 | 1,841.8 | 1,825.0 | 1,845.6 | 1,888.2 | 1,929.5 | 1,976.5 | |||||
| Table 5 Persons aged 15 years and over in employment (ILO) classified by occupational group (UK SOC2010) and employment status | ||||||||||||
| '000 | ||||||||||||
| Occupational group/Employment status | Q1 10 | Q1 11 | Q1 12 | Q1 13 | Q1 14 | Q1 15 | Q1 16 | |||||
| a. Managers, directors and senior officials | Self-employed (with paid employees) | 32.8 | 33.0 | 39.4 | 38.6 | 35.9 | 37.0 | 38.9 | ||||
| Self-employed (with no paid employees) | 15.4 | 16.2 | 16.6 | 23.4 | 24.7 | 22.5 | 19.8 | |||||
| Total self employed | 48.3 | 49.2 | 56.0 | 62.0 | 60.6 | 59.4 | 58.7 | |||||
| Employee | 93.8 | 91.5 | 90.8 | 87.2 | 93.6 | 96.3 | 104.6 | |||||
| Assisting relative | * | * | * | * | * | * | * | |||||
| Total | 142.5 | 141.1 | 147.1 | 149.8 | 154.8 | 156.3 | 164.1 | |||||
| b. Professional | Self-employed (with paid employees) | 16.8 | 16.3 | 14.7 | 14.8 | 14.6 | 14.0 | 13.8 | ||||
| Self-employed (with no paid employees) | 24.5 | 25.2 | 26.2 | 25.9 | 23.9 | 24.4 | 26.1 | |||||
| Total self employed | 41.3 | 41.5 | 40.8 | 40.7 | 38.5 | 38.4 | 40.0 | |||||
| Employee | 300.2 | 297.8 | 300.2 | 312.9 | 312.1 | 306.0 | 316.7 | |||||
| Assisting relative | * | * | * | * | * | * | * | |||||
| Total | 341.8 | 339.5 | 341.5 | 354.3 | 351.0 | 345.2 | 357.2 | |||||
| c. Associate professional and technical | Self-employed (with paid employees) | 6.5 | 6.4 | 5.3 | 4.6 | 4.7 | 4.9 | [4.5] | ||||
| Self-employed (with no paid employees) | 22.8 | 25.9 | 25.1 | 26.0 | 28.0 | 27.4 | 28.9 | |||||
| Total self employed | 29.3 | 32.2 | 30.5 | 30.6 | 32.8 | 32.2 | 33.4 | |||||
| Employee | 174.0 | 177.7 | 189.5 | 182.9 | 187.4 | 193.3 | 198.8 | |||||
| Assisting relative | * | * | * | * | * | * | * | |||||
| Total | 203.7 | 210.3 | 220.0 | 213.9 | 220.7 | 226.1 | 232.6 | |||||
| d. Administrative and secreterial | Self-employed (with paid employees) | * | [2.2] | * | * | * | * | * | ||||
| Self-employed (with no paid employees) | 3.7 | [3.2] | [2.8] | * | [3.2] | * | [3.5] | |||||
| Total self employed | 5.6 | 5.4 | 4.6 | [3.1] | 4.9 | [3.9] | 6.0 | |||||
| Employee | 235.0 | 214.2 | 201.6 | 196.4 | 201.2 | 200.9 | 199.0 | |||||
| Assisting relative | [2.6] | * | * | * | * | * | * | |||||
| Total | 243.2 | 221.7 | 207.9 | 201.8 | 208.8 | 206.6 | 206.8 | |||||
| e. Skilled trades | Self-employed (with paid employees) | 27.2 | 20.7 | 20.2 | 19.6 | 20.2 | 23.3 | 23.3 | ||||
| Self-employed (with no paid employees) | 97.3 | 92.1 | 90.3 | 99.1 | 109.8 | 111.5 | 112.6 | |||||
| Total self employed | 124.5 | 112.8 | 110.4 | 118.7 | 130.0 | 134.8 | 135.9 | |||||
| Employee | 168.3 | 150.2 | 146.5 | 145.5 | 162.5 | 173.3 | 177.9 | |||||
| Assisting relative | 4.1 | 4.7 | 4.1 | 5.1 | [3.7] | [3.9] | [4.3] | |||||
| Total | 296.9 | 267.6 | 261.0 | 269.2 | 296.2 | 312.1 | 318.1 | |||||
| f. Caring, leisure and other service | Self-employed (with paid employees) | 4.8 | [3.5] | 4.3 | [3.1] | [3.2] | [4.0] | * | ||||
| Self-employed (with no paid employees) | 7.1 | 6.2 | 6.2 | 5.9 | 8.0 | 7.9 | 9.8 | |||||
| Total self employed | 11.9 | 9.7 | 10.5 | 9.0 | 11.3 | 11.9 | 12.8 | |||||
| Employee | 133.0 | 135.1 | 133.4 | 132.6 | 130.3 | 144.3 | 144.6 | |||||
| Assisting relative | * | * | * | * | * | * | * | |||||
| Total | 146.4 | 145.9 | 145.1 | 143.0 | 142.9 | 157.3 | 159.1 | |||||
| g. Sales and customer service | Self-employed (with paid employees) | [2.7] | [2.5] | * | * | * | * | * | ||||
| Self-employed (with no paid employees) | 5.5 | 4.2 | [3.6] | 5.1 | 4.6 | [3.8] | [4.0] | |||||
| Total self employed | 8.2 | 6.7 | 4.9 | 6.5 | 6.2 | [4.6] | 5.9 | |||||
| Employee | 148.9 | 151.5 | 152.5 | 154.9 | 147.4 | 157.3 | 153.8 | |||||
| Assisting relative | * | * | * | * | * | * | * | |||||
| Total | 158.7 | 158.7 | 157.7 | 162.0 | 154.4 | 162.4 | 161.0 | |||||
| h. Process, plant and machine operatives | Self-employed (with paid employees) | 3.9 | [3.9] | [3.0] | [3.2] | [3.5] | * | [3.5] | ||||
| Self-employed (with no paid employees) | 23.9 | 22.6 | 23.6 | 22.4 | 22.8 | 23.5 | 22.1 | |||||
| Total self employed | 27.8 | 26.5 | 26.6 | 25.6 | 26.4 | 26.2 | 25.6 | |||||
| Employee | 102.3 | 123.8 | 118.7 | 120.3 | 114.1 | 115.2 | 123.7 | |||||
| Assisting relative | * | * | * | * | * | * | * | |||||
| Total | 130.6 | 150.7 | 145.9 | 146.5 | 140.9 | 142.2 | 149.8 | |||||
| i. Elementary | Self-employed (with paid employees) | [3.7] | [3.2] | * | * | * | * | * | ||||
| Self-employed (with no paid employees) | 7.4 | 6.2 | 4.8 | 5.1 | 5.7 | 5.7 | [5.3] | |||||
| Total self employed | 11.1 | 9.3 | 6.0 | 6.6 | 7.1 | 6.9 | 6.3 | |||||
| Employee | 208.3 | 187.3 | 184.1 | 190.2 | 200.3 | 202.1 | 200.9 | |||||
| Assisting relative | [2.7] | * | [2.5] | [3.3] | [3.7] | * | * | |||||
| Total | 222.1 | 198.5 | 192.5 | 200.2 | 211.1 | 211.2 | 210.2 | |||||
| j. Not stated | Self-employed (with paid employees) | * | * | * | * | * | * | * | ||||
| Self-employed (with no paid employees) | * | * | * | * | * | * | * | |||||
| Total self employed | * | * | * | * | * | * | * | |||||
| Employee | 5.4 | 6.8 | 5.6 | 4.4 | 6.8 | 9.9 | 16.4 | |||||
| Assisting relative | * | * | * | * | * | * | * | |||||
| Total | 6.1 | 7.8 | 6.2 | 4.8 | 7.5 | 10.3 | 17.4 | |||||
| All persons | Self-employed (with paid employees) | 100.5 | 92.0 | 91.4 | 88.2 | 87.2 | 89.6 | 92.5 | ||||
| Self-employed (with no paid employees) | 208.0 | 202.3 | 199.5 | 215.3 | 231.1 | 229.2 | 233.0 | |||||
| Total self employed | 308.5 | 294.3 | 290.9 | 303.4 | 318.4 | 318.8 | 325.5 | |||||
| Employee | 1,569.2 | 1,535.9 | 1,523.0 | 1,527.3 | 1,555.5 | 1,598.6 | 1,636.4 | |||||
| Assisting relative | 14.2 | 11.7 | 11.2 | 14.9 | 14.3 | 12.2 | 14.5 | |||||
| Total | 1,891.9 | 1,841.8 | 1,825.0 | 1,845.6 | 1,888.2 | 1,929.5 | 1,976.5 | |||||
| Table 6 Persons aged 15 years and over in employment (ILO) classified by NACE Rev. 2 Economic Sector and full-time/part-time status | |||||||||||
| '000 | |||||||||||
| NACE Rev.2 Economic Sector/Full and part-time status | Q1 10 | Q1 11 | Q1 12 | Q1 13 | Q1 14 | Q1 15 | Q1 16 | ||||
| A | Agriculture, forestry and fishing | Full-time | 69.7 | 71.9 | 67.2 | 79.7 | 92.1 | 93.1 | 90.7 | ||
| Part-time | 10.8 | 11.3 | 13.3 | 16.4 | 18.5 | 14.7 | 18.6 | ||||
| Total | 80.5 | 83.2 | 80.5 | 96.2 | 110.5 | 107.8 | 109.3 | ||||
| B-F | Total Industry | Full-time | 332.9 | 306.5 | 298.6 | 288.3 | 293.5 | 325.6 | 334.9 | ||
| Part-time | 44.2 | 40.4 | 40.7 | 46.1 | 45.7 | 42.6 | 46.5 | ||||
| Total | 377.1 | 346.9 | 339.3 | 334.3 | 339.3 | 368.2 | 381.4 | ||||
| B-E | Industry | Full-time | 221.0 | 214.7 | 214.2 | 212.9 | 213.8 | 223.5 | 226.5 | ||
| Part-time | 25.5 | 23.7 | 21.9 | 25.1 | 23.2 | 22.8 | 23.5 | ||||
| Total | 246.5 | 238.4 | 236.0 | 238.0 | 237.0 | 246.3 | 250.0 | ||||
| F | Construction | Full-time | 111.9 | 91.8 | 84.5 | 75.4 | 79.7 | 102.1 | 108.3 | ||
| Part-time | 18.8 | 16.7 | 18.8 | 21.0 | 22.5 | 19.8 | 23.0 | ||||
| Total | 130.6 | 108.5 | 103.3 | 96.3 | 102.3 | 121.8 | 131.3 | ||||
| G-U | Total Services | Full-time | 1,057.9 | 1,018.3 | 1,028.1 | 1,022.3 | 1,051.6 | 1,068.3 | 1,089.6 | ||
| Part-time | 368.3 | 386.5 | 375.2 | 391.2 | 386.1 | 382.2 | 390.0 | ||||
| Total | 1,426.2 | 1,404.8 | 1,403.3 | 1,413.5 | 1,437.7 | 1,450.5 | 1,479.6 | ||||
| G | Wholesale and retail trade; repair of motor vehicles and motorcycles | Full-time | 183.8 | 173.8 | 181.1 | 177.8 | 177.8 | 180.5 | 180.3 | ||
| Part-time | 91.5 | 97.4 | 90.2 | 96.3 | 90.4 | 90.0 | 92.2 | ||||
| Total | 275.3 | 271.3 | 271.3 | 274.1 | 268.2 | 270.5 | 272.5 | ||||
| H | Transportation and storage | Full-time | 80.6 | 80.7 | 75.9 | 74.5 | 76.9 | 76.4 | 79.3 | ||
| Part-time | 13.2 | 13.9 | 14.3 | 14.3 | 12.5 | 14.3 | 15.7 | ||||
| Total | 93.7 | 94.6 | 90.2 | 88.8 | 89.5 | 90.7 | 95.0 | ||||
| I | Accommodation and food service activities | Full-time | 80.0 | 64.4 | 69.0 | 67.4 | 76.6 | 78.6 | 87.4 | ||
| Part-time | 51.1 | 46.3 | 48.6 | 52.9 | 57.1 | 53.7 | 55.0 | ||||
| Total | 131.1 | 110.7 | 117.6 | 120.3 | 133.8 | 132.3 | 142.4 | ||||
| J | Information and communication | Full-time | 68.1 | 66.2 | 71.8 | 70.7 | 74.9 | 75.4 | 79.1 | ||
| Part-time | 8.0 | 6.4 | 6.7 | 6.6 | 5.8 | 6.4 | 6.1 | ||||
| Total | 76.1 | 72.6 | 78.5 | 77.4 | 80.7 | 81.8 | 85.2 | ||||
| K-L | Financial, insurance and real estate activities | Full-time | 92.1 | 87.5 | 88.5 | 87.1 | 86.0 | 89.8 | 91.1 | ||
| Part-time | 12.3 | 12.2 | 12.4 | 12.6 | 11.8 | 12.5 | 9.6 | ||||
| Total | 104.4 | 99.7 | 101.0 | 99.7 | 97.8 | 102.3 | 100.7 | ||||
| M | Professional, scientific and technical activities | Full-time | 87.5 | 86.7 | 81.8 | 87.4 | 98.3 | 93.7 | 92.7 | ||
| Part-time | 15.3 | 16.9 | 16.1 | 16.5 | 17.3 | 15.5 | 17.6 | ||||
| Total | 102.8 | 103.6 | 98.0 | 103.9 | 115.7 | 109.3 | 110.3 | ||||
| N | Administrative and support service activities | Full-time | 41.2 | 43.2 | 42.3 | 37.5 | 42.7 | 42.0 | 44.2 | ||
| Part-time | 20.3 | 21.7 | 20.2 | 22.0 | 19.8 | 20.0 | 24.0 | ||||
| Total | 61.5 | 64.9 | 62.5 | 59.5 | 62.5 | 62.1 | 68.2 | ||||
| O | Public administration and defence; compulsory social security | Full-time | 94.4 | 92.7 | 87.4 | 85.9 | 86.3 | 86.4 | 85.2 | ||
| Part-time | 10.7 | 11.9 | 12.0 | 9.3 | 10.1 | 11.5 | 13.3 | ||||
| Total | 105.1 | 104.5 | 99.5 | 95.2 | 96.4 | 97.8 | 98.5 | ||||
| P | Education | Full-time | 116.1 | 111.2 | 110.3 | 110.0 | 112.3 | 117.6 | 117.8 | ||
| Part-time | 32.0 | 37.1 | 36.4 | 37.5 | 38.0 | 36.7 | 36.1 | ||||
| Total | 148.1 | 148.2 | 146.6 | 147.5 | 150.3 | 154.2 | 153.9 | ||||
| Q | Human health and social work activities | Full-time | 157.5 | 151.8 | 159.5 | 165.1 | 161.3 | 165.1 | 168.5 | ||
| Part-time | 77.2 | 83.3 | 80.1 | 82.3 | 83.0 | 81.4 | 80.1 | ||||
| Total | 234.6 | 235.1 | 239.6 | 247.5 | 244.3 | 246.5 | 248.7 | ||||
| R-U | Other NACE activities | Full-time | 56.7 | 60.1 | 60.4 | 58.8 | 58.5 | 62.8 | 63.8 | ||
| Part-time | 36.8 | 39.4 | 38.1 | 40.9 | 40.2 | 40.2 | 40.3 | ||||
| Total | 93.5 | 99.4 | 98.5 | 99.8 | 98.6 | 103.0 | 104.1 | ||||
| Not stated | Full-time | 6.3 | 5.0 | * | * | * | * | [5.2] | |||
| Part-time | * | * | * | * | * | * | * | ||||
| Total | 8.1 | 6.9 | * | * | * | * | [6.3] | ||||
| Total | Full-time | 1,466.8 | 1,401.8 | 1,394.8 | 1,391.1 | 1,437.5 | 1,489.6 | 1,520.3 | |||
| Part-time | 425.1 | 440.0 | 430.2 | 454.4 | 450.7 | 439.9 | 456.2 | ||||
| Total | 1,891.9 | 1,841.8 | 1,825.0 | 1,845.6 | 1,888.2 | 1,929.5 | 1,976.5 | ||||
| Table 7 Persons aged 15 years and over in employment (ILO) classified by occupational group (UK SOC2010) and full-time/part-time status | ||||||||||
| '000 | ||||||||||
| Occupational group/Full and part-time status | Q1 10 | Q1 11 | Q1 12 | Q1 13 | Q1 14 | Q1 15 | Q1 16 | |||
| 1. | Managers, directors and senior officials | Full-time | 132.3 | 129.2 | 135.8 | 137.0 | 142.4 | 144.1 | 153.6 | |
| Part-time | 10.2 | 12.0 | 11.4 | 12.7 | 12.4 | 12.2 | 10.6 | |||
| Total | 142.5 | 141.1 | 147.1 | 149.8 | 154.8 | 156.3 | 164.1 | |||
| 2. | Professional | Full-time | 296.5 | 291.5 | 293.1 | 303.2 | 300.9 | 294.9 | 310.6 | |
| Part-time | 45.3 | 47.9 | 48.4 | 51.0 | 50.1 | 50.3 | 46.6 | |||
| Total | 341.8 | 339.5 | 341.5 | 354.3 | 351.0 | 345.2 | 357.2 | |||
| 3. | Associate professional and technical | Full-time | 173.4 | 179.2 | 192.4 | 184.0 | 188.8 | 194.5 | 197.6 | |
| Part-time | 30.3 | 31.1 | 27.6 | 30.0 | 31.9 | 31.5 | 34.9 | |||
| Total | 203.7 | 210.3 | 220.0 | 213.9 | 220.7 | 226.1 | 232.6 | |||
| 4. | Administrative and secreterial | Full-time | 176.8 | 154.0 | 146.4 | 146.3 | 148.8 | 148.0 | 142.0 | |
| Part-time | 66.4 | 67.6 | 61.6 | 55.5 | 59.9 | 58.6 | 64.8 | |||
| Total | 243.2 | 221.7 | 207.9 | 201.8 | 208.8 | 206.6 | 206.8 | |||
| 5. | Skilled trades | Full-time | 258.7 | 232.0 | 223.1 | 225.1 | 251.8 | 269.7 | 271.7 | |
| Part-time | 38.2 | 35.7 | 37.9 | 44.2 | 44.4 | 42.3 | 46.4 | |||
| Total | 296.9 | 267.6 | 261.0 | 269.2 | 296.2 | 312.1 | 318.1 | |||
| 6. | Caring, leisure and other services | Full-time | 84.7 | 78.5 | 80.0 | 76.9 | 77.0 | 89.2 | 91.8 | |
| Part-time | 61.7 | 67.4 | 65.0 | 66.1 | 65.9 | 68.1 | 67.3 | |||
| Total | 146.4 | 145.9 | 145.1 | 143.0 | 142.9 | 157.3 | 159.1 | |||
| 7. | Sales and customer service | Full-time | 82.8 | 79.0 | 79.5 | 77.7 | 80.7 | 89.1 | 88.3 | |
| Part-time | 75.9 | 79.8 | 78.2 | 84.3 | 73.7 | 73.3 | 72.7 | |||
| Total | 158.7 | 158.7 | 157.7 | 162.0 | 154.4 | 162.4 | 161.0 | |||
| 8. | Process, plant and machine operatives | Full-time | 113.3 | 130.9 | 123.9 | 121.9 | 119.3 | 122.5 | 124.5 | |
| Part-time | 17.3 | 19.8 | 22.0 | 24.6 | 21.6 | 19.7 | 25.3 | |||
| Total | 130.6 | 150.7 | 145.9 | 146.5 | 140.9 | 142.2 | 149.8 | |||
| 9. | Elementary | Full-time | 143.7 | 121.6 | 115.6 | 115.0 | 121.7 | 128.7 | 125.7 | |
| Part-time | 78.5 | 76.9 | 76.9 | 85.2 | 89.4 | 82.5 | 84.5 | |||
| Total | 222.1 | 198.5 | 192.5 | 200.2 | 211.1 | 211.2 | 210.2 | |||
| Other/Not stated | Full-time | 4.5 | 5.9 | 5.0 | [4.0] | 6.1 | 8.9 | 14.5 | ||
| Part-time | * | * | * | * | * | * | * | |||
| Total | 6.1 | 7.8 | 6.2 | 4.8 | 7.5 | 10.3 | 17.4 | |||
| Total | Full-time | 1,466.8 | 1,401.8 | 1,394.8 | 1,391.1 | 1,437.5 | 1,489.6 | 1,520.3 | ||
| Part-time | 425.1 | 440.0 | 430.2 | 454.4 | 450.7 | 439.9 | 456.2 | |||
| Total | 1,891.9 | 1,841.8 | 1,825.0 | 1,845.6 | 1,888.2 | 1,929.5 | 1,976.5 | |||
| Table 8 Average usual hours worked per week for persons aged 15 years and over in employment (ILO) classified by NACE Rev. 2 Economic Sector | |||||||||||||
| Average usual hours worked per week | |||||||||||||
| NACE Rev.2 Economic Sector | Q1 10 | Q1 11 | Q1 12 | Q1 13 | Q1 14 | Q1 15 | Q1 16 | ||||||
| A | Agriculture, forestry and fishing | 50.0 | 49.0 | 48.6 | 47.7 | 47.1 | 50.4 | 49.1 | |||||
| B-F | Total Industry | 37.7 | 38.1 | 38.2 | 38.2 | 38.3 | 38.7 | 38.6 | |||||
| B-E | Industry | 37.8 | 38.2 | 38.5 | 38.6 | 38.7 | 38.9 | 38.7 | |||||
| F | Construction | 37.5 | 37.9 | 37.5 | 37.1 | 37.0 | 38.5 | 38.4 | |||||
| G-U | Total Services | 33.7 | 33.3 | 33.6 | 33.8 | 34.2 | 34.2 | 34.4 | |||||
| G | Wholesale and retail trade; repair of motor vehicles and motorcycles | 32.9 | 32.6 | 33.2 | 33.0 | 33.6 | 33.3 | 33.5 | |||||
| H | Transportation and storage | 39.1 | 39.0 | 38.8 | 38.5 | 38.4 | 38.5 | 39.7 | |||||
| I | Accommodation and food service activities | 32.1 | 30.8 | 31.6 | 31.1 | 31.6 | 31.9 | 32.2 | |||||
| J | Information and communication | 38.4 | 39.2 | 39.3 | 39.1 | 39.5 | 39.6 | 39.9 | |||||
| K-L | Financial, insurance and real estate activities | 37.6 | 37.3 | 37.7 | 37.9 | 37.9 | 38.0 | 38.4 | |||||
| M | Professional, scientific and technical activities | 38.1 | 38.3 | 38.1 | 38.7 | 38.3 | 38.6 | 38.7 | |||||
| N | Administrative and support service activities | 32.4 | 32.2 | 32.2 | 31.8 | 33.2 | 32.3 | 32.6 | |||||
| O | Public administration and defence; compulsory social security | 36.3 | 36.3 | 35.9 | 37.0 | 37.7 | 37.3 | 37.1 | |||||
| P | Education | 28.9 | 27.8 | 28.5 | 28.8 | 29.7 | 29.7 | 29.4 | |||||
| Q | Human health and social work activities | 31.7 | 31.2 | 31.7 | 32.1 | 32.4 | 32.8 | 32.7 | |||||
| R-U | Other NACE activities | 30.7 | 30.4 | 30.6 | 30.9 | 31.6 | 31.0 | 31.2 | |||||
| Not stated | 34.0 | 33.8 | * | * | * | * | [36.1] | ||||||
| Total | 34.9 | 34.7 | 34.9 | 35.0 | 35.5 | 35.7 | 35.8 | ||||||
| Table 9 Average usual hours worked per week for persons aged 15 years and over in employment (ILO) classified by occupational group (UK SOC2010) | ||||||||||
| Average usual hours worked per week | ||||||||||
| Occupational group | Q1 10 | Q1 11 | Q1 12 | Q1 13 | Q1 14 | Q1 15 | Q1 16 | |||
| 1. | Managers, directors and senior officials | 41.9 | 41.9 | 42.7 | 41.9 | 42.3 | 42.6 | 43.0 | ||
| 2. | Professional | 35.1 | 34.9 | 35.2 | 35.6 | 35.9 | 35.8 | 36.1 | ||
| 3. | Associate professional and technical | 37.2 | 37.2 | 37.9 | 37.8 | 37.9 | 37.7 | 37.6 | ||
| 4. | Administrative and secreterial | 32.8 | 32.0 | 32.1 | 32.9 | 33.2 | 33.0 | 32.5 | ||
| 5. | Skilled trades | 40.1 | 40.4 | 40.4 | 40.3 | 40.9 | 41.8 | 41.6 | ||
| 6. | Caring, leisure and other services | 28.9 | 28.2 | 28.4 | 28.9 | 29.1 | 29.8 | 30.0 | ||
| 7. | Sales and customer service | 28.6 | 28.4 | 28.3 | 28.5 | 29.6 | 29.7 | 29.9 | ||
| 8. | Process, plant and machine operatives | 38.6 | 38.5 | 38.0 | 37.8 | 38.0 | 38.4 | 38.2 | ||
| 9. | Elementary | 31.8 | 30.6 | 30.5 | 30.4 | 30.6 | 30.9 | 30.7 | ||
| Other/Not stated | 34.5 | 35.0 | 36.6 | [35.8] | 37.4 | 38.0 | 35.9 | |||
| Total | 34.9 | 34.7 | 34.9 | 35.0 | 35.5 | 35.7 | 35.8 | |||
| Table 10 Average usual hours worked per week for persons aged 15 years and over in employment (ILO) classified by employment status | |||||||||||
| Average usual hours worked per week | |||||||||||
| Employment status | Q1 10 | Q1 11 | Q1 12 | Q1 13 | Q1 14 | Q1 15 | Q1 16 | ||||
| Self-employed (with paid employees) | 46.4 | 46.7 | 47.1 | 44.7 | 45.8 | 48.1 | 48.8 | ||||
| Self-employed (with no paid employees) | 41.3 | 41.3 | 41.4 | 41.4 | 42.0 | 43.0 | 42.0 | ||||
| Total self employed | 43.2 | 43.3 | 43.4 | 42.5 | 43.2 | 44.6 | 44.0 | ||||
| Employee | 33.9 | 33.6 | 33.8 | 34.1 | 34.5 | 34.5 | 34.6 | ||||
| Assisting relative | 33.2 | 29.6 | 30.1 | 29.7 | 26.9 | 29.0 | 27.6 | ||||
| Total | 34.9 | 34.7 | 34.9 | 35.0 | 35.5 | 35.7 | 35.8 | ||||
| Table 11 Average usual hours worked per week for persons aged 15 years and over in employment (ILO) classified by full-time/part-time status | |||||||||||
| Average usual hours worked per week | |||||||||||
| Full and part-time status | Q1 10 | Q1 11 | Q1 12 | Q1 13 | Q1 14 | Q1 15 | Q1 16 | ||||
| Full-time | 39.5 | 39.6 | 39.7 | 39.9 | 40.2 | 40.3 | 40.5 | ||||
| Part-time | 18.6 | 18.6 | 18.8 | 19.1 | 19.3 | 19.3 | 19.3 | ||||
| Total | 34.9 | 34.7 | 34.9 | 35.0 | 35.5 | 35.7 | 35.8 | ||||
| Table 12 Persons aged 15 years and over in employment (ILO) classified by detailed duration of employment | |||||||||
| '000 | |||||||||
| Detailed duration of employment | Q1 10 | Q1 11 | Q1 12 | Q1 13 | Q1 14 | Q1 15 | Q1 16 | ||
| Less than 3 months | 47.3 | 51.3 | 56.9 | 60.3 | 63.3 | 64.3 | 67.2 | ||
| 3-5 months | 58.6 | 72.8 | 63.2 | 74.0 | 75.3 | 80.3 | 81.7 | ||
| 6-11 months | 77.4 | 84.9 | 94.4 | 96.1 | 107.4 | 116.2 | 128.0 | ||
| Total less than 1 year | 183.3 | 209.1 | 214.5 | 230.4 | 246.0 | 260.8 | 276.9 | ||
| 12-17 months | 85.3 | 72.5 | 78.7 | 84.4 | 90.9 | 92.0 | 109.3 | ||
| 18-23 months | 77.6 | 46.0 | 49.9 | 52.9 | 59.2 | 54.9 | 68.0 | ||
| 24-47 months | 224.9 | 175.3 | 148.5 | 145.4 | 136.0 | 153.4 | 159.1 | ||
| 48 months and greater | 1,293.0 | 1,307.8 | 1,301.9 | 1,298.6 | 1,304.3 | 1,314.4 | 1,289.0 | ||
| Total 1 year and over | 1,680.8 | 1,601.7 | 1,578.9 | 1,581.3 | 1,590.4 | 1,614.7 | 1,625.5 | ||
| Not stated | 27.8 | 31.1 | 31.6 | 33.8 | 51.8 | 54.1 | 74.1 | ||
| Total | 1,891.9 | 1,841.8 | 1,825.0 | 1,845.6 | 1,888.2 | 1,929.5 | 1,976.5 | ||
 Show Table 13 Persons aged 15 years and over in employment (ILO) classified by detailed size of firm
| Table 13 Persons aged 15 years and over in employment (ILO) classified by detailed size of firm | |||||||||||
| '000 | |||||||||||
| Detailed size of firm | Q1 10 | Q1 11 | Q1 12 | Q1 13 | Q1 14 | Q1 15 | Q1 16 | ||||
| 1 to 4 persons | 258.2 | 245.3 | 234.5 | 232.1 | 222.8 | 225.2 | 210.5 | ||||
| 5 to 10 persons | 268.1 | 244.7 | 242.5 | 230.8 | 226.7 | 222.9 | 227.0 | ||||
| Not sure but less than 11 persons | * | * | * | * | * | [2.8] | * | ||||
| Total less than 11 persons | 527.7 | 490.6 | 477.9 | 464.9 | 452.2 | 450.9 | 440.1 | ||||
| 11 to 19 persons | 171.8 | 170.9 | 160.8 | 144.2 | 136.9 | 144.9 | 155.5 | ||||
| 20-49 persons | 245.6 | 233.8 | 222.4 | 241.9 | 242.0 | 237.9 | 243.0 | ||||
| Total 11 to 49 persons | 417.4 | 404.6 | 383.2 | 386.2 | 378.9 | 382.8 | 398.5 | ||||
| Total less than 50 persons | 945.1 | 895.3 | 861.1 | 851.1 | 831.0 | 833.7 | 838.6 | ||||
| 50-99 persons | 159.4 | 157.7 | 159.9 | 146.7 | 153.4 | 155.3 | 161.2 | ||||
| 100 to 249 persons | : | : | : | 168.5 | 166.5 | 164.0 | 159.2 | ||||
| Total 50 to 249 persons | : | : | : | 315.2 | 319.9 | 319.3 | 320.5 | ||||
| 250 to 500 persons | : | : | : | 109.7 | 114.2 | 118.1 | 117.4 | ||||
| Total 100 to 500 persons | 266.6 | 264.8 | 276.3 | 278.2 | 280.7 | 282.1 | 276.7 | ||||
| 500 persons or more | 201.2 | 201.0 | 194.0 | 190.5 | 189.7 | 191.1 | 217.2 | ||||
| Total 50 persons or more | 627.2 | 623.5 | 630.2 | 615.4 | 623.8 | 628.4 | 655.1 | ||||
| Not stated | 111.5 | 120.7 | 134.2 | 163.8 | 202.3 | 238.3 | 249.8 | ||||
| Not applicable - Self-employed person with no employees | 208.0 | 202.3 | 199.5 | 215.3 | 231.1 | 229.2 | 233.0 | ||||
| Total | 1,891.9 | 1,841.8 | 1,825.0 | 1,845.6 | 1,888.2 | 1,929.5 | 1,976.5 | ||||
| : Data not available | |||||||||||
| Note: There is a varying level of detail available over time due to question changes | |||||||||||
| Table 14 Persons aged 15 years and over in full and part-time employment (ILO) classified by reasons for being in part-time employment | |||||||||||
| '000 | |||||||||||
| Full-time employment/Reasons for part-time employment | Q1 10 | Q1 11 | Q1 12 | Q1 13 | Q1 14 | Q1 15 | Q1 16 | ||||
| Full-time | 1,466.8 | 1,401.8 | 1,394.8 | 1,391.1 | 1,437.5 | 1,489.6 | 1,520.3 | ||||
| Part-time | 425.1 | 440.0 | 430.2 | 454.4 | 450.7 | 439.9 | 456.2 | ||||
| of which: | Person is undergoing school education or training | 58.6 | 55.2 | 49.6 | 53.5 | 50.3 | 51.2 | 56.1 | |||
| Of own illness or disability | 5.0 | 5.5 | 5.9 | 5.3 | 4.8 | 7.0 | 7.0 | ||||
| Looking after children or incapacitated adults | 66.9 | 59.7 | 55.4 | 62.4 | 69.9 | 74.0 | 78.0 | ||||
| Other personal or family reasons | 103.7 | 108.3 | 91.1 | 80.5 | 77.5 | 88.1 | 108.4 | ||||
| Person could not find a full-time job | 110.4 | 142.0 | 157.4 | 173.1 | 174.9 | 158.8 | 141.4 | ||||
| Of other reasons | 44.2 | 42.2 | 42.8 | 44.9 | 43.4 | 36.1 | 43.7 | ||||
| No answer | 36.4 | 27.0 | 27.9 | 34.6 | 30.0 | 24.7 | 21.5 | ||||
| Total | 1,891.9 | 1,841.8 | 1,825.0 | 1,845.6 | 1,888.2 | 1,929.5 | 1,976.5 | ||||
| Table 15 Employees aged 15 years and over in employment (ILO) classified by NACE Rev. 2 Economic Sector and permanency of employment | |||||||||||
| '000 | |||||||||||
| NACE Rev.2 Economic Sector/Permanency of employment | Q1 10 | Q1 11 | Q1 12 | Q1 13 | Q1 14 | Q1 15 | Q1 16 | ||||
| A | Agriculture, forestry and fishing | Permanent employees | 11.6 | 16.4 | 13.6 | 17.5 | 20.4 | 20.4 | 20.0 | ||
| Temporary employees | * | * | * | * | * | * | * | ||||
| Not stated | * | * | * | * | * | * | * | ||||
| Total employees | 12.6 | 18.2 | 16.0 | 20.0 | 23.8 | 23.1 | 22.9 | ||||
| B-F | Total Industry | Permanent employees | 282.6 | 265.5 | 252.8 | 245.5 | 251.1 | 271.5 | 282.3 | ||
| Temporary employees | 17.5 | 18.8 | 23.0 | 22.9 | 22.0 | 26.0 | 22.7 | ||||
| Not stated | [2.9] | * | [3.7] | [4.3] | 4.8 | [4.4] | 6.7 | ||||
| Total employees | 302.9 | 286.8 | 279.4 | 272.7 | 278.0 | 301.8 | 311.7 | ||||
| B-E | Industry | Permanent employees | 211.8 | 207.3 | 198.4 | 199.3 | 197.7 | 207.8 | 212.9 | ||
| Temporary employees | 9.7 | 11.5 | 14.3 | 15.4 | 15.8 | 16.9 | 12.9 | ||||
| Not stated | * | * | * | * | * | * | * | ||||
| Total employees | 222.8 | 220.3 | 214.5 | 216.4 | 215.4 | 225.9 | 227.6 | ||||
| F | Construction | Permanent employees | 70.8 | 58.2 | 54.4 | 46.2 | 53.4 | 63.7 | 69.4 | ||
| Temporary employees | 7.8 | 7.4 | 8.7 | 7.5 | 6.3 | 9.1 | 9.8 | ||||
| Not stated | * | * | * | [2.7] | [2.9] | [3.1] | [5.0] | ||||
| Total employees | 80.2 | 66.6 | 64.9 | 56.3 | 62.5 | 75.9 | 84.2 | ||||
| G-U | Total Services | Permanent employees | 1,116.5 | 1,085.1 | 1,082.6 | 1,100.5 | 1,120.1 | 1,151.3 | 1,180.1 | ||
| Temporary employees | 120.3 | 129.2 | 131.9 | 119.7 | 117.7 | 105.7 | 100.7 | ||||
| Not stated | 9.1 | 10.3 | 11.3 | 12.9 | 15.4 | 14.2 | 15.0 | ||||
| Total employees | 1,245.8 | 1,224.6 | 1,225.7 | 1,233.2 | 1,253.1 | 1,271.2 | 1,295.9 | ||||
| G | Wholesale and retail trade; repair of motor vehicles and motorcycles | Permanent employees | 213.3 | 205.3 | 209.5 | 213.0 | 208.8 | 211.1 | 218.1 | ||
| Temporary employees | 23.1 | 26.3 | 25.1 | 23.1 | 19.9 | 22.3 | 19.1 | ||||
| Not stated | * | * | * | * | * | * | * | ||||
| Total employees | 237.2 | 233.0 | 235.9 | 237.7 | 230.7 | 234.9 | 239.2 | ||||
| H | Transportation and storage | Permanent employees | 64.9 | 64.9 | 60.8 | 62.1 | 62.1 | 63.5 | 67.7 | ||
| Temporary employees | [3.7] | 5.0 | 5.1 | [3.8] | [4.0] | [4.2] | [3.4] | ||||
| Not stated | * | * | * | * | * | * | * | ||||
| Total employees | 68.6 | 70.0 | 66.2 | 66.9 | 66.4 | 67.8 | 71.3 | ||||
| I | Accommodation and food service activities | Permanent employees | 96.6 | 80.8 | 83.7 | 92.1 | 100.3 | 102.4 | 111.3 | ||
| Temporary employees | 16.3 | 14.2 | 17.2 | 14.9 | 18.0 | 15.2 | 14.1 | ||||
| Not stated | * | * | * | * | * | * | * | ||||
| Total employees | 113.9 | 95.7 | 102.2 | 107.6 | 119.0 | 118.3 | 126.2 | ||||
| J | Information and communication | Permanent employees | 62.9 | 58.9 | 62.0 | 60.3 | 64.3 | 67.7 | 68.8 | ||
| Temporary employees | [2.9] | [2.8] | [4.2] | 5.7 | 4.6 | [3.3] | [4.9] | ||||
| Not stated | * | * | * | * | * | * | * | ||||
| Total employees | 66.4 | 61.8 | 66.7 | 66.2 | 69.2 | 71.4 | 74.5 | ||||
| K-L | Financial, insurance and real estate activities | Permanent employees | 94.4 | 87.8 | 89.2 | 87.2 | 84.8 | 88.2 | 89.3 | ||
| Temporary employees | [3.0] | [3.5] | [2.9] | [4.4] | 5.5 | [4.4] | * | ||||
| Not stated | * | * | * | * | * | * | * | ||||
| Total employees | 97.6 | 91.5 | 92.4 | 91.8 | 90.8 | 93.2 | 92.4 | ||||
| M | Professional, scientific and technical activities | Permanent employees | 67.3 | 67.0 | 62.0 | 63.7 | 76.4 | 72.8 | 75.2 | ||
| Temporary employees | 5.7 | 6.1 | 6.1 | 7.5 | 6.1 | 4.7 | [3.9] | ||||
| Not stated | * | * | * | * | * | * | * | ||||
| Total employees | 73.5 | 73.3 | 68.7 | 71.6 | 83.4 | 78.4 | 79.8 | ||||
| N | Administrative and support service activities | Permanent employees | 45.9 | 48.5 | 46.0 | 44.6 | 46.9 | 50.4 | 53.0 | ||
| Temporary employees | 6.0 | 6.5 | 6.2 | 4.7 | 5.6 | [4.6] | [5.5] | ||||
| Not stated | * | * | * | * | * | * | * | ||||
| Total employees | 53.1 | 56.2 | 53.2 | 50.6 | 53.5 | 55.6 | 59.7 | ||||
| O | Public administration and defence; compulsory social security | Permanent employees | 100.8 | 100.2 | 96.1 | 91.4 | 92.2 | 92.9 | 92.0 | ||
| Temporary employees | [3.1] | [3.6] | [2.7] | * | [2.7] | [3.0] | [3.8] | ||||
| Not stated | * | * | * | * | * | * | * | ||||
| Total employees | 104.3 | 103.8 | 98.8 | 93.8 | 95.5 | 96.6 | 96.9 | ||||
| P | Education | Permanent employees | 116.7 | 112.5 | 116.2 | 116.4 | 118.3 | 128.4 | 125.5 | ||
| Temporary employees | 23.0 | 25.5 | 22.8 | 21.3 | 21.5 | 16.0 | 17.5 | ||||
| Not stated | * | * | * | * | * | * | * | ||||
| Total employees | 140.3 | 140.1 | 140.0 | 139.1 | 141.8 | 146.1 | 145.2 | ||||
| Q | Human health and social work activities | Permanent employees | 195.7 | 197.9 | 196.7 | 207.9 | 206.0 | 211.9 | 213.9 | ||
| Temporary employees | 21.9 | 21.9 | 24.0 | 20.7 | 19.9 | 16.8 | 17.0 | ||||
| Not stated | [2.3] | [2.5] | [3.2] | [3.7] | 4.4 | [3.8] | [3.7] | ||||
| Total employees | 219.9 | 222.3 | 223.8 | 232.4 | 230.3 | 232.4 | 234.6 | ||||
| R-U | Other NACE activities | Permanent employees | 58.0 | 61.3 | 60.5 | 61.8 | 59.9 | 62.0 | 65.4 | ||
| Temporary employees | 11.7 | 13.9 | 15.5 | 11.7 | 9.8 | 11.4 | 8.6 | ||||
| Not stated | * | * | * | * | [2.9] | [3.3] | * | ||||
| Total employees | 70.9 | 76.9 | 77.8 | 75.6 | 72.6 | 76.7 | 76.0 | ||||
| Not stated | Permanent employees | 5.0 | 4.5 | * | * | * | * | * | |||
| Temporary employees | * | * | * | * | * | * | * | ||||
| Not stated | * | * | * | * | * | * | * | ||||
| Total employees | 7.8 | 6.2 | * | * | * | * | [5.9] | ||||
| Total | Permanent employees | 1,415.7 | 1,371.5 | 1,350.1 | 1,364.5 | 1,391.9 | 1,445.1 | 1,486.3 | |||
| Temporary employees | 139.6 | 150.7 | 157.1 | 145.1 | 142.5 | 134.7 | 126.4 | ||||
| Not stated | 13.9 | 13.7 | 15.8 | 17.7 | 21.1 | 18.7 | 23.7 | ||||
| Total employees | 1,569.2 | 1,535.9 | 1,523.0 | 1,527.3 | 1,555.5 | 1,598.6 | 1,636.4 | ||||
| Table 16 Employees aged 15 years and over in employment (ILO) classified by occupational group (UK SOC2010) and permanency of employment | ||||||||||||
| '000 | ||||||||||||
| Occupational group/Permanency of employment | Q1 10 | Q1 11 | Q1 12 | Q1 13 | Q1 14 | Q1 15 | Q1 16 | |||||
| 1. | Managers, directors and senior officials | Permanent employees | 92.2 | 89.4 | 88.0 | 84.6 | 90.8 | 94.0 | 102.0 | |||
| Temporary employees | * | * | * | * | * | * | * | |||||
| Not stated | * | * | * | * | * | * | * | |||||
| Total employees | 93.8 | 91.5 | 90.8 | 87.2 | 93.6 | 96.3 | 104.6 | |||||
| 2. | Professional | Permanent employees | 271.1 | 265.9 | 268.5 | 280.4 | 282.0 | 282.8 | 293.4 | |||
| Temporary employees | 28.4 | 31.5 | 30.6 | 32.0 | 29.1 | 22.1 | 22.0 | |||||
| Not stated | * | * | * | * | * | * | * | |||||
| Total employees | 300.2 | 297.8 | 300.2 | 312.9 | 312.1 | 306.0 | 316.7 | |||||
| 3. | Associate professional and technical | Permanent employees | 160.7 | 164.4 | 176.1 | 169.8 | 175.4 | 182.6 | 187.9 | |||
| Temporary employees | 11.9 | 11.8 | 12.1 | 11.4 | 10.0 | 9.2 | 8.7 | |||||
| Not stated | * | * | * | * | * | * | * | |||||
| Total employees | 174.0 | 177.7 | 189.5 | 182.9 | 187.4 | 193.3 | 198.8 | |||||
| 4. | Administrative and secreterial | Permanent employees | 220.9 | 197.9 | 185.3 | 181.1 | 185.0 | 185.9 | 184.6 | |||
| Temporary employees | 12.5 | 14.2 | 14.6 | 13.7 | 13.5 | 12.9 | 12.0 | |||||
| Not stated | * | * | * | * | [2.7] | * | * | |||||
| Total employees | 235.0 | 214.2 | 201.6 | 196.4 | 201.2 | 200.9 | 199.0 | |||||
| 5. | Skilled trades | Permanent employees | 156.1 | 137.8 | 132.8 | 130.9 | 145.8 | 155.7 | 163.2 | |||
| Temporary employees | 10.6 | 10.9 | 11.7 | 11.2 | 13.1 | 14.6 | 10.5 | |||||
| Not stated | * | * | * | [3.4] | [3.5] | [3.0] | [4.2] | |||||
| Total employees | 168.3 | 150.2 | 146.5 | 145.5 | 162.5 | 173.3 | 177.9 | |||||
| 6. | Caring, leisure and other services | Permanent employees | 113.5 | 112.8 | 110.4 | 112.6 | 111.5 | 125.8 | 123.8 | |||
| Temporary employees | 17.8 | 19.6 | 20.8 | 16.5 | 14.9 | 14.6 | 16.9 | |||||
| Not stated | * | [2.7] | * | [3.5] | [3.9] | [3.8] | [3.9] | |||||
| Total employees | 133.0 | 135.1 | 133.4 | 132.6 | 130.3 | 144.3 | 144.6 | |||||
| 7. | Sales and customer service | Permanent employees | 127.7 | 126.5 | 128.9 | 132.6 | 127.4 | 137.5 | 136.7 | |||
| Temporary employees | 20.6 | 24.1 | 22.3 | 21.0 | 18.7 | 18.9 | 16.1 | |||||
| Not stated | * | * | * | * | * | * | * | |||||
| Total employees | 148.9 | 151.5 | 152.5 | 154.9 | 147.4 | 157.3 | 153.8 | |||||
| 8. | Process, plant and machine operatives | Permanent employees | 96.4 | 114.0 | 106.8 | 107.8 | 101.9 | 104.0 | 110.3 | |||
| Temporary employees | 5.1 | 8.0 | 10.8 | 10.2 | 10.4 | 10.2 | 12.0 | |||||
| Not stated | * | * | * | * | * | * | * | |||||
| Total employees | 102.3 | 123.8 | 118.7 | 120.3 | 114.1 | 115.2 | 123.7 | |||||
| 9. | Elementary | Permanent employees | 174.0 | 157.3 | 149.5 | 160.8 | 167.4 | 169.3 | 171.2 | |||
| Temporary employees | 30.4 | 27.8 | 30.8 | 26.7 | 29.6 | 29.4 | 24.8 | |||||
| Not stated | [3.9] | * | [3.9] | [2.7] | [3.4] | [3.4] | [4.9] | |||||
| Total employees | 208.3 | 187.3 | 184.1 | 190.2 | 200.3 | 202.1 | 200.9 | |||||
| Other/Not stated | Permanent employees | [3.1] | 5.4 | [3.9] | [3.9] | 4.8 | 7.5 | 13.0 | ||||
| Temporary employees | * | * | * | * | * | * | * | |||||
| Not stated | * | * | * | * | * | * | * | |||||
| Total employees | 5.4 | 6.8 | 5.6 | 4.4 | 6.8 | 9.9 | 16.4 | |||||
| Total | Permanent employees | 1,415.7 | 1,371.5 | 1,350.1 | 1,364.5 | 1,391.9 | 1,445.1 | 1,486.3 | ||||
| Temporary employees | 139.6 | 150.7 | 157.1 | 145.1 | 142.5 | 134.7 | 126.4 | |||||
| Not stated | 13.9 | 13.7 | 15.8 | 17.7 | 21.1 | 18.7 | 23.7 | |||||
| Total employees | 1,569.2 | 1,535.9 | 1,523.0 | 1,527.3 | 1,555.5 | 1,598.6 | 1,636.4 | |||||
| Table 17 Employees aged 15 years and over in temporary employment (ILO) classified by type of temporary employment | ||||||||||||
| '000 | ||||||||||||
| Type of temporary employment | Q1 10 | Q1 11 | Q1 12 | Q1 13 | Q1 14 | Q1 15 | Q1 16 | |||||
| Casual work | 38.4 | 36.9 | 42.7 | 48.8 | 51.0 | 50.5 | 44.5 | |||||
| Seasonal work | [3.7] | 4.8 | 5.0 | 8.5 | 8.1 | 8.6 | 7.9 | |||||
| Lasted only until a particular task/tasks are completed | 8.9 | 12.4 | 11.3 | 16.9 | 19.0 | 21.7 | 16.5 | |||||
| Lasted only for a specific duration | 28.9 | 27.5 | 28.7 | 64.5 | 62.4 | 52.8 | 55.6 | |||||
| Not stated/No data available | 59.7 | 69.0 | 69.4 | 6.4 | * | * | * | |||||
| Total | 139.6 | 150.7 | 157.1 | 145.1 | 142.5 | 134.7 | 126.4 | |||||
| Note: A break in continuity has occurred as a result of a filter change related to this question in Q2 2012 and data from Q2 2012 onwards is not directly comparable with previous quarters | ||||||||||||
| Table 18 Employees aged 15 years and over in temporary employment (ILO) classified by reason for being in temporary employment | ||||||||||
| '000 | ||||||||||
| Reason for being in temporary employment | Q1 10 | Q1 11 | Q1 12 | Q1 13 | Q1 14 | Q1 15 | Q1 16 | |||
| It is a contract covering a period of training | 5.3 | [2.9] | 5.2 | 17.4 | 16.9 | 16.9 | 16.5 | |||
| Person could not find a permanent job | 37.6 | 42.4 | 50.1 | 77.2 | 75.2 | 71.9 | 64.0 | |||
| Person did not want a permanent job | 18.5 | 17.9 | 15.2 | 18.1 | 18.6 | 20.2 | 17.6 | |||
| It is a contract for a probationary period | : | : | : | [3.8] | 5.3 | [4.7] | * | |||
| Not stated | 78.1 | 87.6 | 86.7 | 28.6 | 26.6 | 21.1 | 24.7 | |||
| Total | 139.6 | 150.7 | 157.1 | 145.1 | 142.5 | 134.7 | 126.4 | |||
| : Data not available | ||||||||||
| Note: A break in continuity has occurred as a result of a filter change related to this question in Q2 2012 and data from Q2 2012 onwards is not directly comparable with previous quarters | ||||||||||
| Table 19 Employees aged 15 years and over in employment (ILO) classified by supervisory duties | |||||||||
| '000 | |||||||||
| Supervisory duties | Q1 10 | Q1 11 | Q1 12 | Q1 13 | Q1 14 | Q1 15 | Q1 16 | ||
| Person is a supervisor | 408.8 | 391.7 | 405.7 | 401.5 | 404.7 | 423.4 | 450.1 | ||
| Person is not a supervisor | 1,150.0 | 1,133.3 | 1,106.4 | 1,111.3 | 1,130.7 | 1,158.3 | 1,165.2 | ||
| Not stated | 10.3 | 10.9 | 10.8 | 14.4 | 20.1 | 16.8 | 21.1 | ||
| Total | 1,569.2 | 1,535.9 | 1,523.0 | 1,527.3 | 1,555.5 | 1,598.6 | 1,636.4 | ||
Purpose of Survey
The Quarterly National Household Survey (QNHS) began in September 1997, replacing the annual April Labour Force Survey (LFS). The purpose of the survey is the production of quarterly labour force estimates and occasional reports on special social topics. The survey meets the requirements of Council Regulation (EC) No. 577/98, adopted in March 1998, which requires the introduction of quarterly labour force surveys in EU member states.
Reference Period
Information is collected continuously throughout the year from households surveyed each week in each quarter. Up to and including the fourth quarter of 2008 the QNHS operated on a seasonal quarter basis since its establishment in Q4 1997. As of the first quarter of 2009 the Quarterly National Household Survey (QNHS) is now undertaken on a calendar quarter basis.
The reference quarters for survey results are:
Q1 - January to March, Q2 - April to June, Q3 - July to September and Q4 - October to December.
Data Collection
Information is collected on tablet computers, using computer-assisted personal interview (CAPI) software.
Sample Design
A two-stage sample design is used. A new sample was introduced in Q4 2012 following the 2011 Census of Population. The sample frame of households is clustered into blocks (small areas) with each block containing a minimum of 60 occupied households on the night of the 2011 Census of Population. The sample frame is stratified using administrative county and population density. In the first stage 1,300 blocks are selected using Probability Proportional to Size (PPS) sampling and in the second stage 20 households are selected using Simple Random Sampling (SRS). This ensures that each household in the sample frame has an equal probability of selection and results in a total quarterly sample of 26,000 households. The actual achieved sample varies over time depending on the level of response.
The number of valid responding households in Q1 2016, the most recent quarter for which data is included in this release, was 15,384.
Households are asked to take part in the survey for five consecutive quarters and are then replaced by other households in the same block. Thus, one fifth of the households in the survey are replaced each quarter and the QNHS sample involves an overlap of 80% between consecutive quarters and 20% between the same quarter in consecutive years. As the new sample based on the 2011 Census of Population was introduced incrementally across each quarter from Q4 2012 to Q4 2013, the new sample is fully effective from Q4 2013.
The survey results are weighted to agree with population estimates broken down by age, sex and region and are also calibrated to nationality control totals. The population estimates for April of each year are published in a separate release.
Usual residence and de facto population concepts
Up to and including Q1 2006 the annual population estimates were calculated using the de facto definition of population (i.e. all persons present in the state). Since Q2 2006 a new concept of usual residence has been used, i.e. all persons usually resident and present in the state plus absent persons who are usually resident in Ireland but are temporarily away from home and outside the State.
ILO Labour Force Classification
The primary classification used for the QNHS results is the ILO (International Labour Office) labour force classification. Labour Force Survey data on this basis have been published since 1988. The ILO classification distinguishes the following main subgroups of the population aged 15 or over:
In Employment: Persons who worked in the week before the survey for one hour or more for payment or profit, including work on the family farm or business and all persons who had a job but were not at work because of illness, holidays etc. in the week.
Unemployed: Persons who, in the week before the survey, were without work and available for work within the next two weeks, and had taken specific steps, in the preceding four weeks, to find work. It should be noted that as per Eurostat's operational implementation, the upper age limit for classifying a person as unemployed is 74 years.
Inactive Population (not in labour force): All other persons.
The labour force comprises persons employed plus unemployed.
The data presented in this release are related to persons classified as being in employment only.
NACE Industrial Classification
The QNHS sectoral employment figures are based on the EU NACE Rev. 2 (Nomenclature generale des activites economique dans les Communautes europeennes) classification as defined in Council Regulation (EC) no 1893/2006. Fourteen NACE sub-categories are distinguished in Table 2a of this release. From Q1 2009 NACE Rev. 2 has been adopted as the primary classification of industrial sectors for use in QNHS outputs. From Q4 1997 to Q4 2008 the NACE Rev. 1.1 classification had been in use.
NACE Rev. 2 classification is more detailed than the NACE Rev. 1.1 classification. In particular more sections are now identified for services activities with the aim of better capturing economic activity within services. In cases where there is a direct one to one correspondence (e.g. section H ‘Hotels and restaurants’ in NACE Rev. 1.1 directly corresponds to section I ‘Accommodation and food service activities’ sector in NACE Rev. 2) then the two different series can be expected to be broadly comparable.
However, the series will not be exactly the same, as the process of applying NACE Rev. 2 involved a very detailed recoding process whereby the new NACE classification was applied to each record in each quarter. The detailed nature of this process means it should be expected that even in the case of a one to one correspondence between a NACE Rev. 2 and NACE Rev. 1.1 section; minor differences in the level of the estimates may be seen.
To facilitate analysis and the running of seasonal adjustment on the time series NACE Rev. 2 estimates have been produced from Q1 2004 onwards. As of Q2 2009 only NACE Rev. 2 estimates will be published.
Occupation Classification
As a result of changes to the European regulations governing the Quarterly Labour Force Survey (implemented in Ireland using the QNHS) the CSO is obliged to report occupational coding data to Eurostat based on the new Europe wide classification ISCO-08 from Q1 2011 onwards. To allow this requirement to be met the CSO has changed to using UK SOC2010 as the primary classification used in collecting the data. ISCO-08 is then derived from UK SOC2010. This change is also being implemented for the Census 2011 results.
The previously used classification for publication purposes in Ireland was UK SOC1990 and this cannot be directly compared to the new UK SOC2010 classification as all occupations have been reclassified accordingly. This newer classification reflects the evolution over a period of time of certain occupational areas which were developing rapidly, both in terms of their scale and the complexity of work organisation. One particular example which highlights the impact of these changes on published results is the reclassifying of farmers from the major occupation grouping of ‘Managers and administrators’ in SOC1990 to the major occupation grouping of ‘Skilled trades’ in SOC2010.
Results for occupations coded to the new SOC2010 classification have now been recoded for historical quarters back to Q1 2007 to provide a longer and consistent time series for users.
Further information regarding SOC 2010 is available at the link below:
http://www.cso.ie/shorturl.aspx/104
Reliability of Estimates Presented
Estimates for number of persons where there are less than 30 persons in a cell are too small to be considered reliable. These estimates are presented with an asterisk (*) in the relevant tables.
Where there are 30-49 persons in a cell, estimates are considered to have a wider margin of error and should be treated with caution. These cells are presented with parentheses [ ].
In the case of rates, these limits apply to the denominator used in generating the rate. In the case of annual changes, both the current year and the preceding year are taken into account when deciding whether the estimate should be suppressed or flagged as having a wider margin of error.
Calculation of Rates and Estimates of Change
Rates and estimates of change presented in this release are calculated from whole unrounded numbers. Due to rounding, these may differ from the rates and estimates of change calculated from the rounded volumes presented in the tables.
Main QNHS release and data series
The quarterly QNHS release can be accessed through the CSO website and is available, along with other additional series, at the link below:
http://www.cso.ie/shorturl.aspx/70
Labour market data can also be accessed from Statbank, the CSO’s main data dissemination service which can be accessed through the CSO website at the link below:
http://www.cso.ie/shorturl.aspx/78
Participating Households
The Central Statistics Office wishes to thank the participating households for their co-operation in agreeing to take part in the survey and for facilitating the collection of the relevant data.
 Hide Background Notes
Scan the QR code below to view this release online or go to
http://www.cso.ie/en/releasesandpublications/er/qnhs-es/qnhsemploymentseriesq12016/
 Hide Table 1 Persons aged 15 years and over in employment (ILO) classified by detailed NACE Rev.2 Economic Sector