
This release is categorised as a CSO Frontier Series Output. Particular care must be taken when interpreting the statistics in this release as it may use new methods which are under development and/or data sources which may be incomplete, for example new administrative data sources.
This release is based on linked pseudonymised administrative data from the Department of Education and Youth and the Department of Social Protection. Pupils were linked to their parents or guardians using Child Benefit records. Child Benefit is a universal monthly payment for the parents or guardians of children aged under 16, or under 19 if in full-time education. It is normally paid to the child's mother, stepmother, or the person with whom the child lives most of the time. In this release, the term main parent refers to the most recent Child Benefit recipient associated with each pupil as of 01 September 2022. Where a pupil's main parent was in a relationship (marriage, cohabitation, or civil partnership) as of 01 September 2022, their partner was also considered a parent.
Social welfare receipt refers to receipt of at least one payment during 2022, irrespective of duration of claim or number of payments.
School Planning Area names are administrative labels from Department of Education and Youth records, and their boundaries are shown in the accompanying maps.
The Delivering Equality of Opportunity in Schools (DEIS) programme was introduced in 2005 with the aim of addressing educational disadvantage among pupils by providing additional resources to schools serving the most disadvantaged communities. Primary level DEIS schools are classified as Rural or Urban based on their location. Urban schools are further categorised as Band 1 or Band 2, based on the level of disadvantage experienced by the communities they serve.
In the academic year 2022–2023, there were 3,095 mainstream primary schools with a total enrolment of 549,196 pupils. Most pupils, 72.0%, attended non-DEIS schools, while 12.7% attended DEIS Urban Band 1, 7.8% attended DEIS Urban Band 2 and 7.5% attended DEIS Rural schools.
At post-primary level, there were 727 schools with a total enrolment of 406,393 pupils. Most pupils, 67.8%, attended non-DEIS schools, while 25.5% attended DEIS schools and 6.7% attended fee-paying schools.
The Department of Education and Youth (DEY) divides the country into 314 School Planning Areas (SPAs) for planning and analysis purposes. SPA names are administrative labels from DEY records, and their boundaries are shown in the accompanying maps.
Pupils are free to apply to any school within or outside the School Planning Area associated with their home address. For this analysis, pupils were assigned to a SPA based on their home address rather than the location of the school they attend. The number of pupils per SPA varied substantially across the country, ranging from approximately 25 pupils in the Tory Island SPA to more than 20,000 in Limerick City. The mean pupil population was 2,929, while the median was 1,945.
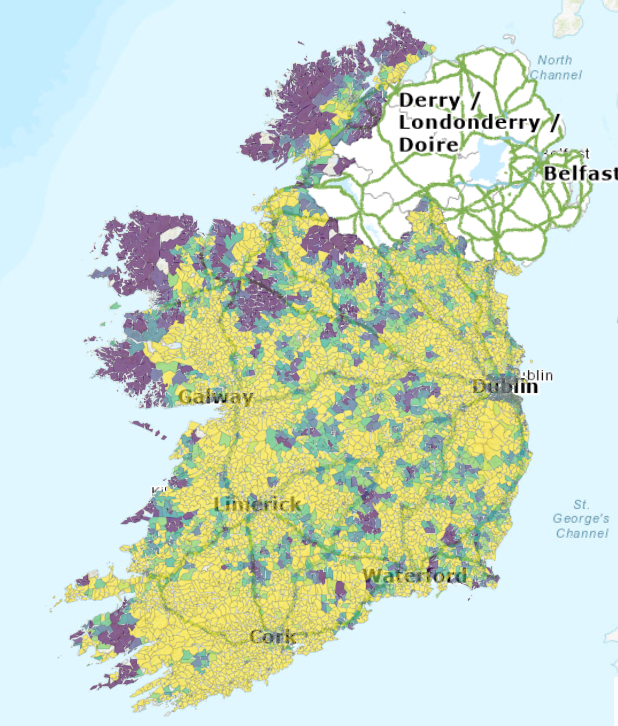
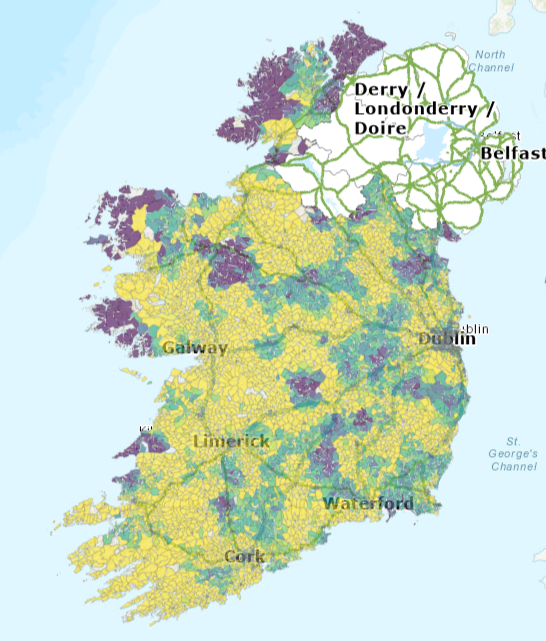
Maps 1.1 and 1.2 show the proportion of primary and post-primary pupils in each SPA who attend DEIS schools. In some SPAs, DEIS school enrolments varied substantially between primary and post-primary level. In the Castletownbere SPA, 78% of primary pupils attend DEIS schools compared with no post-primary pupils. In contrast, just 11% of primary pupils in the Bush SPA attend DEIS schools, compared with 88% of post-primary pupils.
Among primary pupils, the DEIS school enrolment rate was more than 80% in 21 SPAs and more than 50% in 69 SPAs.
Among post-primary pupils, the DEIS school enrolment rate was greater than 80% in 24 SPAs and greater than 50% in 61 SPAs.
CSO Small Areas are the lowest level of geography used for compilation of statistics in line with data protection guidelines and typically contain between 50 and 200 dwellings. They were first published after Census 2011 and have had their boundaries redrawn where necessary following each subsequent census to account for changes in population size and distribution. The most recent iteration, following the 2022 Census, divides the country into 18,919 Small Areas.
Small Areas in rural areas generally cover a larger area than those in urban areas due to lower population density. For instance, there are 2,261 Small Areas contained within the Dublin City Council area, compared with 1,971 in the entire West region encompassing counties Mayo, Roscommon, and Galway, including Galway City.
Maps 1.3 and 1.4 show the proportion of primary and post-primary pupils in each Small Area who attend DEIS schools. Rural DEIS enrolment is concentrated across large parts of the west and north-west, with smaller pockets along the western seaboard and in other rural areas across the country. In urban areas, DEIS enrolment rates often vary substantially between neighbouring Small Areas, reflecting local differences in socio-economic disadvantage.
The interactive maps can be viewed by clicking on the images below. Please note due to the large amount of data, the maps will take additional time to load. The data is available in PxStat Table SPAD05.
The Pobal HP Deprivation Index is a Small Area-based measure of relative affluence or deprivation using data from the CSO Census of Population. It provides a relative score for each Small Area based on a range of demographic, social, and economic characteristics. The 2022 edition of the Index categorises Small Areas into one of seven categories ranging from Extremely Disadvantaged to Very Affluent.
At primary level, 13.2% of pupils lived in Disadvantaged, Very Disadvantaged, or Extremely Disadvantaged areas, while 14.4% lived in Affluent or Very Affluent areas. The remaining 72.1% lived in areas close to the national average in terms of deprivation. Addresses were unavailable for 0.3% of pupils.
Among pupils attending DEIS schools, 32.3% lived in Disadvantaged, Very Disadvantaged, or Extremely Disadvantaged areas. DEIS Urban Band 1 schools had the highest proportion (43.4%), followed by DEIS Rural schools (24.7%) and DEIS Urban Band 2 schools (21.3%). Non-DEIS schools had the lowest proportion (5.8%).
Non-DEIS schools had the highest proportion of pupils who live in Affluent or Very Affluent areas (17.8%), followed by DEIS Urban Band 2 schools (10.0%) and DEIS Urban Band 1 schools (5.2%). DEIS Rural schools had the lowest proportion (1.4%).
Among primary pupils living in Disadvantaged, Very Disadvantaged, or Extremely Disadvantaged areas, 68.2% attended DEIS schools, compared with 10.8% among those living in Affluent or Very Affluent areas. DEIS school enrolment was highest among pupils living in Extremely Disadvantaged areas (90.0%) and lowest among those in Affluent areas (10.7%).
At post-primary level, 12.9% of pupils lived in Disadvantaged, Very Disadvantaged, or Extremely Disadvantaged areas, while 13.0% lived in Affluent or Very Affluent areas. The remaining 70.5% lived in areas close to the national average in terms of deprivation. Addresses were unavailable for 3.6% of pupils.
DEIS schools had the highest proportion of pupils who live in Disadvantaged, Very Disadvantaged, or Extremely Disadvantaged areas (28.3%), followed by non-DEIS schools (8.2%). Fee-paying schools had the lowest proportion (1.4%).
Fee-paying schools had the highest proportion of pupils who live in Affluent or Very Affluent areas (41.1%), followed by non-DEIS schools (13.3%). DEIS schools had the lowest proportion (5.0%).
Among post-primary pupils living in Disadvantaged, Very Disadvantaged, or Extremely Disadvantaged areas, 55.9% attended DEIS schools, compared with 19.7% among those living in Affluent or Very Affluent areas. DEIS school enrolment was highest among pupils living in Extremely Disadvantaged areas (73.9%) and lowest among those in Very Affluent areas (8.1%).
Fee-paying schools were attended by 21.1% of pupils living in Affluent or Very Affluent areas, compared with 4.7% of those living in Marginally Below Average or Marginally Above Average areas, and 0.7% of those living in Disadvantaged, Very Disadvantaged, or Extremely Disadvantaged areas.
Nationally, 17.6% of pupils lived in one-parent families and 82.4% lived in two-parent families. For the purposes of this analysis, the term parent refers to the recipient of the pupil's Child Benefit payments or their partner. These and all subsequent statistics are based on pupils who were matched to at least one parent. Further details on the matching process and definitions are provided in the Background Notes.
At primary level, 17.1% of pupils lived in one-parent families. DEIS Urban Band 1 schools had the highest proportion (35.4%), followed by DEIS Urban Band 2 schools (24.5%) and DEIS Rural schools (17.0%). Non-DEIS schools had the lowest proportion (13.1%).
At post-primary level, 18.4% of pupils lived in one-parent families. DEIS schools had the highest proportion (27.3%), followed by non-DEIS schools (15.8%). Fee-paying schools had the lowest proportion (10.7%).
The Darndale_D17 and Palmerstown_Ronanstown_D20_22 School Planning Areas had the highest proportion of pupils living in one-parent families (44%), followed by the Scribblestown_FinglasWest (41%) and Dublin_8 SPAs (37%).
The proportion of pupils living in one-parent families was highest in Extremely Disadvantaged areas (48.5%) and lowest in Very Affluent areas (10.7%).
Learn about our data and confidentiality safeguards, and the steps we take to produce statistics that can be trusted by all.