Your feedback can help us improve and enhance our services to the public. Tell us what matters to you in our online Customer Satisfaction Survey.
This publication is categorised as a CSO Frontier Series Output. Particular care must be taken when interpreting the statistics in this release as it may use new methods which are under development and/or data sources which may be incomplete, for example new administrative data sources.
AIS is a receiver and transmitter system used by ships to transmit their position and is used as a safety tool that functions with a combined satellite and ground receiver system. AIS allows other ships, Coast Guards, and emergency services to be aware of the ship’s current position in both coastal and ocean traffic. The use of AIS gives the CSO the opportunity to collect homogenous near real-time and historical data that can be used to produce maritime transport statistical estimates more frequently than traditional methods. Compared with other maritime datasets, AIS has a broader vessel coverage and AIS datasets are widely available and well documented. The automated, centralised nature of the process adds no response burden to ports or shipping companies.
Statistical organisation around the world started publishing experimental statistics using AIS data to provide faster data on maritime activities. A proof of concept was carried out by the UK Office for National Statistics (ONS). In their papers “Analysing port and shipping operations using big data” (Bonham et al., 2018) and “Faster indicators of UK economic activity: shipping“ (Noyvirt, 2019), the ONS carried out detailed studies of port call activity using AIS data from the period 2016-2019 which lead to the publication of more timely shipping indicators. Statistics Denmark publishes experimental statistics on port calls in Danish sea ports using AIS data and the United Nations Global Platform produced a handbook which provides a snapshot of global AIS analysis. The handbook includes numerous case studies for AIS use including for maritime transport indicators; tracking of fishing fleets; and CO2 shipping emissions.
However, the use of Big Data in official statistics is still very new and involves some challenges. Internationally agreed standards are still being developed and high-frequency statistics often come with a trade-off between timeliness and reliability.
While AIS data can improve the periodicity and timeliness of official maritime statistics, developing indicators from AIS is not a simple matter of aggregating records. AIS is intended for safety at sea and is not primarily designed for statistical analysis. Stored AIS data contains a large volume of information often not relevant for analysis. Hence, the complications of AIS data must be considered. The main complication is that AIS data can be noisy and that AIS messages can be corrupted. The quality of AIS equipment can be lacking and the data may not be accurate if the coverage of the AIS receiving stations near the relevant port is weak or if AIS transponders are turned off when ships are in port. This all can lead to AIS data showing unrealistic tracks. Therefore, AIS data are best used in corroboration with additional data sources (Emmens et al., 2021).
Footnotes
Bonham, C., Noyvirt, A., Tsalamanis, I., & Williams, S. (2018). Analysing port and shipping operations using big data. Newport, Wales: Data Science Campus - Office for National Statistics.
Emmens, T., C., Abdi, A., Ghosh, M. (2021). The promises and perils of Automatic Identification System data. ScienceDirect, 178, https://doi.org/10.1016/j.eswa.2021.114975.
Noyvirt, A. (2019). Faster indicators of UK economic activity: shipping. Newport: Office for National Statistics.
United Nations Global Platform (2020). AIS Handbook Online. Geneva: United Nations.
For this release AIS data were supplied by the Task Team on AIS Data of the UN Committee of Experts on Big data and Data Science for Official Statistics (Task Team on AIS Data — UN-CEBD), and accessed through the UN Global Platform — UN-CEBD (UNGP) which holds a global repository of live and archived AIS data. This data is provided by ExactEarth who combine their own satellite data with terrestrial data from FleetMon. In addition to location, bearing and navigation status, the AIS data includes unique identifier information on International Maritime Organisation (IMO) number and Maritime Mobile Service Identity (MMSI) number.
The UNGP not only holds AIS data but also the IHS Shipping Registry. Incorporating SeaWeb and Lloyd’s Register of Ships (published since 1764), the IHS Shipping Registry provides detailed information on all self-propelled and seagoing merchant ships. Among the information included in the registry are IMO number, MMSI number, ship name, ship type, cargo type, ownership, registration, tonnage, dimensions and propulsion.
AIS data on the UNGP is enhanced by adding a spatial index to every AIS message record. The spatial index system used is H3, a system originally developed by Uber and contains sixteen resolution levels consisting of cells that cover the earth’s surface with a corresponding H3 Index. How the H3 indexes are used to calculate AIS-based port calls is explained under “Methodological Notes”.
A H3 cell is a geometric/geographic unit polygon in the H3 grid, either a hexagon or pentagon and a H3 Index is a value representing a H3 object. This terminology will be used in this sense for the rest of the frontier publication.
See H3 terminology for more details.
H3 is a hierarchical geospatial index. H3 Indexes refer to cells (polygons areas -generally hexagons) by the spatial hierarchy. Every hexagonal cell, up to the maximum resolution supported by H3, has seven child cells below it in this hierarchy. Hexagons also have the property of expanding rings of neighbours approximating circles (see Figure 2.1).
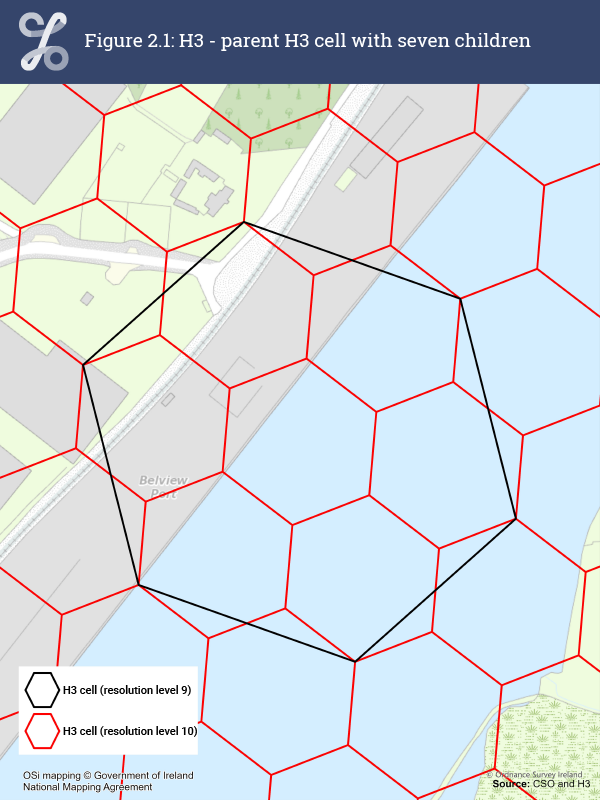
At each index resolution the area of a H3 is cell approximately the same. By way of illustration, Brazil is about the size of two H3 cells of resolution zero. See Table 2.1 for the indicative size of H3 hexagons.
The details of this grid system are beyond the scope of this document, but more detailed information is available from H3 documentation.
| Table 2.1: H3 Cell area by resolution | |
| H3 Index resolution | Hexagon cell area (Indicative) |
| 0 | 4,357,450 Sq km |
| 1 | 609,790 Sq km |
| 2 | 86,800 Sq km |
| 3 | 12,390 Sq km |
| 4 | 1,770 Sq km |
| 5 | 253 Sq km |
| 6 | 36 Sq km |
| 7 | 5.2 Sq km |
| 8 | 73.7 Ha |
| 9 | 10.5 Ha |
| 10 | 1.5 Ha |
| 11 | 0.2 Ha |
| 12 | 307 Sq M |
| 13 | 44 Sq M |
| 14 | 6 Sq M |
| 15 | 1 Sq M |
The UNGP adds the H3 index to each AIS message for all sixteen resolution levels and uses this index store the data in Parquet files. This allows for efficient query and update of AIS data within the UNGP.
The main benefit of the H3 indexing systems is any position on the earth can be assigned to a H3 cell at a given resolution via the cell’s corresponding H3 index and by extension so can any AIS message.
The port polygons defined in this release serve several purposes. Firstly, port polygons define the area in which a port visit can take place and assign a visit to a particular port. Secondly, the polygons are used to create a study area that act as spatial filter to reduce the amount of AIS data that needs to be processed as AIS messages which fall outside the port areas are not relevant. Details of creating the area of interest from the port polygons are discussed in more detail below.
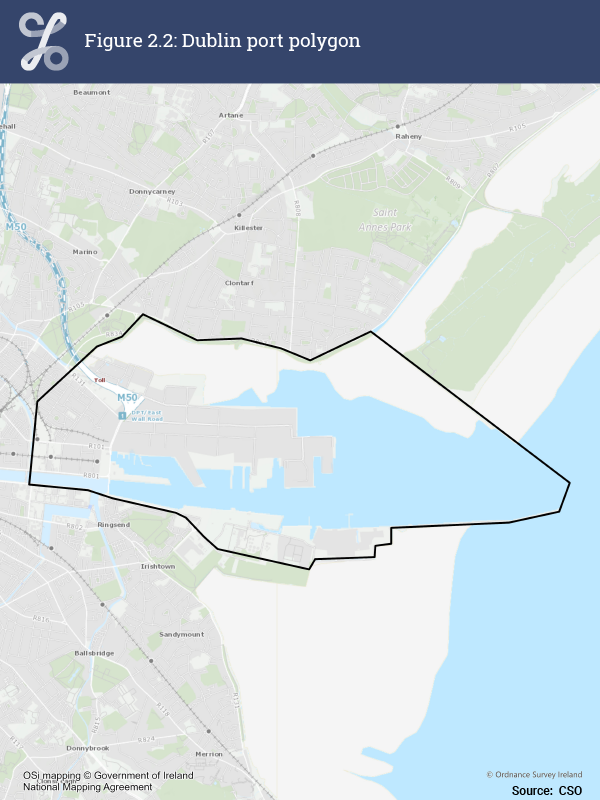
The port polygons do not overlap and were digitised with GIS software. When digitising the port polygons, care is given to defining an area whereby an ocean-going ship upon entering would be expected to be visiting the port. Ships are confined to water areas, and the amount of land covered by these polygons is irrelevant as any onshore AIS report is most likely an error arising from GPS signal error, a transmission error or rounding. As a result, the port polygons do not represent an area corresponding to port activities but rather an area of water that contains the port.
By way of illustration, Cork and Dublin ports serve as good examples. A ship must enter/leave Cork Harbour by passing Roche’s point. Likewise, in Dublin’s case any ship must pass between the North and South Bulls to reach Dublin Port. Similar criteria apply to river ports like Waterford, New Ross, and Drogheda. See Figure 2.2. The unique traffic patterns and physical characteristics of each port help to define the port polygons and reduce the noise in the AIS data.
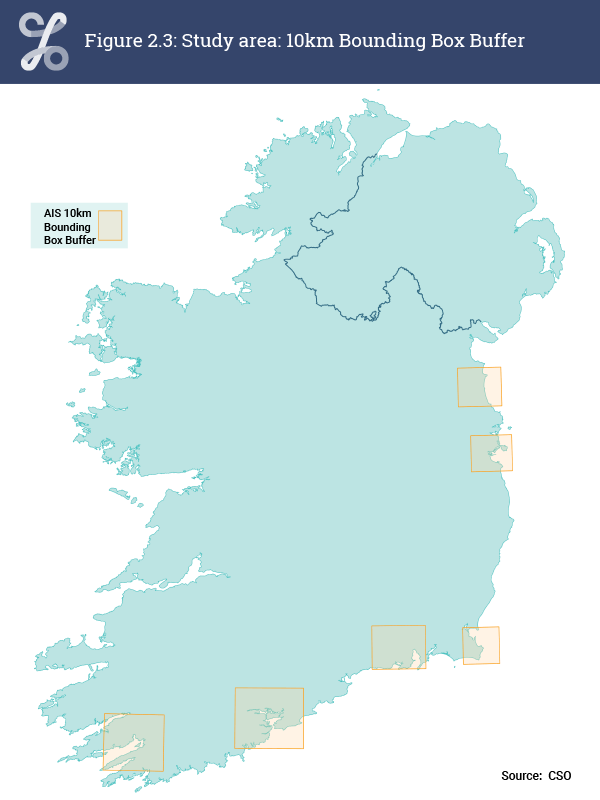
Data reduction is essential when working with Big Data due to the large amount of information. To reduce the volume of data that need to be analysed Bounding Box Buffers (BBB) around the port polygons were created. See Figure 2.3. Only data within the BBB were kept. The BBB geometry reduced the amount of data to be processed by about 80%.
This release compares two methodologies developed for generating AIS-based port calls. The CSO has built upon these innovative methodologies using in-house expertise to improve the accuracy of the output. The first is based on ships entering and leaving the port area, which is defined by a polygon (port polygon). It is a quick and easy to understand method that counts all ships that fall in any of the defined port polygons as port calls. While this method allows macro level port call analysis, a more detailed analysis is needed when looking at more specific shipping activities within a port polygon.
The second method identifies stopped ships within a port area using the same polygons as the first method. However, it also uses AIS data to estimate a location where a ship is stopped, the upper-lower-time durations for ship stoppage and the number of AIS messages counted while stopped.
Both methodologies aimed to develop robust code that can be implemented by agencies in other countries, in addition to Ireland. As part of validation, both methodologies developed were benchmarked with MarineTraffic data (see “Testing and Validation”).
The BCM defines a vessel as in-port if its reported position is inside a port polygon. The data processing for this method consists of the following steps:
The first step is to define the ports of interest. The six Irish main ports are manually digitised as explained above (see “Port Polygons”).
The next step is geographical reduction to restrict the analysis to only AIS messages that are within and closely around a port polygon. This is done by using the Bounding Box Buffers. The purpose of this step is to reduce the volume of data that must be processed. This means that only relevant AIS messages are exacted which are used for further linkage and analysis. See Figure 2.3.
Producing statistics on port calls by vessel type requires having an up-to-date classification for all vessels via a ship register. Based on the IMO and MMSI numbers, it is possible to link the AIS data from the UNGP to the IHS Shipping Registry. A filter was developed to only include the activity of cargo vessels, car ferries and other passenger vessels, while the following vessels were excluded:
To calculate AIS-based port calls, AIS messages are checked on whether a vessel’s location (latitude and longitude) is found in the port polygons. A ship is then considered in-port if its reported position is inside a port polygon. An arrival is counted the first time a ship enters the port polygon. A departure is recorded when the same ship leaves the port polygon. The vessel movements are therefore defined through a binary variable (“arrived” versus “departed”). Each arrival is matched to a departure to classify a visit as a port call. If a departure is not found the unmatched port call is eliminated.
The basic idea behind the SMBM is that a ship needs to be stationary for an extended period to load and unload. If a ship is stationary within a port polygon for long enough, then it is highly likely to be a ship visit. This method takes advantage of the attribute data added to AIS data on the UNGP. Of particular use are H3 Indexes (see “AIS and H3 Cells”) that help organise, store, and query AIS data within UNGP. Once a ship has been identified as stationary or stopped (a triggering event) an escape condition (escape event) is needed to determine if subsequent AIS records show a position indicating that a ship has moved sufficiently far away from its triggering position to be considered as movement.
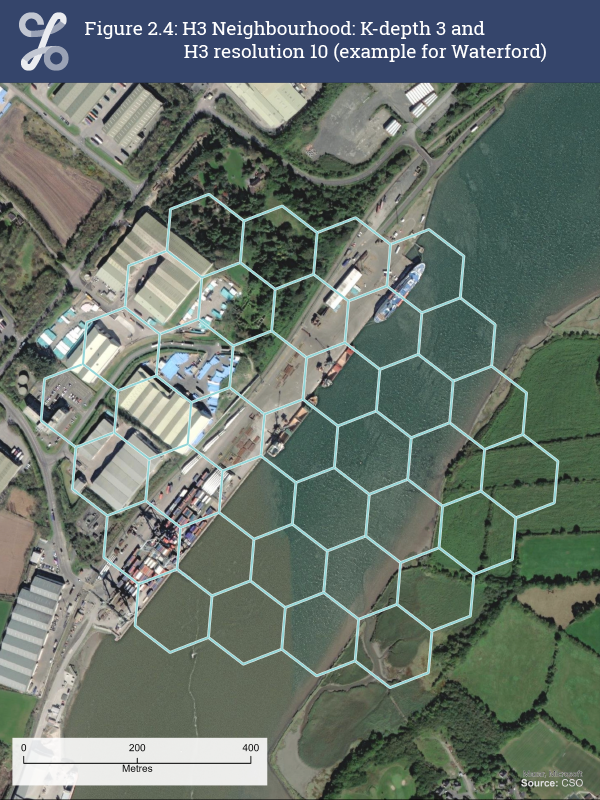
By using H3 Indexes, the escape condition becomes an attribute comparison and does not need to use geographic methods to determine distance. The escape condition is met if a test record’s H3 Index is not within a set of H3 Indexes that defines a neighbourhood of the triggering event (stopping). For determining this, the CSO uses a H3 k-ring (griddisk) function that returns a set of H3 Indexes that are in the rings that surround the test record’s H3 Index and forms its neighbourhood. The term “k-depth” refers to the number of rings used to define the neighbourhood for testing the escape condition.
Depth 0 is defined as the origin index, k-ring 1 is defined as k-ring 0 and all neighbouring indices, and so on, an arithmetic series. See Table 2.2.
| Table 2.2: K-depth and number of cells for k-ring | |
| K depth | Number cells in k-ring |
| 0 | 1 |
| 1 | 7 |
| 2 | 19 |
| 3 | 37 |
| 4 | 61 |
| 5 | 91 |
| 6 | 127 |
This function introduces two hyper-parameters: k-depth of the k-ring and the H3 resolution to use for the k-ring.
For the SMBM a H3 Index resolution of level 10 is used where the width of a cell is approximately 150m. This width also approximates the size of ships being studied in this project. A K-depth of three is used as this takes account of errors in reporting position, minor changes in position due to tide and current, and small operational movements of the ship. In Ireland, a K-depth of three and resolution of 10 corresponds to an area of nearly one square kilometre. See Figure 2.4.
The data processing for the SMBM consists of the following steps:
As with the boundary crossing method (described above) the first step is to create geometries from AIS data queried from the UNGP. Firstly, by filtering on H3 indices of resolution two to get AIS records and then creating point geometries only from AIS records that are between a minimum and maximum latitude/longitude that forms a box around Ireland, which for brevity is referred to here as the “Irish Box”.

Port calls relate only to vessel activity near a port. Therefore, the next step is to reduce the AIS dataset of points within the Irish Box to AIS messages within the study area only. This is done via a spatial query using the bounding box buffer polygons. This greatly reduces the volume of AIS messages to be processed.
In the next step, the timestamp value for the AIS observation is converted to a UNIX timestamp format which is the integer number of seconds from January 1st 1970. The allows for easy sorting on a natural time order and simple calculations of time differences.
From the AIS messages in the study area, a list of distinct ships is created based on ship MMSI numbers. For each MMSI a sorted list of AIS records is created sorted on the UNIX time stamp value.
This step identifies “stopped ships”. The previous list of AIS records for a ship is iterated through and each record is checked to see if its speed is zero. If it is not, then this record gets stored as a “previous” record and the next record is examined.
If a speed of zero is detected, then the algorithm triggers and records it as a “reference” variable for testing. The immediately previous record is also marked as a “prior” record. The H3 index of the “reference” is then used to define a set of neighbourhoods of H3 Indexes known as a k-ring, as discussed above. The next record for the ship is examined and the value of its H3 index tested against the k-ring set.
If it is in the k-ring, then the ship is regarded as being sufficiently close enough in location and the record count for the stopped ship is incremented by one value. This record now becomes the new “previous” and the next record for the ship is tested against it.
If it is not in that k-ring, then the AIS record as met an “escape” condition and is sufficiently far away from its stopped location to be regarded as being in a new position.
The UNIX times are available for four records: the “reference” record itself, its corresponding “prior” record, the “previous” record prior to the escape condition record; and the “escape” record itself.
This allows us to make an upper and lower time estimate of the time the ship was stopped:
Upper Time Estimate = Uescape - Uprior
Lower Time Estimate = Uprevious - Ureference
The above steps add additional information to each “stopped ship” record:
This process continues until the AIS records for a specific ship are exhausted and the process is continued with the next ship. This generates a set of records corresponding to stopped ship events within the study area.
Based on the IMO and MMSI number the AIS data are linked to the IHS ship register data. Firstly, a link is made via the IMO number and then any ships that could not be matched are matched via the MMSI number. Any records that could not be matched are retained but no data from the shipping register can be added.
Using the co-ordinates of the “stopped ships” any that are within the port polygons are marked as potential ship visits.
Only activities of cargo vessels, car ferries and other passenger vessels are included in this release to align with Eurostat Maritime Transport definitions. The following vessels are excluded:
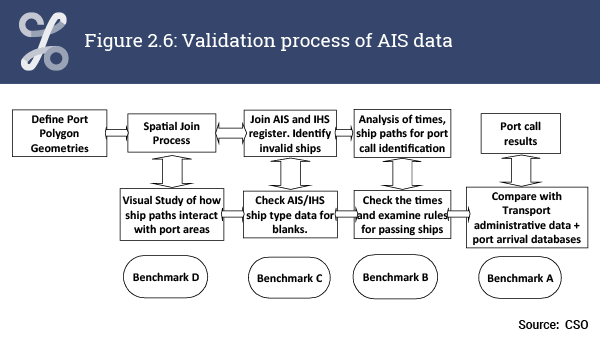
New statistics based on Big Data must be subject to extensive checks before being deployed by National Statistical Institutes. CSO tested the AIS data to validate the above-described methods. This is to assist the CSO’s objective of producing high quality, unbiased estimates of port calls from AIS data. Figure 2.6 outlines a high-level overview of the multi-stage validation process.
Benchmark A – The accuracy of the AIS port call is examined by comparing results with other administrative data sources on port calls.
Benchmark B – Port calls for each ship are examined for their individual effectiveness by comparing the AIS results to alternative datasets such as Marine Traffic data.
Benchmark C - The merged IHS/AIS data and associated fields such as navigation status (AIS-obtained) are measured both in terms of the completeness of their coverage and their accuracy.
Benchmark D – If significant issues are identified in earlier stages of the validation process, Benchmark D is carried out – this involves considerations of ship paths and boundary areas.
Dublin Port was used for validation purposes as most ships in Ireland arrive in Dublin Port. The period of February 2019 was chosen as a benchmark period. Two datasets were used to validate the AIS results:
The first step towards validating the AIS results was to ensure that all vessels were identified by the two above-described methods.
Vessel completeness was checked against the two benchmark datasets. Some 128 individual vessels of interest were found in the Dublin Port, the MarineTraffic.com and the UNGP dataset, resulting in 100% completeness for Dublin.
The data were then tested to ensure that port calls occurred on the correct date and that the correct number of port calls were identified for each vessel for the month of February 2019. For example, a ferry may make two calls to Dublin Port per day.
The dates were mostly correct and common to all three datasets for all port calls. Most discrepancies in the recording of date were because Dublin Port generally recorded a slightly earlier time than the other two datasets. Sometimes, this time fell before midnight and therefore recorded the day before. This was not deemed problematic to the study and ignored.
A small number (less than ten) of instances occurred where the UNGP AIS dataset recorded port calls that the other two sources did not. However, again, some of these turned out to be due to port calls close to midnight giving a different date.
Counts of arrivals were calculated for vessels of interest for each of the three datasets. Of the 128 vessels of interest, 110 had equal port calls counts, i.e., each of the three datasets recorded the same number of arrivals for each vessel leaving 18 instances where the datasets did not agree. In 12 of these 18 cases, the UNGP AIS dataset appeared to overcount port calls by one. In the remaining six cases, the UNGP AIS dataset agreed with either one of the datasets implying the fault is with one of the others. Therefore, of 128 vessels, 12 (9.4%) had an overcount of one port call. Another way of expressing this is of 622 port calls, there are 12 overcounts (1.9%). This requires further investigation and will be refined in the next iteration.
The testing and validation exercise concludes that AIS data are a valid source to determine port calls. All vessels of interest were found in the Dublin Port, the MarineTraffic.com and the UNGP dataset.
Both methods (BCM and SMCM) show very promising results. The SMBM produces a higher total of port calls compared with the BCM. The higher count of the SMBM compared with the BCM could be related to the issue of ships stopping multiple times within a port polygon. The SMBM counts the number of ships that stopped within a port polygon, while the BCM only counts the number of times a ship enters the port polygon. The SMBM, therefore, risks over-counting arrivals when a ship stops more than once within a port area. For example, a vessel that arrives and stays for several days within a port may visit several locations within the port polygon. A count will occur for each stopping event. An example scenario is a vessel arriving in port, unloading its cargo and then moving to another location to take on fuel or stores. Another scenario maybe navigation and awaiting a berthing location to become available.
In conclusion, the CSO recommends to use the BCM for quick analysis on port calls. However, in the long run the SMBM offers a lot more potential. The SMBM allows to do micro level analysis on port activities. SMBM has the potential to publish figures on:
The potential of Big Data to produce or supplement official statistics has been widely discussed in recent years, and questions such as data quality, relevance and long-term availability have been raised. In considering some of these issues and to help the CSO decide whether AIS based statistics can be published on a regular basis alongside CSO’s Statistics of Port Traffic, the project is assessed against the CSO’s Quality Management Framework criteria:
The question of relevance is whether AIS statistics meet user needs or not. The CSO already produces port call statistics based on administrative datasets as a Eurostat requirement. However, AIS-based statistics data offers opportunities for enhanced and timelier statistical outputs.
AIS-based data can lead to more detailed port call statistics at much higher temporal and spatial resolutions. For example, it is theoretically possible to produce weekly port call statistics for each Irish port, a significant improvement on quarterly figures. In addition, detailed GIS based visualisation and spatial analysis is possible for ship location in ports, as well as ship movements outside of port areas. Another advantage of AIS data is that due to its “failure-critical nature” and high level of data coverage is that it provides a robust benchmark for existing administrative data and port call statistics.
All this would seem to indicate that such AIS outputs are relevant for users.
The key question here is whether accurate AIS statistics can be produced. The AIS data produced similar results to the administrative data and the reference MarineTraffic data. Further analysis is, however, required to improve the accuracy of AIS-based results.
Official statistics based on datasets require the datasets to be accessible, affordable and not subject to interruptions. A high quality and accessible data source for AIS data exists in the form of the UNGP. The AIS data is free, suitably structured, and available to the CSO for official statistical use in the short to medium term.
AIS data appears to offer very accurate shipping statistics such as port call statistics at more frequent intervals and with more spatial detail than existing data sources. Given the experience so far, it is not likely that producing timely AIS port call statistics will require major additional resources. The limited resource requirements can be seen at each stage of the process:
Statistics must be clearly presented and easily understood by potential users. This initial introduction of AIS statistics as a Frontiers Release summarises port call results to users. It allows user feedback that can be incorporated in subsequent iterations.
The AIS port call project has strong potential to fulfil all the criteria required for official statistics. While further work is required to refine the process, this data can be published as a Frontier Release providing early snapshots of the trends in Irish port call statistics. However, it is important to note that this data would be used as a supplement to administrative data from port authorities and that the detail available from administrative data sources, such as tonnage handled inward and outward, and the nature of goods handled is only available from administrative sources at the moment.
This release contains the results of six main Irish ports:
Bantry, Cork, Drogheda, Dublin, Rosslare, and Waterford.
Vessel types are classified based on the IHS Shipping Registry. The following vessel types are covered in the series:
Learn about our data and confidentiality safeguards, and the steps we take to produce statistics that can be trusted by all.