
A CSO Frontier Series Output- What is this?
The Central Statistics Office (CSO) Frontier Publication entitled ‘Impact of COVID-19 on the Debt Sustainability of Irish Households’ uses data from the CSO’s Household Finance and Consumption Survey (HFCS) 2018 combined with administrative data sources on personal income and selected COVID-19 income supports. The HFCS is the official sources of household finance statistics in Ireland with statistics on household assets and liabilities, gross income and credit constraints currently available for 2013 and 2018. The analysis combines 2018 HFCS microdata at the individual and household level with administrative income data for the period Q1 2019 to Q3 2020. This allows the estimation of changes in gross household income and debt ratios by household characteristics, household reference person and by distribution over this period. Income and debt developments are estimated both with and without selected COVID-19 income supports. This gives a sense of the mitigating role of these supports. However, following the approach in the CSO’s publication Impact of selected COVID-19 income support on employees (December 2020), the counterfactual ‘without supports’ makes no attempt to estimate likely incomes in case of receipt of ‘traditional’ out-of-work supports like Jobseeker's Allowance or Jobseeker's Benefit.
This analysis is enabled by the linking of HFCS 2018 microdata to administrative data sources by the CSO for statistical purposes using a Protected Identifier Key (PIK), in line with the Statistics Act, 1993 and the CSO Data Protocol, available here: CSO Data Protocol.
The administrative data sources matched to HFCS 2018 microdata include:
• employee earnings, from Revenue Commissioners' (Revenue) PAYE Modernisation (PMOD) payroll data;
• public pension payments, unemployment payments and regular social transfers, from Department of Social Protection (DSP) payments data;
• Pandemic Unemployment Payment (PUP), from DSP payments data;
• Temporary Wage Subsidy Scheme (TWSS), from Revenue; and
• Employment Wage Subsidy Scheme (EWSS), from Revenue.
Before using personal administrative data for statistical purposes, the CSO removes all identifying personal information including the Personal Public Service Number (PPSN). All data sources are pseudonymised prior to linking. The PPSN is a unique number that enables individuals to access social welfare benefits, personal taxation and other public services in Ireland. The CSO converts the PPSN to a Protected Identifier Key (PIK). The PIK is an encrypted and randomised number used by the CSO to enable linking of records across data sources and over time which is internal to the CSO. Using the PIK enables the CSO to link and analyse data for statistical purposes, while protecting the security and confidentiality of the individual data. All records in the datasets are anonymised and the results are published in the form of statistical aggregates which do not identify any individuals.
Household Finance and Consumption Survey 2018
The Household Finance and Consumption Survey (HFCS) is a household survey which collects data on household consumption and finances. It covers areas such as demographics, real and financial assets, liabilities, consumption and saving, income and employment, future pension entitlements, intergenerational transfers, gifts and attitudes to risk. The main aim of the survey is to gather micro-level, structural information on households’ assets and liabilities in the Euro area.
The HFCS 2018 data was collected directly from a sample of private households selected proportionally from the entire population of private households divided into strata defined by 26 counties and 5 bands of deprivation/affluence. Additional households were selected from areas with relatively high home ownership rates and high average Local Property Tax (LPT) bands. This oversampling is common in surveys of this nature since wealth is highly unevenly distributed. There were 4,793 respondent households and a response rate of 45.1% when vacant properties and properties that were not attempted are excluded.
The liabilities of households in the HFCS micro dataset were utilised in this analysis as the basis for estimated Debt Ratios from Q1 2019 to Q3 2020. It is assumed that household liability from 2018 are representative of those in 2019 and 2020, consistent with an analysis of the Central Credit Register. See table 2.3.
Personal and household characteristics from the HFCS were also utilised in the analysis including personal characteristics of the household refence person (age, education attainment) and household characteristics such as household composition and tenure status.
Administrative sources of personal income were used in the analysis to replicate the HFCS income components for the period Q1 2019 to Q3 2020, as illustrated in Table 2.1. Where no administrative data source for income components were available for a household, HFCS personal and household income data were used instead. This accounted for approximately 10% of HFCS records in each quarter. Self-employment income from HFCS 2018 was trended forward to Q3 2020 based upon the sectoral trends in self-employed employment numbers and actual hours worked from the Labour Force Survey.
PAYE Payroll Data
The Revenue Commissioner’s PAYE Modernisation (PMOD) employer-employee payroll returns. PMOD has been operational in the State since 1 January 2019. This data provides information in ‘real-time’ and at payslip level on employee pay, deductions, pension contributions, tax liability, amongst other topics submitted by their employer.
Temporary Wage Subsidy Scheme
Revenue’s Temporary Wage Subsidy Scheme (TWSS) enabled employees, whose employers are affected by the COVID-19 pandemic, to receive supports directly from their employer through the payroll system. The scheme operated in two phases. A transitional phase from 26 March to 3 May and an operational phase from 4 May to 31 August 2020. More detailed information relating to the TWSS can be accessed here: Revenue TWSS Index
Employer Wage Subsidy Scheme
Revenue’s Employment Wage Subsidy Scheme (EWSS) replaced the TWSS and became operational from 1 September 2020. The EWSS is an economy-wide enterprise support that focuses primarily on business eligibility. The scheme provides a flat-rate subsidy to qualifying employers based on the numbers of eligible employees on the employer’s payroll and gross pay to employees. More detailed information relating to the EWSS can be accessed here: Revenue EWSS Index
Pandemic Unemployment Payment
The COVID-19 Pandemic Unemployment Payment is available to employees and the self-employed who have lost their job on or after 13 March due to the COVID-19 pandemic. It is operated by the Department of Social Protection. Information on qualifying criteria, rates of payment and other information can be accessed here: COVID 19 Pandemic Unemployment Payment
Social Transfers
Social transfers to persons and households from the Department of Social Protection’s payments file was utilised to estimate unemployment payments, public pension payments and other social transfer payments to persons.
Data Matching
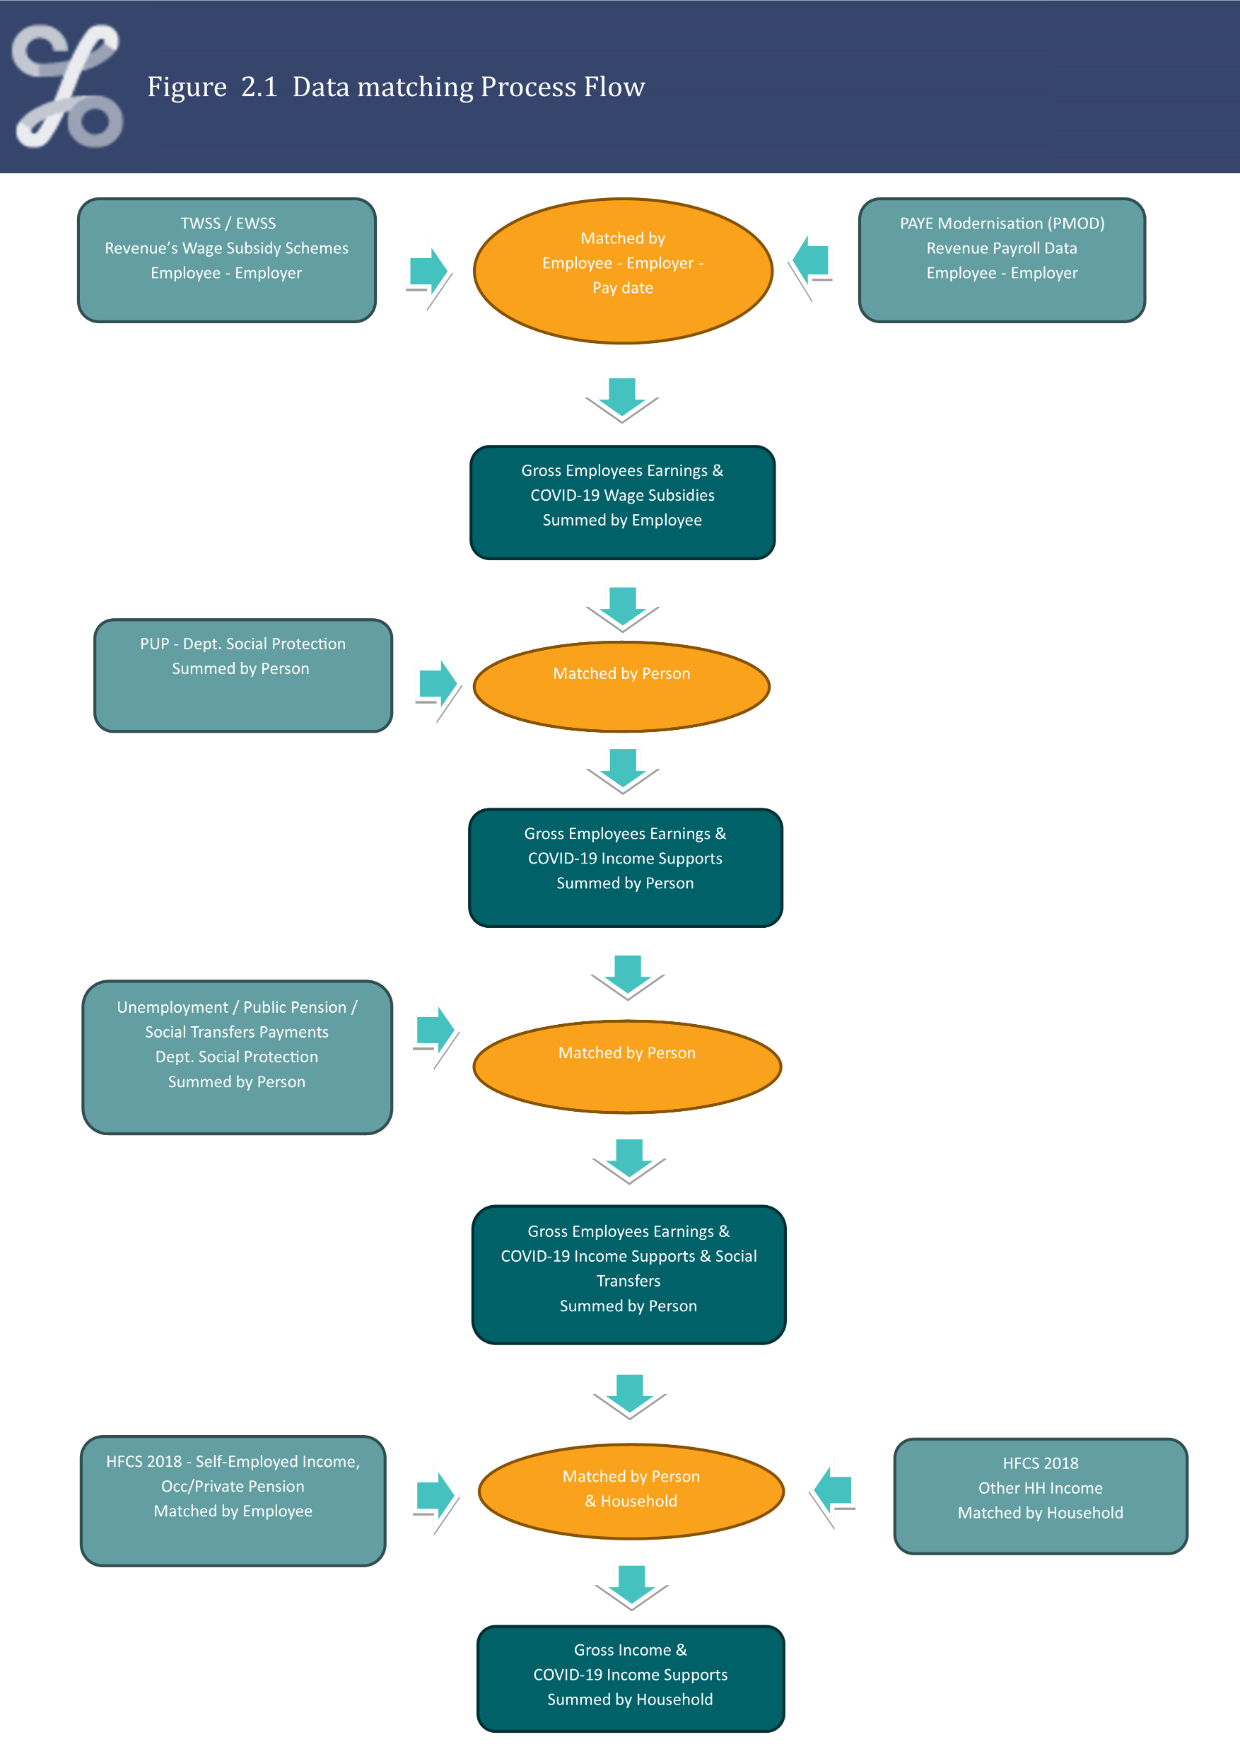
The process by which administrative data sources were linked with each other and to the HFCS is outlined below and illustrated by the Data Matching Process Flow in Figure 2.1. This process was undertaken for the data for each quarter from Q1 2019 to Q3 2020.
1. Employee earnings data from PMOD was merged with COVID-19 wage subsidies data (TWSS and EWSS) by employee, employer and pay date. This was summarised by employee to give total earnings and COVID-19 wage subsidies per employee for each quarter.
2. PUP payment data from the DSP were summarised by person to get the total value of PUP payments received by each person in each quarter. This was matched with the PMOD and wage subsidy data by person to give total earnings and COVID-19 income supports per person for each quarter.
3. DSP Payments data was summarised by person to get the total value of unemployment payments, public pension payment and other social transfers payment received from the DSP by each person in each quarter.
4. The PMOD and COVID-19 Income supports data and the social transfers data were matched to the HFCS 2018 microdata file by person to give total earnings, COVID-19 income supports and social protection income per person for each quarter.
5. The administrative income data were annualised and were supplemented by income components from HFCS 2018. Each of the income and debt variables were summarised at the household level to allow for the estimation of aggregate and distributional income and debt statistics.
Employee Earnings: Earnings from Revenue’s PAYE Modernisation (PMOD) employer-employee payroll dataset is summarised at the employee level to create gross earnings per employee.
COVID-19 Support Income: TWSS and EWSS subsidy amounts paid via the employer and PUP payments received from DSP are summarised per person.
Employee Earnings & COVID-19 Support Income: Employee earnings plus COVID-19 support income, where applicable. Persons with COVID-19 support income and not employee earnings are included in this dataset.
Self-Employed Income: Gross self-employment income (profits/losses of unincorporated enterprises) from HFCS were used as the basis for estimating self-employed income from Q1 2019 to Q3 2020. The 2018 self employed income of each person is trended forward based upon the quarterly trend in the Labour Force Survey (LFS) sector estimates of self-employment numbers and actual hours worked.
When a person had self-employed income in 2018 and received PUP payments in a quarter, their LFS adjusted self-employed income for that quarter is set to zero if their 2018 self-employed income accounted for the majority of their personal income.
Social Transfers
Gross Income from Public Pensions: Pension payments received from DSP is summarised by person and quarter.
Gross Income from Occupational and Private Pension: HFCS 2018 values for gross income from occupational and private pension per person are utilised in each quarter Q1 2019 to Q3 2020.
Gross Income from Unemployment Benefits: Unemployment benefits payments from the DSP was summarised by person and quarter.
Personal Income: Sum of all personal income components per person.
Gross Income from Regular Social Transfers: Other Social transfer payments from the Department of Social Protection was summarised by person and quarter.
Other Household Income: HFCS 2018 values for the below other sources of household income were utilised in each quarter Q1 2019 to Q3 2020. The other sources of household include: Regular private transfers; Financial assistance received from relatives and friends; Gross rental income from real estate property; Gross income from financial investments; Gross income from private business other than self-employment; and Gross income from other income sources
Gross Household Income: For each quarter Q1 2019 to Q3 2020 the above personal and household incomes were summarised by household to produce estimated gross household income values for each household per quarter. These are nominal values and were not adjusted for inflation. Quarterly gross household income was multiplied by 4 to get an annual equivalent value to create an income value comparable to annual debt values and to external data sources for coherence purposes.
Missing Values
Where persons had income in HFCS 2018 but personal income was null from administrative sources the HFCS value is included. Similarly, where households had income in HFCS 2018 but household income was null from administrative sources the HFCS value is used. These instances arise when records cannot be matched between survey and administrative data or in circumstances where no administrative source is currently available for certain income components.
Annualised Quarterly Income
Earnings and income statistics usually display seasonal fluctuations across the year. These fluctuations are mainly due to the receipt of bonus, irregular and seasonal incomes, which usually arise at specific times of the year. Therefore, quarterly earnings and income will have a seasonal element inherent in the data and thus the annualised quarterly income estimates also have this seasonal element built in. This must be considered when interpreting results.
Gross Disposable Income
Gross Disposable Income, which is income after income taxes (PAYE etc) and social contributions (PRSI etc) have been paid, is a distinct measure of households income. This measure of income is not use in this analysis for estimating the trends in houshehold income or household debt sustainability.
The HFCS income components and the data sources used to compile the income estimate between Q1 2019 and Q3 2020 are illustrated in Table 2.2
HFCS debt values and survey-administrative income were summarised by household, which facilitated the estimation of aggregated income statistics and debt ratios for the quarters Q1 2019 to Q3 2020. Median and distributional household income and debt ratios statistics were produced by various personal and household characteristics.
Gross Household Income
Year-on-year changes in gross household income are analysed by distribution and personal and household characteristics.
Debt-to-income Ratio
This is the ratio between total debt and total gross income for indebted households. It is expressed as the (weighted) median. Households with zero debt are excluded from the calculation.
Household Main Residence (HMR) Mortgage Debt-to-income Ratio
This is the ratio between total HMR mortgage liabilities and total gross income households with HMR mortgage debt. It is expressed as the (weighted) median. Households with zero HMR mortgage debt are excluded from the calculation.
Debt Service-to-income Ratio
This is the ratio between total monthly debt payments and household gross monthly income for indebted households. Households with zero debt are excluded from the calculation.
HMR Mortgage Debt Service-to-income Ratio
This is the ratio between the mortgage debt service repayments of a household to the income of that household, for households with mortgage debt. Households with zero income are excluded from the calculation.
Median
This is a common concept used in this report. The median value is the value below which 50 per cent of the observations lie. Because financial and income data is often highly skewed, it is often preferred as a measure compared to the mean, which may be affected by a small number of very high values.
Quintiles
The debt or income quintile groups are five equal-sized groups of households, each group containing 20% of households.
Percentiles
The income and debt percentiles refer to the percentage of data that falls at or below a certain observation. For example, the 25th percentile is the observation (household) that’s equal to 25% of the scores.
Household
A household is defined as a person living alone or a group of people who live together in the same private dwelling and share expenditures, including the joint provision of the essentials of living, such as catering arrangements. The household members defined in this fashion are usually, but not necessarily, related by blood or by marriage. Any other individual or group of people living in the same dwelling constitutes a separate household.
Household Reference Person
This person is considered to be the person who is most knowledgeable about the financial situation of the household and provides the financial information for the whole household, since this information is collected together for the whole household instead of by individual members. This is done to both minimise response burden and to avoid duplications (since many assets and liabilities are shared between household members).
Classifications
The classifications used in this analysis are based upon data from HFCS 2018 and have not been amended based upon administrative sources. Classifications used in the analysis include:
• Age of Household Reference Person
• Highest Level of Education of Household Reference Person
• Tenure Status
• Household composition
• NUTS2 Region
Representativeness of HFCS-Administrative Sources Compared to Administrative Data Only
The HFCS 2018 sample was selected to be representative of private households and this analysis assumes that the structure of Irish households has not significantly changed since and that the HFCS 2018 microdata remains representative, when weights are applied, of private households in 2019 and 2020.
A comparison of mean and median gross employee earnings between the matched HFCS-Administrative data estimates and the administrative data (PMOD) alone illustrates that the matched data estimated median earnings were between 2.5% and 5% higher over the period. When the HFCS oversample of wealthier households, to accurately estimate assets, liabilities and wealth of high value households, was included, mean gross earnings estimates from the matched HFCS-Administrative data was skewed to the higher end of the earnings distribution and median earnings was between 5% and 8% higher than the estimates from PMOD earnings only over the period. See table 2.2
Representativeness of HFCS-Administrative Sources Compared to CSO Survey Outputs
Household income collected in the HFCS can be compared with that from Administrative sources to assess how well the administrative source replicate the survey data. Gross household income from the Survey of Income and Living Conditions (SILC) is the official source of household income in Ireland. When compared to comparable SILC gross household income HFCS 2018 gross household income was 2.0% (mean) and 2.6% (median) higher than that of SILC in 2018. HFCS-Administrative Sources gross household income for 2019 was 5.5% (mean) and 2.2% (median) higher than that of comparable SILC estimates in 2019. See table 2.3.
The difference in income in these two sources reflects the alternative sources used to compile the HFCS-Administrative estimates and seasonal income fluctuations unaccounted for in annualised quarterly estimates. Also, the exact definition of income for HFCS and SILC cannot be fully replicated from administrative sources. The larger difference between mean values of SILC and HFCS-Administrative Sources 2019 suggests that the HFCS-Administrative dataset is skew to the higher side of the income distribution, which is consistent with the inclusion of an oversample of higher wealth households, illustrated in table 2.2.
When comparing the HFCS 2018 aggregated income statistics with those from the HFCS-Administrative sources it is clear there is a level shift between the two sources. Personal income components are higher in the HFCS-Administrative estimates, significantly so in the estimated social transfers.
The largest discrepancy was for the component Unemployment income, such as jobseeker allowance or benefit. These estimates were derived from the DSP payments file and represent the annualised amount persons received in each quarter. The annualising of quarterly values will likely over estimate these values as recipients of these payments may not be eligible to receive them for the full year, which we cannot account for. For this reason, the Q1 2019 values for unemployment benefits and other social transfers are likely to be over-estimated in comparison to HFCS 2018. See table 2.4.
Comparison Between HFCS 2018 Debt and Central Credit Register Debt in 2020
The HFCS 2018 debt levels and structures were left unchanged in this analysis, using the incomes dynamics of the last two years drive the changes in debt sustainability. The structure of Irish household debt has not changed significantly since 2018, this is evident from a review of the aggregated view from the Central Credit Register (CCR) undertaken by the Central Bank. The debt distribution has remained generally unchanged and in-line with HFCS 2018 estimates. See table 2.5.
Analyis of COVID-19 Income Support Recipients by Household Income and Personal Earnings Distributions
Figure 2.2 illustrates the proportion of COVID-19 income support recipient in each household income or personal earnings decile in Q2 2020. It is evident that COVID-19 income supports recipients were mainly in the lower half of the personal earnings distribution, with 77.8% of recipients in the first 5 deciles and 24.2% in the 3rd earnings decile. This compares to the household income distribution where 35.9% were in the lower half of the distribution and 64.1% of support recipient were in the top 5 deciles. This illustrates the effect joining persons into household units has on the impact of the COVID-19 income supports. See table 2.6.
| Equivalise Household Income | Personal Earnings | |
| 1st | 4 | 5.4 |
| 2nd | 5 | 15.3 |
| 3rd | 11.4 | 24.2 |
| 4th | 15.2 | 19 |
| 5th | 13.7 | 14 |
| 6th | 15.3 | 10.7 |
| 7th | 12.7 | 6.6 |
| 8th | 10.7 | 3.5 |
| 9th | 7.2 | 1 |
| 10th | 4.8 | 0.4 |
Revisions
The data included in this publication are subject to revision as more information relating to employments and earnings from the Revenue Commissioners and social transfers from the DSP is made available to the CSO for statistical analysis purposes.
Exclusions
The analysis undertaken in this publication excludes the following record from the administrative data sources used. Any records:
• with an invalid PIK.
• with missing sex, age, PRSI class or NACE code.
• in PRSI class ‘M’.
• Any records with zero pay amount in a transaction.
Go to next chapter >>> Contact Details
CSO statistical release, , 11am
Learn about our data and confidentiality safeguards, and the steps we take to produce statistics that can be trusted by all.