
This publication is categorised as a CSO Frontier Series Output. Particular care must be taken when interpreting the statistics in this release as it may use new methods which are under development and/or data sources which may be incomplete, for example new administrative data sources.
This publication uses the Corine Land Cover Accounting Layers datasets developed by the European Environment Agency for the years 2000, 2006, 2012, and 2018. The land cover classes are grouped into 12 categories of ecosystem type and a balancing item. The classification used follows the ecosystem typology developed by the European Commission as part of the upcoming legal module on ecosystem accounting proposed as an amendment to EU regulation 691/2011. See Background Notes for further details.
This Chapter is divided into two sections:
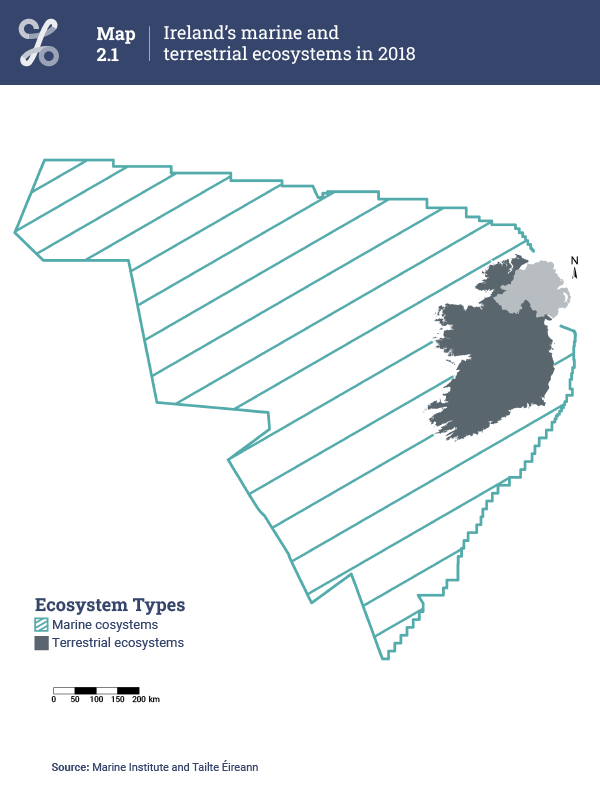
Between 2000 and 2018, Ireland's territory extended over almost 78,807,000 hectares. This included terrestrial, transitional and marine ecosystems. Terrestrial and transitional ecosystems covered about 7,068,000 hectares, while marine ecosystems were ten times larger with around 71,739,000 hectares. See Table 2.1, Table 2.2 and Map 2.1. This publication will focus on both terrestrial and transitional ecosystems. Marine habitats will be explored in a future frontier publication.
Although the extent of terrestrial and transitional ecosystems varied over the 2000-2018 period, four ecosystem types remained predominant in Ireland during this time. Grasslands were the main ecosystems covering 55% of Ireland in 2000 and 2018. The next three most prevalent ecosystem types were Inland Wetlands (15% in 2000 and 14% in 2018), Croplands (13% in 2000 and 12% in 2018), and Forests & Woodlands (9% in 2000 and 10% in 2018). See Figure 2.1 and Table 2.3.
| Settlements & Other Artificial Areas | Croplands | Grasslands | Forests & Woodlands | Heathlands & Shrubs | Sparsely Vegetated Ecosystems | Inland Wetlands | Rivers & Canals | Lakes & Reservoirs | Coastal Beaches, Dunes & Associated Habitats | Marine Inlets, Transitional Waters & Wetlands | Balancing Item | |
| 2000 | 2.1 | 13 | 55.4 | 9.1 | 1.8 | 0.9 | 14.5 | 0.1 | 1.6 | 0.3 | 1.1 | 0 |
| 2006 | 2.4 | 12.8 | 55 | 9.8 | 1.8 | 0.9 | 14.1 | 0.1 | 1.6 | 0.3 | 1.1 | 0 |
| 2012 | 2.4 | 12.5 | 55.1 | 10.1 | 1.8 | 0.9 | 14 | 0.1 | 1.6 | 0.3 | 1.1 | 0 |
| 2018 | 2.5 | 12.4 | 55 | 10.3 | 1.8 | 0.9 | 13.9 | 0.1 | 1.6 | 0.3 | 1.1 | 0.1 |
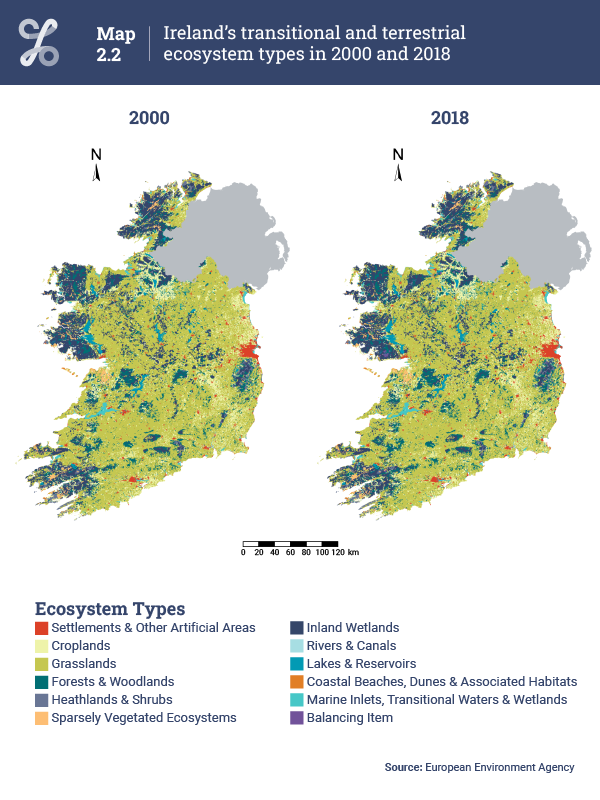
In 2018, Inland Wetlands (i.e., mainly raised bogs and blanket bogs) were mostly located along the west coast, in the midlands and in the Wicklow Mountains. Similarly, Heathlands & Shrubs occurred mainly along the west coast and in the Wicklow Mountains. Settlements & Other Artificial Areas were mostly concentrated around cities on the east coast and gradually decreased in density towards the west coast. The rest of the country was occupied by Grasslands, Croplands, and Forests & Woodlands. See Map 2.2, for an interactive version click here and zoom in on your own area! See also the animated Map 2.3 for the change in terrestrial and transitional ecosystems going through 2000, 2006, 2012 and 2018.
Six ecosystem types had important changes over the 2000-2018 period. The extent of Settlements & Other Artificial Areas rose by almost 16% (23,842 hectares), while Forests & Woodlands gained about 13% (82,692 hectares) from 2000 to 2018. See Figure 2.2, Tables 2.1 and 2.2.
These increases did not happen gradually over time. Both ecosystem types surged between 2000 and 2006 with the addition of more than 50,000 hectares of Forests & Woodlands and just above 19,000 hectares of Settlements & Other Artificial Areas. In comparison, their recent growths between 2012-2018 were less than 15,000 hectares for Forests & Woodlands, and about 2,500 hectares for Settlements & Other Artificial Areas. See Figure 2.2, Tables 2.1 and 2.2.
Croplands (5%; 41,337 hectares), Inland Wetlands (4%; 40,953 hectares), and Heathlands & Shrubs (2%; 2,350 hectares) had the biggest percentage decreases in ecosystem extents from 2000 to 2018. Grasslands declined slightly by 1% of their initial extent with the loss of almost 30,000 hectares. See Figure 2.2, Tables 2.1 and 2.2.
These reductions mainly happened between 2000 and 2006 for Inland Wetlands (30,084 hectares), over 2006-2012 for Croplands (19,502 hectares), but more recently between 2012 and 2018 for Heathlands & Shrubs (1,502 hectares). The main drop in Grasslands occurred prior to 2006 with the loss of around 25,000 hectares. Grasslands had a small recovery over 2006-2012 with the addition of almost 4,000 hectares, but more recently decreased by 8,200 hectares between 2012 and 2018. See Figure 2.2, Tables 2.1 and 2.2.
| X-axis label | Change from 2000 to 2018 | Change from 2012 to 2018 |
|---|---|---|
| Forests & Woodlands | 82692 | 14876 |
| Settlements & Other Artificial Areas | 23842 | 2486 |
| Croplands | -41337 | -8121 |
| Inland Wetlands | -40953 | -7211 |
| Grasslands | -29547 | -8200 |
| Heathlands & Shrubs | -2350 | -1502 |
| Balancing Item | 7767 | 7767 |
Changes in ecosystem extent are always a balance: some ecosystem types are lost for the benefit of others. Over the 2000-2018 period, 42% of the increase in Forests & Woodlands was due to the conversion of Inland Wetlands (35,250 hectares), whereas 41% came from Grasslands (34,453 hectares). New Settlements & Other Artificial Areas were mainly built on agricultural lands with 64% on Grasslands (15,879 hectares), and 30% on Croplands (7,552 hectares). See Figure 2.3 and Table 2.4.
About 80% of the Croplands lost between 2000 and 2018 were converted to Grasslands (85,162 hectares), while 13% became Forests & Woodlands (13,830 hectares) and 7% changed to Settlements & Other Artificial Areas (7,552 hectares). Interestingly, more than half of the decrease in the extent of Grasslands remained agricultural lands by being converted into Croplands at 56% (64,922 hectares). The remaining 44% were changed into Forests & Woodlands (30%; 34,453 hectares) and Settlements & Other Artificial Areas (14%; 15,879 hectares). See Figure 2.3 and Table 2.4.
Of the circa 41,000 hectare decline in Inland Wetlands, more than 85% (35,250 hectares) was converted to Forests & Woodlands, while 13% (5,530 hectares) was recorded as burnt areas. For Heathlands & Shrubs, most of the loss was due to fire (64%; 1,636 hectares). See Figure 2.3 and Table 2.4.
Learn about our data and confidentiality safeguards, and the steps we take to produce statistics that can be trusted by all.