
This publication is categorised as a CSO Frontier Series Output. Particular care must be taken when interpreting the statistics in this release as it may use new methods which are under development and/or data sources which may be incomplete, for example new administrative data sources.
This publication presents initial ecosystem condition accounts for Ireland's rivers and lakes based on the ecological status reported by the Environmental Protection Agency (EPA) under the Water Framework Directive (WFD). Condition accounts record the condition of ecosystems in terms of selected characteristics at specific points in time. Over time, these accounts can be used to examine changes in condition, and provide information on the health and function of ecosystems and their capacity to provide ecosystem services. See Background Notes for more information on the WFD, and Information Note on Ecosystem Accounting for more information on condition accounts.
For WFD reporting, Ireland's rivers have been divided into 3,192 discrete sections of river called river water bodies, of which a subset are monitored for ecological status. To compile this preliminary set of condition accounts, only river and lake water bodies monitored in both the first (2010-2015) and second (2016-2021) cycles of the River Basin Management Plans (RBMPs) were included. Of the 2,334 river water bodies monitored in both cycles, almost 57% (1,326) were in Good or High ecological status in the 2010-2015 period, compared with 52% (1,213) in the 2016-2021 period, representing a decrease of around 9%. In the 2010-2015 period, around 60% (34,726 km) of the total length of monitored river water bodies achieved Good or High ecological status, compared with 55% (31,683 km) in the 2016-2021 period, a decrease of 9%.
A small increase in the number of lake water bodies achieving Good or High ecological status was recorded between the time periods, with 46% (103) of the monitored lake water bodies achieving Good or High status in the 2010-2015 period, compared with 48% (107 water bodies) in the 2016-2021 period. This small increase in the number of lake water bodies (around 4%) results in a relatively large increase in area, going from 43% in 2010-2015 to almost 62% in 2016-2021, an increase of around 43% (Table 2.1).
By relating each variable to a reference level, the ecosystem condition variables can be used to calculate ecosystem condition indicator values (see Background Notes for details). In this case, decreases in the number and length of river water bodies reaching Good or High ecological status are reflected in changes in indicator values, with a decrease from 0.57 to 0.52 for number and a decrease from 0.60 to 0.55 for length. Similarly, the increases in number and area of lake water bodies achieving Good or High ecological status can be seen by looking at the indicator values, with an increase from 0.46 to 0.48 for number of water bodies, and an increase from 0.43 to 0.62 for area of lake water bodies (Table 2.1).
| Table 2.1 Ecosystem condition accounts for rivers and lakes 2010-20211, 2 | |||||||||||
| Variable values | Reference level values | Indicator3 values (rescaled) | |||||||||
| Opening value (2010-2015) | Closing value (2016-2021) | Upper level (all reaching Good or High ecological status) | Lower level (none reaching Good or High ecological status) | Opening value (2010-2015) | Closing value (2016-2021) | Change in indicator | Change in indicator (%) | ||||
| Monitored river water bodies with High or Good ecological status | |||||||||||
| number | 1,326 | 1,213 | 2,334 | 0 | 0.57 | 0.52 | -0.05 | -8.5 | |||
| length (km) | 34,726 | 31,683 | 57,702 | 0 | 0.60 | 0.55 | -0.05 | -8.8 | |||
| % of total river water bodies | 56.8 | 52.0 | 100 | 0 | 0.57 | 0.52 | -0.05 | -8.5 | |||
| % of total length | 60.2 | 54.9 | 100 | 0 | 0.60 | 0.55 | -0.05 | -8.8 | |||
| Monitored lake water bodies with High or Good ecological status | |||||||||||
| number | 103 | 107 | 222 | 0 | 0.46 | 0.48 | 0.02 | 3.9 | |||
| area (hectares) | 41,725 | 59,588 | 96,298 | 0 | 0.43 | 0.62 | 0.19 | 42.8 | |||
| % of total lake water bodies | 46.4 | 48.2 | 100 | 0 | 0.46 | 0.48 | 0.02 | 3.9 | |||
| % of total area | 43.3 | 61.9 | 100 | 0 | 0.43 | 0.62 | 0.19 | 42.8 | |||
| 1 Accounts are for those river and lake water bodies monitored in both the first (2010-2015) and second (2016-2021) cycles of the River Basin Management Plans | |||||||||||
| 2 Figures presented in this table are rounded. Percentages and indicator values are calculated using unrounded figures | |||||||||||
| 3 Indicator = (V-VL)/(VH-VL), where V = variable, VH is the high condition score, and VL is the low condition score | |||||||||||
When comparing the two assessment periods, the ecological status of 1,396 river water bodies remained unchanged. The ecological status of 407 water bodies improved, including 196 river water bodies that moved from the Moderate, Poor or Bad category to the Good or High category. A decline in ecological status was reported for 531 river water bodies, including 309 water bodies that moved from the Good or High category to the Moderate, Poor or Bad category (Figure 2.1, Table 2.2).
For lake water bodies, 143 remained unchanged, while the ecological status of 46 increased, including 19 that moved from Moderate, Poor or Bad to the Good or High category. Decreases in ecological status were seen in 33 lake water bodies, including 15 that moved from the Good or High category to the Moderate, Poor or Bad category (Figure 2.2, Table 2.2).
| X-axis label | Good or High | Moderate, Poor or Bad |
|---|---|---|
| Status decreased within category | 102 | 120 |
| Status increased within category | 89 | 122 |
| Status increased to change category | 196 | 0 |
| Status decreased to change category | 0 | 309 |
| No change in status | 826 | 570 |
| X-axis label | Good or High | Moderate, Poor or Bad |
|---|---|---|
| Status decreased within category | 10 | 8 |
| Status increased within category | 3 | 24 |
| Status increased to change category | 19 | 0 |
| Status decreased to change category | 0 | 15 |
| No change in status | 75 | 68 |
| Table 2.2 Changes1 in ecological status of river and lake water bodies between 2010-2015 and 2016-2021 assessment periods | ||||
| Ecological status category in 2016-2021 | Change from 2010-2015 | River water bodies | Lake water bodies | |
| Good or High | Status decreased within category | 102 | 10 | |
| Status increased within category | 89 | 3 | ||
| Status increased from Moderate, Poor or Bad | 196 | 19 | ||
| No change in status | 826 | 75 | ||
| Moderate, Poor or Bad | Status decreased within category | 120 | 8 | |
| Status increased within category | 122 | 24 | ||
| Status decreased from Good or High | 309 | 15 | ||
| No change in status | 570 | 68 | ||
| Total | 2,334 | 222 | ||
| 1 Changes reported are for those river and lake water bodies monitored in both the first (2010-2015) and second (2016-2021) cycles of the River Basin Management Plans | ||||
The total number of river water bodies monitored by the EPA has been increasing since monitoring for the WFD commenced, from 2,161 in the 2007-2009 period to 2,398 in the 2016-2021 period. The percentage of monitored river water bodies reaching Good or High status was highest in the 2010-2012 period at 60% (1,369 water bodies), and there has been a decrease in every monitoring period since then, with around 51% (1,234 water bodies) in Good or High status in 2016-2021. The number of monitored river water bodies in Bad ecological status has decreased from 19 in the 2007-2009 period to 5 in the 2016-2021 period (Figure 2.3, Table 2.3).
| X-axis label | High | Good | Moderate | Poor | Bad |
|---|---|---|---|---|---|
| 2007-2009 | 287 | 973 | 549 | 333 | 19 |
| 2010-2012 | 324 | 1045 | 560 | 338 | 11 |
| 2010-2015 | 245 | 1085 | 597 | 412 | 6 |
| 2013-2018 | 196 | 1051 | 656 | 443 | 9 |
| 2016-2021 | 232 | 1002 | 716 | 443 | 5 |
| Table 2.3 Ecological status of monitored river water bodies (2007-2021) | |||||
| Assessment period | |||||
| Status | 2007-2009 | 2010-2012 | 2010-2015 | 2013-2018 | 2016-2021 |
| High | 287 | 324 | 245 | 196 | 232 |
| Good | 973 | 1,045 | 1,085 | 1,051 | 1,002 |
| Moderate | 549 | 560 | 597 | 656 | 716 |
| Poor | 333 | 338 | 412 | 443 | 443 |
| Bad | 19 | 11 | 6 | 9 | 5 |
| Total | 2,161 | 2,278 | 2,345 | 2,355 | 2,398 |
The spatial distribution and ecological status of river water bodies for the 2016-2021 assessment period is shown in Map 2.1.
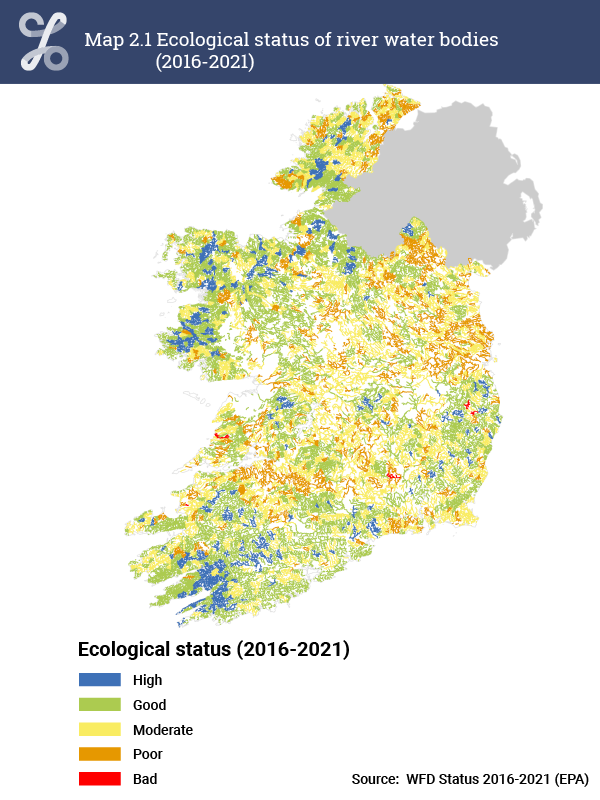
The counties with the lowest percentage of monitored river water bodies in Good or High ecological status in the 2016-2021 period were Louth (20%), Dublin (21%), and Kildare (21%). Cork (73%), Leitrim (72%), and Wicklow (71%) were the counties with the highest percentage of river water bodies in Good or High ecological status (Figure 2.4, Table 2.4).
| X-axis label | High | Good | Moderate | Poor | Bad |
|---|---|---|---|---|---|
| Cork | 52 | 131 | 60 | 9 | 0 |
| Donegal | 20 | 66 | 62 | 46 | 0 |
| Mayo | 36 | 90 | 44 | 11 | 0 |
| Tipperary | 1 | 54 | 74 | 40 | 0 |
| Galway | 17 | 74 | 37 | 29 | 0 |
| Kerry | 22 | 77 | 34 | 13 | 1 |
| Clare | 3 | 49 | 27 | 26 | 1 |
| Wicklow | 14 | 59 | 23 | 5 | 2 |
| Wexford | 4 | 41 | 31 | 12 | 0 |
| Meath | 1 | 22 | 29 | 32 | 0 |
| Limerick | 2 | 34 | 24 | 19 | 0 |
| Offaly | 3 | 23 | 33 | 17 | 0 |
| Sligo | 16 | 30 | 19 | 10 | 0 |
| Laois | 4 | 38 | 18 | 15 | 0 |
| Cavan | 5 | 35 | 15 | 20 | 0 |
| Roscommon | 2 | 26 | 24 | 22 | 0 |
| Monaghan | 4 | 15 | 17 | 28 | 0 |
| Kilkenny | 3 | 23 | 26 | 10 | 1 |
| Waterford | 11 | 21 | 14 | 10 | 0 |
| Leitrim | 6 | 33 | 14 | 1 | 0 |
| Kildare | 1 | 10 | 20 | 21 | 0 |
| Westmeath | 0 | 16 | 17 | 17 | 0 |
| Carlow | 2 | 15 | 21 | 3 | 0 |
| Dublin | 2 | 5 | 10 | 16 | 0 |
| Longford | 1 | 10 | 9 | 5 | 0 |
| Louth | 0 | 5 | 14 | 6 | 0 |
| Table 2.4 Ecological status of monitored river water bodies by county (2016-2021) | |||||||||
| County | High | Good | Moderate | Poor | Bad | Good or High | Good or High (%) | ||
| Carlow | 2 | 15 | 21 | 3 | 0 | 17 | 41.5 | ||
| Cavan | 5 | 35 | 15 | 20 | 0 | 40 | 53.3 | ||
| Clare | 3 | 49 | 27 | 26 | 1 | 52 | 49.1 | ||
| Cork | 52 | 131 | 60 | 9 | 0 | 183 | 72.6 | ||
| Donegal | 20 | 66 | 62 | 46 | 0 | 86 | 44.3 | ||
| Dublin | 2 | 5 | 10 | 16 | 0 | 7 | 21.2 | ||
| Galway | 17 | 74 | 37 | 29 | 0 | 91 | 58 | ||
| Kerry | 22 | 77 | 34 | 13 | 1 | 99 | 67.3 | ||
| Kildare | 1 | 10 | 20 | 21 | 0 | 11 | 21.2 | ||
| Kilkenny | 3 | 23 | 26 | 10 | 1 | 26 | 41.3 | ||
| Laois | 4 | 38 | 18 | 15 | 0 | 42 | 56 | ||
| Leitrim | 6 | 33 | 14 | 1 | 0 | 39 | 72.2 | ||
| Limerick | 2 | 34 | 24 | 19 | 0 | 36 | 45.6 | ||
| Longford | 1 | 10 | 9 | 5 | 0 | 11 | 44 | ||
| Louth | 0 | 5 | 14 | 6 | 0 | 5 | 20 | ||
| Mayo | 36 | 90 | 44 | 11 | 0 | 126 | 69.6 | ||
| Meath | 1 | 22 | 29 | 32 | 0 | 23 | 27.4 | ||
| Monaghan | 4 | 15 | 17 | 28 | 0 | 19 | 29.7 | ||
| Offaly | 3 | 23 | 33 | 17 | 0 | 26 | 34.2 | ||
| Roscommon | 2 | 26 | 24 | 22 | 0 | 28 | 37.8 | ||
| Sligo | 16 | 30 | 19 | 10 | 0 | 46 | 61.3 | ||
| Tipperary | 1 | 54 | 74 | 40 | 0 | 55 | 32.5 | ||
| Waterford | 11 | 21 | 14 | 10 | 0 | 32 | 57.1 | ||
| Westmeath | 0 | 16 | 17 | 17 | 0 | 16 | 32 | ||
| Wexford | 4 | 41 | 31 | 12 | 0 | 45 | 51.1 | ||
| Wicklow | 14 | 59 | 23 | 5 | 2 | 73 | 70.9 | ||
| Total | 232 | 1,002 | 716 | 443 | 5 | 1,234 | |||
The total number of lake water bodies monitored by the EPA has increased from 220 in the 2007-2009 period to 224 in the 2016-2021 period. The percentage of monitored lake water bodies reaching Good or High status was highest in the 2013-2018 period at 50% (113 water bodies), with the lowest percentage of 44% reported in the 2010-2012 period. Around 48% (107 water bodies) were in Good or High status in the 2016-2021 period. The number of monitored lake water bodies in Bad ecological status peaked at 19 in the 2010-2012 and 2010-2015 assessment periods, and decreased to 8 waterbodies in the 2016-2021 period (Figure 2.5, Table 2.5).
| X-axis label | High | Good | Moderate | Poor | Bad |
|---|---|---|---|---|---|
| 2007-2009 | 24 | 82 | 78 | 22 | 14 |
| 2010-2012 | 22 | 77 | 73 | 32 | 19 |
| 2010-2015 | 25 | 78 | 75 | 28 | 19 |
| 2013-2018 | 17 | 96 | 72 | 28 | 11 |
| 2016-2021 | 17 | 90 | 81 | 28 | 8 |
| Table 2.5 Ecological status of monitored lake water bodies (2007-2021) | |||||
| Assessment period | |||||
| Status | 2007-2009 | 2010-2012 | 2010-2015 | 2013-2018 | 2016-2021 |
| High | 24 | 22 | 25 | 17 | 17 |
| Good | 82 | 77 | 78 | 96 | 90 |
| Moderate | 78 | 73 | 75 | 72 | 81 |
| Poor | 22 | 32 | 28 | 28 | 28 |
| Bad | 14 | 19 | 19 | 11 | 8 |
| Total | 220 | 223 | 225 | 224 | 224 |
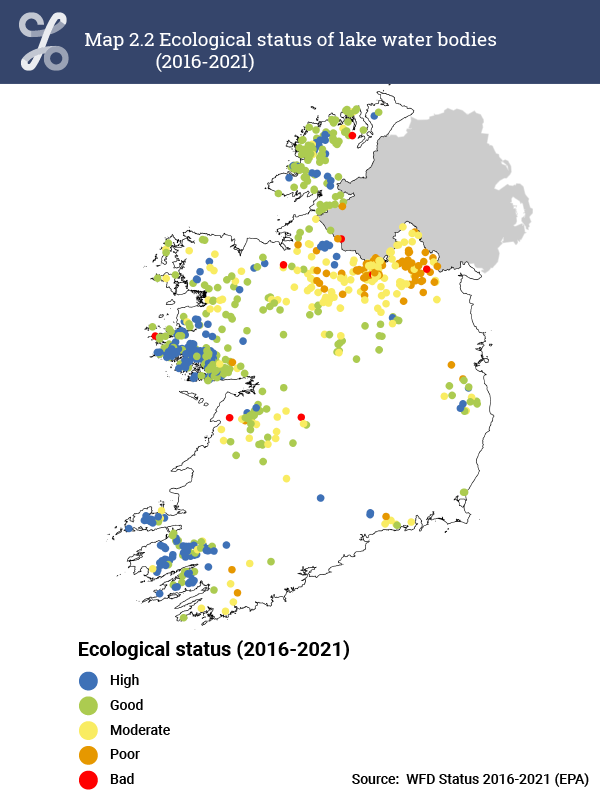
The spatial distribution and ecological status of lake water bodies for the 2016-2021 assessment period is shown in Map 2.2.
Learn about our data and confidentiality safeguards, and the steps we take to produce statistics that can be trusted by all.