
This publication is categorised as a CSO Frontier Series Output. Particular care must be taken when interpreting the statistics in this release as it may use new methods which are under development and/or data sources which may be incomplete, for example new administrative data sources.
Ecosystem extent accounts consider the extent of various ecosystem types in terms of area and how they change over time or over an accounting period. This chapter will particularly focus on the extent of Grasslands and Croplands, their changes between 2000 and 2018 and major conversions that occur between Grasslands and Croplands and other ecosystem types such as Settlements & Other Artificial Areas and Forests & Woodlands.
Grasslands and Croplands accounted for almost 62% and 6% respectively of Ireland's terrestrial and transitional ecosystems in 2018. Grasslands covered 4,360,500 hectares in 2018, a decrease of just 1% or 42,600 hectares from 2000 (4,403,100 hectares). Croplands comprised 401,700 hectares in 2018, a 7% (28,300 hectares) decrease on the 430,000 hectares of Croplands in 2000.
Grasslands and Croplands are broken down into different subcategories at level 2 of the EU ecosystem typology as shown in Table 2.1. Similar to Grasslands and Croplands, Settlements & Other Artificial Areas are also a crop provisioning ecosystem and they are presented here at level 1 of this typology from an extent perspective. Settlements & Other Artificial Areas are considered a crop provisioning ecosystem to account for crops which are grown in artificial settings i.e. under glass or high accessible cover. Please refer to the Background Notes for further information on the EU ecosystem typology and the crosswalk between the EU level 1 ecosystem typology and the Corine Land Cover (CLC) accounting layers.
| Table 2.1 EU Ecosystem Typology - Crop Provisioning Ecosystems | |
| Level 1 | Level 2 |
| Croplands | Annual Cropland |
| Permanent Crops | |
| Mixed Farmland | |
| Grasslands | Sown Pastures and Fields (Modified Grasslands) |
| Natural and Semi-Natural Grassland | |
| Settlements & Other Artificial Areas | - |
Table 2.2 shows summary ecosystem extent accounts for Settlements & Other Artificial Areas, Croplands, and Grasslands for 2000-2018.
Between 2000 and 2018, Annual Cropland decreased by 7%, from 372,400 hectares in 2000 to 346,700 hectares in 2018 while Permanent Crops decreased by 25% between 2000 and 2018, from 400 hectares to 300 hectares. Mixed Farmland decreased from 57,200 hectares to 54,700 hectares between 2000 and 2018, a decrease of over 4%.
Natural and Semi-Natural Grasslands decreased by over 2% between 2000 and 2018, from 49,300 hectares to 48,200 hectares while Sown Pastures and Fields (Modified Grasslands) fell by almost 1% (41,500 hectares), from 4,353,800 hectares to 4,312,300 hectares.
| Table 2.2 Ecosystem Extent Accounts for Settlements & Other Artificial Areas, Croplands, and Grasslands 2000-2018 | '000 hectares | |||||||
| Settlements & Other Artificial Areas | Croplands | Grasslands | ||||||
| Annual Cropland | Permanent Crops | Mixed Farmland | Sown Pastures and Fields (Modified Grasslands) | Natural and Semi-Natural Grasslands | ||||
| Opening Extent 2000 | 149.6 | 372.4 | 0.4 | 57.2 | 4,353.8 | 49.3 | ||
| Additions to Extent | 24.8 | 64.8 | 0 | 0.7 | 85.7 | 0 | ||
| Reductions to Extent | 0.9 | 90.5 | 0.1 | 3.2 | 127.3 | 1.1 | ||
| Net Change | 23.8 | -25.7 | -0.1 | -2.4 | -41.6 | -1.1 | ||
| Closing Extent 20181 | 173.5 | 346.7 | 0.3 | 54.7 | 4,312.3 | 48.2 | ||
| Source: Corine Land Cover Accounting Layers datasets developed by the European Environment Agency (EEA) | ||||||||
| 1 Due to rounding, the values may not sum to the totals | ||||||||
Figures 2.1 and 2.2 show the change in area of Croplands and Grasslands respectively between 2000 and 2018 while Table 2.3 shows more detailed national extent accounts where additions, reductions and overall net change are considered every six years from 2000-2018 for each ecosystem type.
The decreases in the extent of Annual Cropland and Sown Pastures and Fields (Modified Grasslands) between 2000 and 2018 did not happen gradually over this period. Annual Cropland decreased by almost 15,000 hectares between 2006 and 2012 while Sown Pastures and Fields (Modified Grasslands) decreased by 32,000 hectares in the 2000-2006 period as highlighted by Table 2.3 and Figures 2.1 and 2.2.
| Year | Annual Cropland | Permanent Crops | Mixed Farmland |
|---|---|---|---|
| 2000 | 372.4 | 0.4 | 57.2 |
| 2006 | 366.6 | 0.4 | 56.8 |
| 2012 | 351.7 | 0.4 | 54.7 |
| 2018 | 346.7 | 0.3 | 54.7 |
| Year | Sown Pastures and Fields (Modified Grasslands) | Natural and Semi-Natural Grasslands |
|---|---|---|
| 2000 | 4353.8 | 49.3 |
| 2006 | 4321.8 | 48.4 |
| 2012 | 4323.3 | 48.4 |
| 2018 | 4312.3 | 48.2 |
Maps 2.1 and 2.2 show the distribution of Croplands and Grasslands respectively in 2000 and 2018. Annual Cropland is clearly the dominant Croplands type and is generally concentrated in the east of the country while Sown Pastures and Fields (Modified Grasslands) are widespread all over Ireland except for western parts of Donegal, Mayo, Galway and Kerry and Dublin.
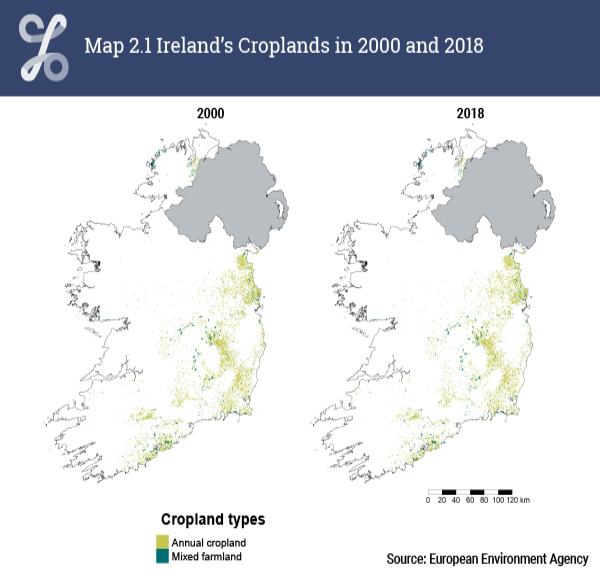
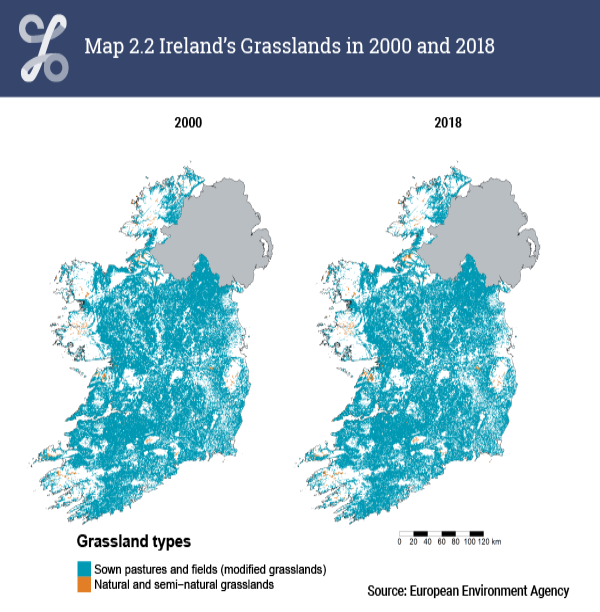
Table 2.4 shows a conversion matrix which highlights the change in ecosystem extent between 2000 and 2018 at national level. Croplands and Grasslands are again included at level 2 of the EU ecosystem typology while Settlements & Other Artificial Areas and Forests & Woodlands are included at level 1 of this typology. Please see Background Notes for further information on conversion matrix interpretation.
Between 2000 and 2018, a total of 23,400 hectares of Grasslands and Croplands were converted to Settlements & Other Artificial Areas. About 73% of this conversion came from Sown Pastures and Fields (Modified Grasslands) while 25% came from Annual Cropland. About 92% (83,000 hectares) of the Annual Cropland area lost in the same period was converted to Sown Pastures and Fields (Modified Grasslands). Around 1,000 hectares of Natural and Semi-Natural Grasslands were converted to Forests & Woodlands. Forests & Woodlands also gained 45,200 hectares from Sown Pastures and Fields (Modified Grasslands) which accounted for about 36% of the reduction in this subcategory of Grasslands. In total, Forests & Woodlands gained 48,300 hectares from Grasslands and Croplands combined.
Figure 2.3 shows the conversion of selected ecosystem types from 2000-2018. Almost 91,000 hectares of Annual Cropland were converted to other ecosystems between 2000 and 2018 while over 127,000 hectares of Sown Pastures and Fields (Modified Grasslands) were changed to other ecosystems in the same period. Mixed Farmland gained almost 1,000 hectares from Sown Pastures and Fields (Modified Grasslands) between 2000 and 2018.
| Table 2.4 Conversion Matrix Showing the Change in Ecosystem Extent from 2000 to 2018 at National Level | '000 hectares | ||||||||||||
| Closing Extent 2018 | |||||||||||||
| Opening Extent 2000 | Settlements & Other Artificial Areas | Annual Cropland | Permanent Crops | Mixed Farmland | Sown Pastures and Fields (Modified Grasslands) | Natural and Semi-Natural Grasslands | Forests & Woodlands | Other Ecosystems1 | Change in ecosystem extent – decrease | Opening Total Extent2 | |||
| Settlements & Other Artificial Areas | 148.7 | 0.2 | 0 | 0 | 0.6 | 0 | 0.2 | 0 | 0.9 | 149.6 | |||
| Annual Cropland | 5.8 | 281.9 | 0 | 0.1 | 83.0 | 0 | 1.6 | 0 | 90.5 | 372.4 | |||
| Permanent Crops | 0 | 0.1 | 0.3 | 0 | 0.1 | 0 | 0 | 0 | 0.1 | 0.4 | |||
| Mixed Farmland | 0.6 | 0.1 | 0 | 54.0 | 2.0 | 0 | 0.4 | 0 | 3.2 | 57.2 | |||
| Sown Pastures and Fields (Modified Grasslands) | 17.0 | 64.4 | 0 | 0.7 | 4,226.6 | 0 | 45.2 | 0 | 127.3 | 4,353.8 | |||
| Natural and Semi-Natural Grasslands | 0 | 0 | 0 | 0 | 0 | 48.2 | 1.0 | 0.1 | 1.1 | 49.3 | |||
| Forests & Woodlands | 0.9 | 0.1 | 0 | 0 | 0.1 | 0 | 643.1 | 0.9 | 1.9 | 645.0 | |||
| Other Ecosystems1 | 0.4 | 0 | 0 | 0 | 0 | 0 | 36.1 | 1,403.6 | 36.6 | 1,440.2 | |||
| Change in ecosystem extent – increase | 24.8 | 64.8 | 0 | 0.7 | 85.7 | 0 | 84.6 | 1.0 | |||||
| Closing Total Extent2 | 173.4 | 346.7 | 0.3 | 54.7 | 4,312.3 | 48.2 | 727.7 | 1404.6 | 7,068.0 | ||||
| Source: Corine Land Cover Accounting Layers datasets developed by the European Environment Agency (EEA) | |||||||||||||
| 1 Includes Heathland & shrub, Sparsely vegetated areas, Inland wetlands, Rivers and canals, Lakes and reservoirs, Marine inlets & transitional waters, Coastal beaches, dunes and Burnt areas | |||||||||||||
| 2 Due to rounding, the values may not sum to the totals | |||||||||||||
Learn about our data and confidentiality safeguards, and the steps we take to produce statistics that can be trusted by all.