
Your feedback can help us improve and enhance our services to the public. Tell us what matters to you in our online Customer Satisfaction Survey.
| Price index (Year ‘05=100) | % monthly change | % annual change | |
| Apr 2013 | 101.7 | +0.3% | +1.9% |
| May 2013 | 102.3 | +0.6% | +1.9% |
| Jun 2013 | 101.1 | -1.2% | +0.4% |

Monthly factory gate prices decreased by 1.2% in June 2013. This compares to an increase of 0.3% for June of last year. As a result, the annual percentage change showed an increase of 0.4% in June 2013, compared with an increase of 1.9% in the year to May 2013. See graph across and table 1.
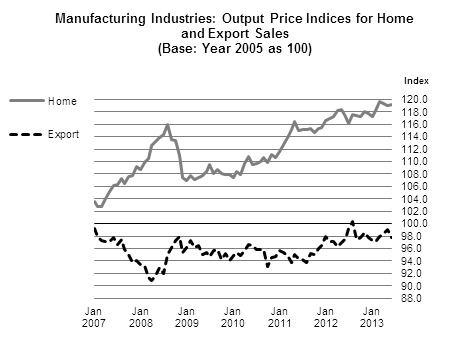
In the month, the price index for export sales decreased by 1.4%, while the index for home sales increased by 0.1%. In the year there was an increase of 0.1% in the price index for export sales (this can be influenced by currency fluctuations) and an increase of 1.6% in respect of the price index for home sales. See table 2 and Figure 2.
In the month, the most significant changes were increases in Dairy products (+3.1%), Fish and fish products (+2.8%) and Wood and wood products (+0.8%), while there were decreases in Computer, electronic and optical products (-2.3%), Other food products including bread and confectionary (-1.9%) and Basic pharmaceutical products and pharmaceutical preparations (-1.5%). See tables 2 and 2A.
Contributing to the annual change were increases in Dairy products (+11.8%), Meat and meat products (+4.4%) and Computer, electronic and optical products (+2.4%), while there were decreases in Chemicals and chemical products (-4.7%), Other food products including bread and confectionary (-3.2%) and Basic pharmaceutical products and pharmaceutical preparations (-0.6%). See tables 2 and 2A.
The yearly price index for Mining and quarrying increased by 1.7% while the monthly index increased by 0.1%. See table 2.
 Show Table 1 Manufacturing Industries Output Price Indices (excluding VAT) Rebased Series 2005 = 100
| Table 1 Manufacturing Industries Output Price Indices (excluding VAT) Rebased Series 2005=100 | ||||||||||
| Base: Year 2005 as 100 | ||||||||||
| Manufacturing Industries Output Price Index | Manufacturing Industries Output Price Index (Home Sales) | Manufacturing Industries Output Price Index (Export Sales) | ||||||||
| Period | Price Index | % Change on preceding period | Annual % change | Price Index | % Change on Preceding Period | Price Index | % Change on Preceding Period | |||
| 2005 | Year | 100.0 | - | - | 100.0 | - | 100.0 | - | ||
| 2006 | Year | 100.4 | 0.4 | 0.4 | 103.5 | 3.5 | 99.8 | -0.2 | ||
| 2007 | Year | 98.1 | -2.3 | -2.3 | 105.8 | 2.2 | 96.6 | -3.2 | ||
| 2008 | Year | 96.8 | -1.3 | -1.3 | 112.0 | 5.9 | 94.0 | -2.7 | ||
| 2009 | Year | 97.5 | 0.7 | 0.7 | 108.0 | -3.6 | 95.5 | 1.6 | ||
| 2010 | Year | 97.6 | 0.1 | 0.1 | 109.6 | 1.5 | 95.3 | -0.2 | ||
| 2011 | Year | 98.1 | 0.5 | 0.5 | 114.6 | 4.6 | 95.0 | -0.3 | ||
| 2012 | Year | 101.0 | 3.0 | 3.0 | 117.4 | 2.4 | 97.9 | 3.1 | ||
| 2011 | Quarter 1 | 98.0 | 1.3 | 0.9 | 112.7 | 2.0 | 95.2 | 1.2 | ||
| Quarter 2 | 97.7 | -0.3 | -0.8 | 115.5 | 2.5 | 94.4 | -0.8 | |||
| Quarter 3 | 97.7 | 0.0 | -0.4 | 115.2 | -0.3 | 94.4 | 0.0 | |||
| Quarter 4 | 98.9 | 1.2 | 2.3 | 115.1 | -0.1 | 95.8 | 1.5 | |||
| 2012 | Quarter 1 | 100.5 | 1.6 | 2.6 | 116.9 | 1.6 | 97.4 | 1.7 | ||
| Quarter 2 | 100.3 | -0.2 | 2.7 | 118.0 | 0.9 | 97.0 | -0.4 | |||
| Quarter 3 | 101.9 | 1.6 | 4.3 | 117.0 | -0.8 | 99.0 | 2.1 | |||
| Quarter 4 | 101.1 | -0.8 | 2.2 | 117.7 | 0.6 | 98.0 | -1.0 | |||
| 2013 | Quarter 1 | 100.8 | -0.3 | 0.3 | 118.4 | 0.6 | 97.5 | -0.5 | ||
| Quarter 2 | 101.7 | 0.9 | 1.4 | 119.2 | 0.7 | 98.4 | 0.9 | |||
| 2011 | January | 98.2 | 1.0 | 1.3 | 111.6 | 0.8 | 95.6 | 1.0 | ||
| February | 98.0 | -0.2 | 0.6 | 112.7 | 1.0 | 95.3 | -0.3 | |||
| March | 97.8 | -0.2 | 0.9 | 113.8 | 1.0 | 94.8 | -0.5 | |||
| April | 97.1 | -0.7 | -0.8 | 115.1 | 1.1 | 93.7 | -1.2 | |||
| May | 98.4 | 1.3 | -0.6 | 116.5 | 1.2 | 95.0 | 1.4 | |||
| June | 97.6 | -0.8 | -1.0 | 115.0 | -1.3 | 94.4 | -0.6 | |||
| July | 97.6 | 0.0 | -0.4 | 115.1 | 0.1 | 94.3 | -0.1 | |||
| August | 97.2 | -0.4 | -1.0 | 115.2 | 0.1 | 93.8 | -0.5 | |||
| September | 98.4 | 1.2 | 0.2 | 115.3 | 0.1 | 95.2 | 1.5 | |||
| October | 98.1 | -0.3 | 2.5 | 114.6 | -0.6 | 95.0 | -0.2 | |||
| November | 99.0 | 0.9 | 1.9 | 115.3 | 0.6 | 96.0 | 1.1 | |||
| December | 99.5 | 0.5 | 2.4 | 115.5 | 0.2 | 96.5 | 0.5 | |||
| 2012 | January | 100.9 | 1.4 | 2.7 | 116.6 | 1.0 | 98.0 | 1.6 | ||
| February | 100.3 | -0.6 | 2.3 | 116.9 | 0.3 | 97.1 | -0.9 | |||
| March | 100.3 | 0.0 | 2.6 | 117.2 | 0.3 | 97.1 | 0.0 | |||
| April | 99.8 | -0.5 | 2.8 | 118.3 | 0.9 | 96.3 | -0.8 | |||
| May | 100.4 | 0.6 | 2.0 | 118.4 | 0.1 | 97.0 | 0.7 | |||
| June | 100.7 | 0.3 | 3.2 | 117.3 | -0.9 | 97.6 | 0.6 | |||
| July | 102.0 | 1.3 | 4.5 | 116.2 | -0.9 | 99.3 | 1.7 | |||
| August | 103.0 | 1.0 | 6.0 | 117.5 | 1.1 | 100.3 | 1.0 | |||
| September | 100.6 | -2.3 | 2.2 | 117.4 | -0.1 | 97.5 | -2.8 | |||
| October | 100.9 | 0.3 | 2.9 | 117.3 | -0.1 | 97.8 | 0.3 | |||
| November | 101.7 | 0.8 | 2.7 | 118.0 | 0.6 | 98.6 | 0.8 | |||
| December | 100.8 | -0.9 | 1.3 | 117.7 | -0.3 | 97.7 | -0.9 | |||
| 2013 | January | 100.5 | -0.3 | -0.4 | 117.3 | -0.3 | 97.3 | -0.4 | ||
| February | 100.5 | 0.0 | 0.2 | 118.3 | 0.9 | 97.2 | -0.1 | |||
| March | 101.4 | 0.9 | 1.1 | 119.7 | 1.2 | 97.9 | 0.7 | |||
| April | 101.7 | 0.3 | 1.9 | 119.4 | -0.3 | 98.4 | 0.5 | |||
| May | 102.3 | 0.6 | 1.9 | 119.1 | -0.3 | 99.1 | 0.7 | |||
| June | 101.1 | -1.2 | 0.4 | 119.2 | 0.1 | 97.7 | -1.4 | |||
| Table 2 Industrial Producer Price Indices (excluding VAT) | |||||||||
| Base Year 2005 as 100 | |||||||||
| Index | Monthly % Change | Annual % Change | |||||||
| NACE code1 | |||||||||
| May 2013 | Jun 2013 | Apr 2013 | May 2013 | June 2013 | June 2013 | ||||
| Food Products | 10 | 128.2 | 127.7 | 0.6 | 0.5 | -0.4 | 2.1 | ||
| Meat and meat products | 101 | 141.7 | 141.2 | 3.5 | 2.2 | -0.4 | 4.4 | ||
| Fish and fish products | 102 | 141.4 | 145.3 | -3.0 | 0.1 | 2.8 | 9.1 | ||
| Fruit and vegetables | 103 | 105.5 | 105.4 | 0.3 | 0.1 | -0.1 | -0.6 | ||
| Vegetables and animal oils and fats | 104 | 151.7 | 151.7 | 0.0 | 0.0 | 0.0 | 8.0 | ||
| Dairy products | 105 | 124.3 | 128.1 | 1.0 | -1.3 | 3.1 | 11.8 | ||
| Grain milling, starches and animal feeds | 106,109 | 146.2 | 146.3 | 0.7 | 0.0 | 0.1 | 11.9 | ||
| Bakery and farinaceous products | 107 | 128.5 | 127.8 | 0.3 | 0.2 | -0.5 | -0.2 | ||
| Other food products | 108 | 121.5 | 119.2 | -0.7 | 0.5 | -1.9 | -3.2 | ||
| Beverages | 11 | 109.1 | 109.0 | 0.1 | 1.2 | -0.1 | 5.2 | ||
| Textiles | 13 | 110.9 | 110.9 | 0.0 | 0.0 | 0.0 | 0.0 | ||
| Wearing apparel | 14 | 103.4 | 103.3 | 0.2 | 0.1 | -0.1 | 0.4 | ||
| Leather and leather products (incl. footwear); dressing and dyeing of fur | 15 | 99.0 | 98.9 | 0.2 | 0.2 | -0.1 | -0.7 | ||
| Wood and wood products | 16 | 113.1 | 114.0 | 0.3 | 0.3 | 0.8 | 0.7 | ||
| Pulp, paper and paper products | 17 | 97.6 | 97.5 | 0.1 | 0.1 | -0.1 | -1.6 | ||
| Printing and reproduction of recorded media | 18 | 99.4 | 98.9 | 0.4 | 0.5 | -0.5 | -3.0 | ||
| Chemicals and chemical products | 20 | 102.1 | 101.5 | -0.1 | 0.2 | -0.6 | -4.7 | ||
| Basic pharmaceutical products and pharmaceutical preparations | 21 | 88.2 | 86.9 | 0.0 | 0.8 | -1.5 | -0.6 | ||
| Rubber and plastic products | 22 | 109.8 | 109.2 | 0.1 | 0.2 | -0.5 | 0.9 | ||
| Other non-metallic mineral products | 23 | 116.1 | 116.0 | 0.3 | -0.1 | -0.1 | 0.4 | ||
| Basic metals | 24 | 133.3 | 131.1 | -0.5 | 0.8 | -1.7 | -3.4 | ||
| Fabricated metal products, except machinery and equipment | 25 | 104.2 | 104.2 | 0.1 | 0.2 | 0.0 | 1.1 | ||
| Computer, electronic and optical products | 26 | 90.7 | 88.6 | 1.6 | 1.3 | -2.3 | 2.4 | ||
| Electrical equipment | 27 | 137.6 | 137.3 | 0.3 | 0.2 | -0.2 | -2.3 | ||
| Machinery and Equipment n.e.c. | 28 | 109.1 | 108.3 | 0.1 | 0.5 | -0.7 | 1.0 | ||
| Motor vehicles, trailers and semi-trailers | 29 | 91.7 | 91.3 | -1.6 | 0.2 | -0.4 | -3.8 | ||
| Furniture | 31 | 101.4 | 99.1 | 0.1 | 0.4 | -2.3 | -2.2 | ||
| Other Manufacturing | 32 | 109.9 | 109.8 | 0.2 | 0.1 | -0.1 | 0.6 | ||
| Mining and quarrying | 05-09 | 113.1 | 113.2 | -1.8 | 0.1 | 0.1 | 1.7 | ||
| Total transportable goods industries | 102.4 | 101.2 | 0.3 | 0.6 | -1.2 | 0.4 | |||
| Food products, Beverages and Tobacco Products | 10-13 | 125.8 | 125.1 | 0.5 | 0.6 | -0.6 | 2.0 | ||
| Manufacturing industries excluding Food Products | 96.9 | 95.6 | 0.3 | 0.5 | -1.3 | 0.0 | |||
| Manufacturing Industries excluding Food Products, | |||||||||
| Beverages and Tobacco Products | 96.4 | 95.1 | 0.2 | 0.5 | -1.3 | -0.2 | |||
| Intermediate goods industries (except energy) | 115.1 | 115.0 | 0.1 | 0.2 | -0.1 | 0.5 | |||
| Capital goods industries | 92.1 | 90.3 | 1.3 | 1.1 | -2.0 | 2.1 | |||
| Durable consumer goods industries | 109.5 | 107.8 | 0.2 | 0.5 | -1.6 | -1.6 | |||
| Non-durable consumer goods industries | 102.1 | 101.0 | 0.2 | 0.7 | -1.1 | 0.1 | |||
| Manufacturing industries (home sales)2 | 119.1 | 119.2 | -0.3 | -0.3 | 0.1 | 1.6 | |||
| Manufacturing industries (export sales)2 | 99.1 | 97.7 | 0.5 | 0.7 | -1.4 | 0.1 | |||
| Total manufacturing industries2 | 102.3 | 101.1 | 0.3 | 0.6 | -1.2 | 0.4 | |||
| 1 Nace Rev. 2 Statistical classification of economic activities in the European Community. | |||||||||
| 2 Excludes Mining and quarrying. | |||||||||
| Table 2A Contribution to changes in the Manufacturing Output Price Index, June 2013 (Table 2) | |||||||
| Industrial sector | NACE code 1 | Contribution to overall % change2 | |||||
| One month | Twelve months | ||||||
| Food Products | 10 | -0.12 | 0.36 | ||||
| Meat and meat products | 101 | -0.03 | 0.22 | ||||
| Fish and fish products | 102 | 0.01 | 0.04 | ||||
| Fruit and vegetables | 103 | -0.00 | -0.00 | ||||
| Vegetables and animal oils and fats | 104 | 0.00 | 0.00 | ||||
| Dairy products | 105 | 0.10 | 0.35 | ||||
| Grain milling, starches and animal feeds | 106,109 | 0.00 | 0.11 | ||||
| Bakery and farinaceous products | 107 | -0.00 | -0.00 | ||||
| Other food products | 108 | -0.21 | -0.36 | ||||
| Beverages | 11 | -0.00 | 0.12 | ||||
| Tobacco Products | 12 | -0.00 | 0.01 | ||||
| Textiles | 13 | -0.00 | 0.00 | ||||
| Wearing apparel | 14 | -0.00 | 0.00 | ||||
| Leather and leather products (incl. footwear); dressing and dyeing of fur | 15 | -0.00 | -0.00 | ||||
| Wood and wood products | 16 | 0.01 | 0.01 | ||||
| Pulp, paper and paper products | 17 | -0.00 | -0.01 | ||||
| Printing and reproduction of recorded media | 18 | -0.01 | -0.04 | ||||
| Coke and refined petroleum products | 19 | -0.06 | -0.38 | ||||
| Chemicals and chemical products | 20 | -0.01 | -0.11 | ||||
| Basic pharmaceutical products and pharmaceutical preparations | 21 | -0.41 | -0.16 | ||||
| Rubber and plastic products | 22 | -0.01 | 0.02 | ||||
| Other non-metallic mineral products | 23 | -0.00 | 0.01 | ||||
| Basic metals | 24 | -0.01 | -0.03 | ||||
| Fabricated metal products, except Machinery and equipment | 25 | 0.00 | 0.02 | ||||
| Computer, electronic and optical products | 26 | -0.50 | 0.53 | ||||
| Electrical equipment | 27 | -0.00 | -0.04 | ||||
| Machinery and Equipment n.e.c. | 28 | -0.02 | 0.03 | ||||
| Motor vehicles, trailers and semi-trailers | 29 | -0.00 | -0.03 | ||||
| Other transport equipment | 30 | -0.00 | -0.02 | ||||
| Furniture | 31 | -0.02 | -0.02 | ||||
| Other Manufacturing | 32 | -0.01 | 0.04 | ||||
| Repair and Installation of machinery and equipment | 33 | 0.00 | -0.01 | ||||
| Mining and quarrying | 05-09 | 0.00 | 0.02 | ||||
| 1 Nace Rev. 2 Statistical classification of economic activities in the European Community. | |||||||
| 2 See Background Notes. | |||||||
| Table 3 Detailed Wholesale Price Indices (excluding VAT) for Building and Construction Materials | |||||||||
| Base: Year 2005 as 100 | |||||||||
| Materials | Index | Monthly % Change | Annual % Change | ||||||
| May 2013 | Jun 2013 | Apr 2013 | May 2013 | Jun 2013 | Jun 2013 | ||||
| Stone, sand and gravel | 141.5 | 147.1 | 0.5 | -0.1 | 4.0 | 7.6 | |||
| Stone | 139.5 | 145.4 | -0.6 | -0.8 | 4.2 | 7.3 | |||
| Sand and gravel | 196.0 | 200.1 | 7.7 | 4.4 | 2.1 | 9.6 | |||
| Cement | 128.6 | 128.6 | 0.6 | 0.0 | 0.0 | 0.0 | |||
| Ready mixed mortar and concrete | 110.2 | 110.5 | -0.4 | 0.4 | 0.3 | 1.3 | |||
| Concrete blocks and bricks | 120.4 | 121.2 | 0.5 | -1.3 | 0.7 | -0.6 | |||
| Other concrete products | 98.1 | 98.3 | 0.0 | 0.0 | 0.2 | -0.3 | |||
| Precast concrete | 96.9 | 97.4 | 0.0 | 0.0 | 0.5 | -1.2 | |||
| Other concrete products | |||||||||
| (Excluding precast concrete) | 97.7 | 97.7 | 0.0 | 0.0 | 0.0 | 0.1 | |||
| Structural steel and reinforcing metal | 117.4 | 117.1 | -0.2 | -0.2 | -0.3 | 0.5 | |||
| Structural steel | 118.2 | 117.9 | 0.2 | -0.1 | -0.3 | 2.1 | |||
| Fabricated metal | 115.1 | 114.8 | 0.3 | -0.2 | -0.3 | 2.8 | |||
| Other Structural steel | 92.2 | 92.2 | -0.2 | 0.0 | 0.0 | -3.8 | |||
| Reinforcing metal | 116.3 | 115.9 | -0.8 | -0.2 | -0.3 | -1.9 | |||
| Other steel products | 99.5 | 99.5 | -0.5 | 0.0 | 0.0 | 0.8 | |||
| Rough timber (including plain sawn) | 116.0 | 116.4 | 0.0 | 0.0 | 0.3 | 1.8 | |||
| Hardwood | 102.2 | 102.2 | 0.0 | 0.0 | 0.0 | -2.8 | |||
| Other | 117.8 | 118.2 | 0.0 | 0.0 | 0.3 | 2.3 | |||
| Other timber | 107.7 | 107.8 | 0.0 | 0.0 | 0.1 | 0.0 | |||
| Windows and doors | 114.4 | 114.6 | 0.0 | 0.0 | 0.2 | 0.0 | |||
| Other | 102.0 | 102.0 | 0.0 | 0.0 | 0.0 | 0.0 | |||
| Bituminous macadam, asphalt and | |||||||||
| bituminous emulsions | 182.5 | 180.8 | 0.4 | 0.2 | -0.9 | 5.0 | |||
| Bituminous macadam and asphalt | 182.9 | 181.1 | 0.4 | 0.3 | -1.0 | 5.5 | |||
| Bituminous emulsions | 173.8 | 174.0 | -0.7 | -1.5 | 0.1 | -5.2 | |||
| Electrical fittings | 122.8 | 122.8 | 1.4 | 0.0 | 0.0 | 1.6 | |||
| Lighting equipment | 132.3 | 132.3 | 0.0 | 0.0 | 0.0 | 0.2 | |||
| Protection & communication equipment | 112.3 | 112.3 | 0.0 | 0.0 | 0.0 | 0.2 | |||
| All other materials | 136.4 | 136.3 | -0.1 | 0.2 | -0.1 | 1.1 | |||
| Plumbing materials incl. sanitary ware | 113.9 | 113.9 | 0.0 | 0.0 | 0.0 | -1.0 | |||
| HVAC (heating & ventilation equipment) | 113.4 | 113.4 | 0.0 | -1.4 | 0.0 | -3.2 | |||
| Insulating materials | 144.4 | 144.4 | 0.0 | 3.3 | 0.0 | 4.6 | |||
| Pipes and fittings | 192.3 | 192.3 | 0.3 | -0.4 | 0.0 | 1.6 | |||
| PVC | 110.3 | 110.3 | 0.1 | 0.0 | 0.0 | 9.9 | |||
| Copper | 363.6 | 363.6 | 0.3 | -0.5 | 0.0 | -0.7 | |||
| Plaster | 123.9 | 123.9 | 0.3 | 0.3 | 0.0 | 1.8 | |||
| Paints, oils and varnishes | 99.8 | 99.8 | 0.0 | 0.0 | 0.0 | -5.8 | |||
| Glass | 135.7 | 135.7 | 0.0 | 0.0 | 0.0 | 5.7 | |||
| All other metal fittings | 116.8 | 116.8 | 0.0 | 0.0 | 0.0 | 0.2 | |||
| All other products | 129.9 | 129.5 | -0.7 | 0.3 | -0.3 | 1.3 | |||
| All materials | 124.1 | 124.5 | 0.2 | 0.0 | 0.3 | 1.5 | |||
| Table 4 Capital Goods Price Indices (excluding VAT) | ||||||||||
| Base: Year 2005 as 100 | ||||||||||
| Capital goods | Index | Monthly % Change | Annual % Change | |||||||
| May 2013 | Jun 2013 | Apr 2013 | May 2013 | Jun 2013 | Jun 2013 | |||||
| Transportable capital for use in | ||||||||||
| Agriculture | 115.3 | 115.3 | 0.1 | 0.0 | 0.0 | 2.6 | ||||
| Industry | 99.6 | 99.6 | -0.2 | 0.3 | 0.0 | 1.6 | ||||
| of which: | ||||||||||
| Private vehicles1 | 105.0 | 105.0 | 0.0 | 0.0 | 0.0 | 0.5 | ||||
| Commercial vehicles | 99.3 | 99.3 | 0.0 | 0.6 | 0.0 | -0.1 | ||||
| Agriculture and industry | 102.0 | 102.0 | -0.2 | 0.3 | 0.0 | 1.8 | ||||
| Other sectors | 101.5 | 101.5 | 0.0 | 0.2 | 0.0 | 1.6 | ||||
| Total transportable capital | 101.8 | 101.8 | -0.1 | 0.3 | 0.0 | 1.7 | ||||
| Building and construction | 113.0 | 113.2 | 0.0 | 0.0 | 0.2 | 0.6 | ||||
| (i.e. materials and wages) | ||||||||||
| All capital goods | 111.4 | 111.5 | 0.0 | 0.1 | 0.1 | 0.7 | ||||
| 1 Private vehicles are inclusive of VAT which is non-deductible for industry and agriculture. | ||||||||||
| Table 5 Wholesale Price Indices (excluding VAT) for Energy Products | ||||||||||
| (i.e. Fuels purchased by Manufacturing Industry) | ||||||||||
| Base: Year 2005 as 100 | ||||||||||
| Energy fuels | Index | Monthly % Change | Annual % Change | |||||||
| May 2013 | Jun 2013 | Apr 2013 | May 2013 | Jun 2013 | Jun 2013 | |||||
| Petrol | 148.2 | 148.1 | -1.1 | 0.1 | -0.1 | 0.1 | ||||
| Autodiesel | 139.9 | 139.8 | -2.0 | -0.2 | -0.1 | 0.1 | ||||
| Gas oil (other than autodiesel) | 146.0 | 145.7 | -2.3 | -0.1 | -0.2 | 0.8 | ||||
| Fuel oil | 175.8 | 175.5 | -2.1 | 0.3 | -0.2 | -1.4 | ||||
| Petroleum fuels | 161.2 | 160.9 | -2.1 | 0.1 | -0.2 | -0.8 | ||||
| Energy products1 | 129.6 | 129.5 | -0.8 | 0.1 | -0.1 | -0.3 | ||||
| 1 Energy products including an estimated subindex for electricity. | ||||||||||
Wholesale Price Index
The term Industrial Producer Price Index refers to a family of indices that measure the average change over time in the selling prices received by domestic producers of goods and services. The other three wholesale price index series incorporate imported and home produced goods sold by manufacturers and wholesale outlets.
Coverage
The output price indices for sectors of Manufacturing Industries cover both home sales and export sales. The Indices for Total transportable goods industries; Food, drink and tobacco; Manufacturing industries excluding food; Manufacturing industries excluding food, drink and tobacco; Intermediate goods industries (except energy); Capital goods industries; Durable consumer goods industries; Non-durable consumer goods industries; Manufacturing industries (home sales); Manufacturing industries (export sales) and Total manufacturing industries are all calculated on a net sector basis, i.e. the weights used to combine the sectoral indices (including those for sectors not distinguished in Table 2) exclude sales to other sectors of Manufacturing Industry.
Table 2A gives the percentage contribution of each sector (including those not published on Table 2) to the overall percentage change on Table 2. The percentage contributions on Table 2A may not add up to the Total Manufacturing industries percentage change on Table 2 due to rounding and other adjustments for presentational purposes. In comparing these contributions against these percentage changes in indices presented on Table 2 caution should be exercised as the former is calculated on a net sector basis.
The Building Materials, Capital Goods and Energy Products indices (Tables 3, 4 and 5) cover home production and imports of these commodities. Table 3, the Wholesale Price Index for Building and Construction Materials, provides only a general indication of price trends in that sector. Actual transaction prices are collected for materials purchased by construction and civil engineering firms. The price indices reflect an ‘average’ over a mixture of products from many companies throughout the country. They also reflect prices for both long-term and short-term contracts and for high and low volume civil engineering works. It should be noted that long-term, high volume fixed contracts for major works might dilute in the short-term the impact of emerging price changes on the index. Furthermore, industry sources have confirmed that price increases notified by companies may not always be achieved in practice following negotiations. Much depends on the prevailing market conditions. Therefore changes over the short-term in the indices derived from these transaction prices will not always coincide with price changes notified by companies.
Prices
All indices in the series are based on prices at the 15th of the month. Quarterly and annual indices are simple averages of the corresponding monthly indices.
Prices used in the compilation of the indices are:
Every effort is made by the Wholesale Prices Section to collect all prices for the relevant month. Where this is not possible late prices are included in the following month’s calculations.
Methodology
This Wholesale Price Index series is compiled to base 2005 as 100. A methodological description of this updated series is given in the Wholesale Price Index Introduction of Updated Series base 2005 as 100.
Calculating percentage changes in the index
The movement of the output price indices is expressed as percentage change, rather than a change in index points, because index point changes are affected by the level of the index in relation to its base period, whereas percentage changes are not.
The example below illustrates the computation of a percentage change:
| Percentage change calculation | |
| Current index | 105.6 |
| Less previous index | 102.1 |
| Equals in index points | 3.5 |
| Divided by the previous index | 102.1 |
| Equals | 0.0343 |
| Results multiplied by 100 | 0.0343 x 100 |
| Equals percentage change | 3.4 |
Alternatively, users may calculate a percentage change by dividing the current index by the previous index, multiplying by 100 and then subtracting 100.
 Hide Background Notes
Scan the QR code below to view this release online or go to
http://www.cso.ie/en/releasesandpublications/er/wpi/wholesalepriceindexjune2013/
 Hide Table 1 Manufacturing Industries Output Price Indices (excluding VAT) Rebased Series 2005 = 100