
| Total Roundwood Purchases 2015-2019 | ||
| Year | '000 tonnes | '000 cubic metres |
| 2015 | 2,159 | 2,424 |
| 2016 | 2,227 | 2,497 |
| 2017 | 2,299 | 2,582 |
| 2018 | 2,376 | 2,672 |
| 2019 | 2,495 | 2,829 |
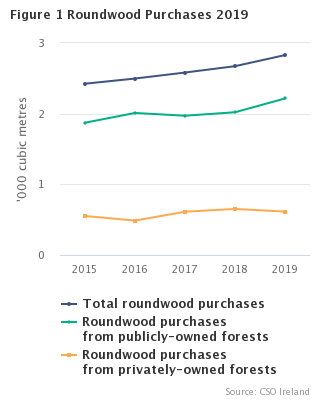
In 2019 the volume of roundwood input purchases by industry was at 2.8 million cubic metres (see Headline Table and Table 1A). This is an increase of 5.9% compared with 2018 purchases of 2.7 million cubic metres.
Roundwood purchases from publicly-owned forests made up 78.3% (2.2 million cubic metres) of 2019 purchases with the remainder from privately-owned forests (see Figure 1, Tables 1D and 1E).
Large sawlog accounted for the highest proportion of roundwood purchase volume at approximately 35% in 2019, followed by pulpwood (32%) and small sawlog (25%) (see Figure 2 and Table 3A). Approximately 6% of roundwood purchases were for use as biomass.
In 2019, purchases of non-roundwood products such as brash and tree stumps, woodchip and sawdust totalled 423 thousand tonnes (see Tables 1F and 2F).
Note: These results are based on a new CSO survey. Results for 2020 are due to be published during December 2021. The CSO would like to thank all survey respondents. A link to the survey questionnaire is available in the Background Notes.
| volume | |
| Large sawlog | 981 |
| Small sawlog | 721 |
| Stakewood | 48 |
| Pulpwood | 903 |
| Roundwood for use as biomass | 176 |
| Table 1A Total Roundwood Purchases 2019 | ||
| Year | '000 tonnes | '000 cubic metres |
| 2015 | 2,159 | 2,424 |
| 2016 | 2,227 | 2,497 |
| 2017 | 2,299 | 2,582 |
| 2018 | 2,376 | 2,672 |
| 2019 | 2,495 | 2,829 |
| Table 1B Coniferous Roundwood Purchases 2019 | ||
| Year | '000 tonnes | '000 cubic metres |
| 2015 | 2,159 | 2,423 |
| 2016 | 2,227 | 2,497 |
| 2017 | 2,299 | 2,582 |
| 2018 | 2,376 | 2,672 |
| 2019 | 2,495 | 2,828 |
| Table 1C Non-coniferous Roundwood Purchases 2019 | ||
| Year | '000 tonnes | '000 cubic metres |
| 2015 | 0 | 0 |
| 2016 | 0 | 0 |
| 2017 | 0 | 0 |
| 2018 | 0 | 0 |
| 2019 | 0 | 0 |
| 0 indicates a low value rounded to zero | ||
| Table 1D Roundwood Purchases From Publicly-owned Forests 2019 | ||
| Year | '000 tonnes | '000 cubic metres |
| 2015 | 1,668 | 1,872 |
| 2016 | 1,794 | 2,010 |
| 2017 | 1,756 | 1,971 |
| 2018 | 1,798 | 2,020 |
| 2019 | 1,949 | 2,215 |
| Table 1E Roundwood Purchases From Privately-owned Forests 2019 | ||
| Year | '000 tonnes | '000 cubic metres |
| 2015 | 491 | 552 |
| 2016 | 433 | 487 |
| 2017 | 543 | 612 |
| 2018 | 578 | 652 |
| 2019 | 546 | 614 |
| Table 1F Non-roundwood Purchases 2019 | |
| Year | '000 tonnes |
| 2015 | 290 |
| 2016 | 358 |
| 2017 | 399 |
| 2018 | 407 |
| 2019 | 423 |
| Table 2A Total Roundwood and Non-roundwood Purchases by Product 2019 ('000 tonnes) | |||||
| '000 tonnes | |||||
| Product | 2015 | 2016 | 2017 | 2018 | 2019 |
| Large sawlog | 679 | 735 | 768 | 851 | 851 |
| Small sawlog | 591 | 600 | 619 | 630 | 640 |
| Stakewood | 38 | 39 | 41 | 40 | 43 |
| Pulpwood | 711 | 676 | 706 | 724 | 804 |
| Roundwood for use as biomass | 140 | 177 | 165 | 131 | 157 |
| Brash and tree stumps | 23 | 27 | 23 | 6 | 7 |
| Woodchip | 192 | 220 | 237 | 268 | 284 |
| Sawdust | 66 | 81 | 102 | 96 | 97 |
| Short-rotation coppice | 2 | 16 | 19 | 17 | 13 |
| Post-consumer recovered wood | 8 | 14 | 18 | 21 | 21 |
| Total | 2,450 | 2,586 | 2,698 | 2,784 | 2,918 |
| Table 2B Coniferous Roundwood Purchases by Product 2019 ('000 tonnes) | |||||
| '000 tonnes | |||||
| Product | 2015 | 2016 | 2017 | 2018 | 2019 |
| Large sawlog | 679 | 735 | 768 | 851 | 851 |
| Small sawlog | 591 | 600 | 619 | 630 | 640 |
| Stakewood | 38 | 39 | 41 | 40 | 43 |
| Pulpwood | 711 | 676 | 706 | 724 | 804 |
| Roundwood for use as biomass | 140 | 177 | 165 | 131 | 157 |
| Total | 2,159 | 2,227 | 2,299 | 2,376 | 2,495 |
| Table 2C Non-coniferous Roundwood Purchases by Product 2019 ('000 tonnes) | |||||
| '000 tonnes | |||||
| Product | 2015 | 2016 | 2017 | 2018 | 2019 |
| Large sawlog | – | – | – | – | 0 |
| Small sawlog | – | – | – | – | 0 |
| Stakewood | – | – | – | – | 0 |
| Pulpwood | 0 | 0 | 0 | 0 | 0 |
| Roundwood for use as biomass | – | – | – | – | 0 |
| Total | 0 | 0 | 0 | 0 | 0 |
| 0 indicates a low value rounded to zero | |||||
| – indicates absolute zero value | |||||
| Table 2D Roundwood Purchases from Publicly-owned Forests by Product 2019 ('000 tonnes) | |||||
| '000 tonnes | |||||
| Product | 2015 | 2016 | 2017 | 2018 | 2019 |
| Large sawlog | 533 | 614 | 595 | 623 | 689 |
| Small sawlog | 389 | 413 | 416 | 406 | 429 |
| Stakewood | 23 | 23 | 24 | 23 | 24 |
| Pulpwood | 645 | 644 | 662 | 704 | 732 |
| Roundwood for use as biomass | 79 | 99 | 59 | 42 | 75 |
| Total | 1,668 | 1,794 | 1,756 | 1,798 | 1,949 |
| Table 2E Roundwood Purchases from Privately-owned Forests by Product 2019 ('000 tonnes) | |||||
| '000 tonnes | |||||
| Product | 2015 | 2016 | 2017 | 2018 | 2019 |
| Large sawlog | 146 | 121 | 174 | 229 | 162 |
| Small sawlog | 202 | 186 | 203 | 224 | 211 |
| Stakewood | 16 | 16 | 17 | 16 | 19 |
| Pulpwood | 66 | 32 | 44 | 20 | 73 |
| Roundwood for use as biomass | 61 | 78 | 106 | 90 | 82 |
| Total | 491 | 433 | 543 | 578 | 546 |
| Table 2F Non-roundwood Purchases by Product 2019 ('000 tonnes) | |||||
| '000 tonnes | |||||
| Product | 2015 | 2016 | 2017 | 2018 | 2019 |
| Brash and tree stumps | 23 | 27 | 23 | 6 | 7 |
| Woodchip | 192 | 220 | 237 | 268 | 284 |
| Sawdust | 66 | 81 | 102 | 96 | 97 |
| Short-rotation coppice | 2 | 16 | 19 | 17 | 13 |
| Post-consumer recovered wood | 8 | 14 | 18 | 21 | 21 |
| Total | 290 | 358 | 399 | 407 | 423 |
| Table 3A Total Roundwood Purchases by Product 2019 ('000 cubic metres) | |||||
| '000 cubic metres | |||||
| Product | 2015 | 2016 | 2017 | 2018 | 2019 |
| Large sawlog | 777 | 841 | 879 | 973 | 981 |
| Small sawlog | 661 | 670 | 692 | 704 | 721 |
| Stakewood | 43 | 44 | 46 | 45 | 48 |
| Pulpwood | 785 | 742 | 780 | 803 | 903 |
| Roundwood for use as biomass | 158 | 200 | 186 | 147 | 176 |
| Total | 2,424 | 2,497 | 2,582 | 2,672 | 2,829 |
| Table 3B Roundwood Coniferous Purchases by Product 2019 ('000 cubic metres) | |||||
| '000 cubic metres | |||||
| Product | 2015 | 2016 | 2017 | 2018 | 2019 |
| Large sawlog | 777 | 841 | 879 | 973 | 981 |
| Small sawlog | 661 | 670 | 692 | 704 | 720 |
| Stakewood | 43 | 44 | 46 | 45 | 48 |
| Pulpwood | 785 | 742 | 780 | 803 | 903 |
| Roundwood for use as biomass | 158 | 200 | 186 | 147 | 176 |
| Total | 2,423 | 2,497 | 2,582 | 2,672 | 2,828 |
| Table 3C Roundwood Non-coniferous Purchases by Product 2019 ('000 cubic metres) | |||||
| '000 cubic metres | |||||
| Product | 2015 | 2016 | 2017 | 2018 | 2019 |
| Large sawlog | – | – | – | – | 0 |
| Small sawlog | – | – | – | – | 0 |
| Stakewood | – | – | – | – | 0 |
| Pulpwood | 0 | 0 | 0 | 0 | 0 |
| Roundwood for use as biomass | – | – | – | – | 0 |
| Total | 0 | 0 | 0 | 0 | 0 |
| 0 indicates a low value rounded to zero | |||||
| – indicates absolute zero value | |||||
| Table 3D Roundwood Purchases from Publicly-owned Forests by Product 2019 ('000 cubic metres) | |||||
| '000 cubic metres | |||||
| Product | 2015 | 2016 | 2017 | 2018 | 2019 |
| Large sawlog | 610 | 702 | 680 | 713 | 798 |
| Small sawlog | 435 | 463 | 466 | 454 | 486 |
| Stakewood | 26 | 26 | 27 | 26 | 27 |
| Pulpwood | 713 | 708 | 731 | 781 | 821 |
| Roundwood for use as biomass | 88 | 112 | 66 | 46 | 83 |
| Total | 1,872 | 2,010 | 1,971 | 2,020 | 2,215 |
| Table 3E Roundwood Purchases from Privately-owned Forests by Product 2019 ('000 cubic metres) | |||||
| '000 cubic metres | |||||
| Product | 2015 | 2016 | 2017 | 2018 | 2019 |
| Large sawlog | 167 | 139 | 198 | 260 | 183 |
| Small sawlog | 225 | 208 | 226 | 250 | 235 |
| Stakewood | 18 | 18 | 19 | 18 | 21 |
| Pulpwood | 72 | 34 | 49 | 22 | 82 |
| Roundwood for use as biomass | 69 | 88 | 120 | 101 | 93 |
| Total | 552 | 487 | 612 | 652 | 614 |
The 2019 Wood Input Purchases by Industry release is based on data collected from the 2019 Wood Inputs Survey conducted by the CSO. The survey was designed to capture information on purchases of roundwood and non-roundwood forest products from forests in Ireland. The 2020 survey commenced in August 2021.
The Wood Inputs Survey is a statutory survey conducted under the Statistics (Wood Inputs Survey) Order 2020 (S.I. No. 650 of 2020) made under the Statistics Act, 1993.
The survey was designed to collect data on purchases of roundwood and non-roundwood forest products used in the manufacturing process and for energy from publicly-owned and privately-owned forests in Ireland. The CSO Business Register was used to select the sample. Information from the Forest Service and from industry experts was used to ensure that all relevant enterprises were selected.
The survey does not make use of any administrative data.
The questionnaire is available at: Wood Inputs Survey
Quantity: The survey requested quantity of roundwood in tonnes overbark. It includes all purchases during the calendar year. All weights were reported at actual moisture content at the time of sale. Respondents were asked to provide both tonnes and cubic metres if both were available.
Large sawlog: Roundwood with a top diameter of 20 cm or more and a typical length of between 3.7 and 7.3 metres. They are used for the manufacture of sawn timber largely for use by the construction industry.
Small sawlog (palletwood): Roundwood with a top diameter of 14-19 cm and a typical length of between 2.0 and 3.6 metres are classified as small sawlog (palletwood). It is suitable for use as packaging and for making garden furniture.
Stakewood: Roundwood with a top diameter of 7-13 cm and a typical length of between 1.5 and 1.9 metres are classified as stakewood if it is used for stakes and fencing.
Pulpwood: Roundwood with a top diameter of 7-13 cm and a length of around 3 metres. Pulpwood is used to produce pulp, door panels, particle board, oriented strand board (OSB), medium-density fibreboard (MDF), and other fibreboard.
Roundwood purchased for use as biomass: Roundwood purchased to be used for energy purposes are included here. Bark, woodchip, and sawdust that were purchased as separate products are not included here but included in the non-roundwood product categories.
Brash and tree stumps: Brash (lop and top) and tree stumps.
Woodchip: Woodchip removed from the log prior to sale. Woodchip purchased as a separate product and used in the production of energy are included in this category.
Sawdust: This category covers sawdust purchased as an input into the manufacturing process and for energy purposes.
Short rotation coppice: SRC is wood grown for energy purposes e.g. willow.
Post-consumer recovered wood: PCRW includes all kinds of wood material which is made available for reuse or recycling. It may be recovered from packaging materials, demolition projects, building sites, etc. It may be used for material purposes or for energy production.
The survey statutory instrument obliged enterprises in the sample to provide a return in respect of 2019. The CSO asked enterprises that submitted 2019 data to provide us with 2015 to 2018 figures on a voluntary basis. The CSO used the 2019 returns to estimate 2015 to 2018 for enterprises that did not provide those years on a voluntary basis.
Enterprises were asked to provide figures in tonnes and cubic metres. Most enterprises provided tonnes and the larger enterprises provided cubic metres. The CSO estimated any missing data using completed data. The CSO allowed a range from 1.03 to 1.24 cubic metres per tonne. Returns below or above these ratios were corrected to the lower or upper limit.
The returns were not weighted. The CSO made estimates for active enterprises that did not submit a return.
All data are subject to revision. The revisions will mainly arise from replacing CSO estimates with actual data or from enterprises that are not included in these results subsequently providing figures.
 Hide Background Notes
Scan the QR code below to view this release online or go to
http://www.cso.ie/en/releasesandpublications/er/wipi/woodinputpurchasesbyindustry2019/
 Show Table 1A: Total Roundwood Purchases 2019
 Hide Table 1A: Total Roundwood Purchases 2019