
This release has been compiled during the COVID-19 crisis. The results contained in this release reflect some of the economic impacts of the COVID-19 situation. For further information see Press Statement Vehicles licensed for the first time January 2022.
| January | |||||
| 2021 | 2022 | Change | |||
| New private cars | 16,948 | 15,814 | -1,134 | -6.7% | |
| New goods vehicles | 1,529 | 1,728 | 199 | 13.0% | |
| New other vehicles | 1,041 | 1,164 | 123 | 11.8% | |
| Total new vehicles | 19,518 | 18,706 | -812 | -4.2% | |
| Used private cars | 8,126 | 3,686 | -4,440 | -54.6% | |
| Used goods vehicles | 960 | 640 | -320 | -33.3% | |
| Used other vehicles | 1,204 | 747 | -457 | -38.0% | |
| Total used vehicles | 10,290 | 5,073 | -5,217 | -50.7% | |
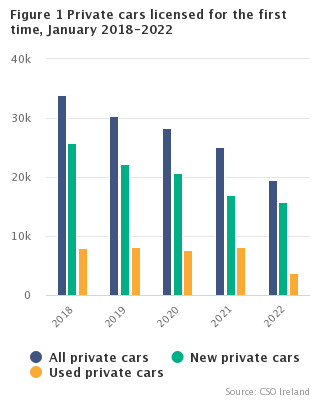
In January 2022, 15,814 new private cars were licensed, a drop of 6.7% compared with January 2021.
The number of used (imported) private cars licensed in January 2022 was 3,686, a decrease of 54.6% when compared with January 2021.
Electric and plug-in hybrid cars continue to grow in popularity. In January 2022, 21.0% of all new cars licensed for the first time were electric or plug-in hybrid electric vehicles (PHEV). Looking exclusively at electric-only cars, the share of new electric cars licensed increased from 4.4% in January 2021 to 11.5% in January 2022. See table 6.
The licensing figures also show that:
|
Registration and licensing figures may differ in a given month for a number of reasons, some of which are outlined below:
Seasonally adjusting the Vehicle Licensing series during the COVID-19 crisis period will be challenging until the scale and shape of its impact on the time series is better understood. The initial seasonally adjusted results might be revised for some months ahead as future observations become available. Users should be aware that there is increased uncertainty around the seasonally adjusted figures during this period. |
| Most popular makes of new cars, January 2022 | |
| Toyota | 22.5 |
| Hyundai | 12.9 |
| Nissan | 7 |
| Kia | 7 |
| Volkswagen | 6.9 |
| Other | 43.7 |
| Most popular makes of new cars, January 2022 | |
| Toyota | 16.7 |
| Hyundai | 11.2 |
| Nissan | 5.9 |
| Kia | 7 |
| Volkswagen | 7.7 |
| Other | 51.5 |
| Table 1: Number of vehicles licensed for the first time classified by taxation class | |||
| Taxation Class | January | ||
| 2020 | 2021 | 2022 | |
| New vehicles | |||
| New Private Cars | 20,665 | 16,948 | 15,814 |
| New Goods Vehicles | 2,544 | 1,529 | 1,728 |
| New Tractors | 247 | 258 | 252 |
| New Motor Cycles | 163 | 136 | 274 |
| New Exempt Vehicles | 751 | 575 | 518 |
| New Other | 175 | 72 | 120 |
| Total New Vehicles | 24,545 | 19,518 | 18,706 |
| Used (imported) vehicles | |||
| Used private cars | 7,683 | 8,126 | 3,686 |
| Used goods vehicles | 1,302 | 960 | 640 |
| Used tractors | 225 | 367 | 193 |
| Used motorcycles | 283 | 301 | 192 |
| Used other vehicles | 539 | 536 | 362 |
| Total used vehicles | 10,032 | 10,290 | 5,073 |
| Total all vehicles | 34,577 | 29,808 | 23,779 |
| Table 2: Number of new private cars licensed for the first time by CO2 emission band and fuel type, January 2022 | ||||||||
| Band | Fuel Type | Total | ||||||
| Petrol | Diesel | Electric | Petrol & electric hybrid | Diesel & electric hybrid | Petrol or Diesel plug-in electric hybrid | Other | ||
| A | 956 | 468 | 1,813 | 3,052 | 19 | 1,441 | 171 | 7,920 |
| B | 2,579 | 1,870 | 0 | 1,549 | 26 | 38 | 15 | 6,077 |
| C | 737 | 536 | 0 | 23 | 147 | 28 | 0 | 1,471 |
| D | 47 | 125 | 0 | 15 | 2 | 0 | 0 | 189 |
| E | 7 | 36 | 0 | 10 | 4 | 0 | 0 | 57 |
| F | 6 | 18 | 0 | 1 | 0 | 0 | 0 | 25 |
| G | 9 | 10 | 0 | 1 | 0 | 0 | 0 | 20 |
| Not available | 1 | 53 | 0 | 0 | 1 | 0 | 0 | 55 |
| Total | 4,342 | 3,116 | 1,813 | 4,651 | 199 | 1,507 | 186 | 15,814 |
| Table 3: Number of new and used (imported) private cars licensed for the first time by make, January 2022 | |||
| Make | January | ||
| New | Used (imported) | Total | |
| Audi | 472 | 315 | 787 |
| BMW | 633 | 320 | 953 |
| Citroen | 242 | 49 | 291 |
| Dacia | 421 | 8 | 429 |
| Fiat | 12 | 55 | 67 |
| Ford | 911 | 278 | 1,189 |
| Honda | 84 | 196 | 280 |
| Hyundai | 2,041 | 128 | 2,169 |
| Jaguar | 18 | 27 | 45 |
| Kia | 1,108 | 73 | 1,181 |
| Land Rover | 94 | 40 | 134 |
| Lexus | 100 | 43 | 143 |
| Mazda | 167 | 45 | 212 |
| Mercedes Benz | 448 | 188 | 636 |
| Mini | 85 | 31 | 116 |
| Mitsubishi | 0 | 30 | 30 |
| Nissan | 1,109 | 286 | 1,395 |
| Opel | 364 | 2 | 366 |
| Peugeot | 560 | 79 | 639 |
| Renault | 338 | 67 | 405 |
| Seat | 275 | 65 | 340 |
| Skoda | 1,003 | 88 | 1,091 |
| Ssangyong | 3 | 0 | 3 |
| Subaru | 1 | 6 | 7 |
| Suzuki | 142 | 48 | 190 |
| Tesla | 31 | 4 | 35 |
| Toyota | 3,559 | 344 | 3,903 |
| Vauxhall | 0 | 143 | 143 |
| Volkswagen | 1,089 | 626 | 1,715 |
| Volvo | 282 | 71 | 353 |
| Other | 222 | 31 | 253 |
| Total | 15,814 | 3,686 | 19,500 |
| The information in this table is available in much greater detail in Databases (see PxStat link below) | |||
| X-axis label | Unadjusted data | Adjusted data | Trend |
|---|---|---|---|
| January 2017 | 26668 | 11126 | 10841 |
| February 2017 | 16905 | 10750 | 10784 |
| March 2017 | 17180 | 10936 | 10755 |
| April 2017 | 13427 | 10756 | 10717 |
| May 2017 | 9581 | 10419 | 10639 |
| June 2017 | 3585 | 9099 | 10498 |
| July 2017 | 21316 | 10880 | 10283 |
| August 2017 | 8105 | 9863 | 10018 |
| September 2017 | 4828 | 9963 | 9760 |
| October 2017 | 3255 | 9368 | 9606 |
| November 2017 | 1594 | 9260 | 9592 |
| December 2017 | 601 | 9266 | 9722 |
| January 2018 | 25813 | 10374 | 9926 |
| February 2018 | 16501 | 10699 | 10106 |
| March 2018 | 16088 | 10255 | 10172 |
| April 2018 | 11557 | 9786 | 10110 |
| May 2018 | 9362 | 10117 | 9937 |
| June 2018 | 3716 | 9425 | 9724 |
| July 2018 | 20743 | 9834 | 9513 |
| August 2018 | 7681 | 9187 | 9322 |
| September 2018 | 4397 | 9223 | 9132 |
| October 2018 | 2874 | 7751 | 8980 |
| November 2018 | 1647 | 8934 | 8942 |
| December 2018 | 778 | 11118 | 9065 |
| January 2019 | 22279 | 9227 | 9328 |
| February 2019 | 14178 | 9367 | 9631 |
| March 2019 | 14404 | 10326 | 9848 |
| April 2019 | 13794 | 10778 | 9880 |
| May 2019 | 9126 | 9806 | 9679 |
| June 2019 | 3858 | 9279 | 9293 |
| July 2019 | 18741 | 8396 | 8854 |
| August 2019 | 7202 | 8768 | 8511 |
| September 2019 | 4104 | 7922 | 8358 |
| October 2019 | 3214 | 8301 | 8391 |
| November 2019 | 1676 | 8619 | 8523 |
| December 2019 | 729 | 8929 | 8685 |
| January 2020 | 20665 | 8945 | 8829 |
| February 2020 | 13263 | 8959 | 8954 |
| March 2020 | 10239 | 6999 | 7260 |
| April 2020 | 1338 | 1092 | 1098 |
| May 2020 | 1490 | 1714 | 2689 |
| June 2020 | 2189 | 4493 | 4488 |
| July 2020 | 15329 | 6865 | 6656 |
| August 2020 | 7360 | 8836 | 8790 |
| September 2020 | 5747 | 9849 | 10370 |
| October 2020 | 4189 | 10860 | 10948 |
| November 2020 | 1468 | 6899 | 10934 |
| December 2020 | 1032 | 11388 | 10887 |
| January 2021 | 16948 | 8249 | 8156 |
| February 2021 | 11672 | 7968 | 8133 |
| March 2021 | 10672 | 6892 | 8177 |
| April 2021 | 8214 | 7154 | 8351 |
| May 2021 | 7337 | 8514 | 8676 |
| June 2021 | 4980 | 9405 | 9093 |
| July 2021 | 20232 | 9474 | 9506 |
| August 2021 | 8563 | 9587 | 9790 |
| September 2021 | 6354 | 10289 | 9865 |
| October 2021 | 3882 | 9798 | 9704 |
| November 2021 | 2167 | 9465 | |
| December 2021 | 832 | 8939 | |
| January 2022 | 15814 | 8031 |
| Table 4: Seasonally adjusted number of vehicles licensed for the first time classified by taxation class | ||||
| Taxation class | January 2021 | December 2021 | January 2022 | Monthly % change |
| New vehicles | ||||
| New private cars | 8,249 | 8,939 | 8,031 | -10.2 |
| New goods vehicles | 1,220 | 2,565 | 1,416 | -44.8 |
| New tractors | 190 | 225 | 195 | -13.3 |
| New motor cycles | 123 | 197 | 241 | 22.3 |
| New exempt vehicles | 419 | 320 | 400 | 25.0 |
| New other | 76 | 149 | 122 | -18.1 |
| Total new vehicles | 10,277 | 12,395 | 10,405 | -16.1 |
| Used (imported) vehicles | ||||
| Used private cars | 8,987 | 4,176 | 4,074 | -2.4 |
| Used goods vehicles | 1,036 | 623 | 698 | 12.0 |
| Used tractors | 361 | 228 | 190 | -16.7 |
| Used motorcycles | 390 | 256 | 257 | 0.4 |
| Used other vehicles | 629 | 413 | 424 | 2.7 |
| Total used vehicles | 11,403 | 5,696 | 5,643 | -0.9 |
| Total all vehicles | 21,680 | 18,091 | 16,048 | -11.3 |
| X-axis label | 2018 | 2019 | 2020 | 2021 | 2022 to date |
|---|---|---|---|---|---|
| <1 year old | 1.9 | 1.7 | 1.6 | 1.1 | 0.1 |
| 1-2 years old | 18.3 | 17.6 | 17.7 | 11.4 | 6 |
| 3-5 years old | 50.8 | 50.3 | 56.3 | 56 | 36.5 |
| 6-9 years old | 24.4 | 25.6 | 19.8 | 24.9 | 42.8 |
| Over 10 years old | 4.6 | 4.8 | 4.7 | 6.6 | 14.7 |
Footnote: For the purpose of the analysis of the age profile of used (imported) private cars, calendar years were used to band the age groups. For example, a private car defined as less than one year old is an imported vehicle which has previously been registered abroad for the first time in the current calendar year.
| Table 5: Number of new and used (imported) private cars licensed for the first time | |||||
| Private cars | 2018 | 2019 | 2020 | 2021 | Jan 2022 |
| New | 121,157 | 113,305 | 84,309 | 101,853 | 15,814 |
| Used (imported) | 99,456 | 108,895 | 78,541 | 68,042 | 3,686 |
| Total | 220,613 | 222,200 | 162,850 | 169,895 | 19,500 |
| % used (imported) | 45.1% | 49.0% | 48.2% | 40.0% | 18.9% |
| Table 6: Number of new and used (imported) private cars licensed for the first time by fuel type | |||||
| Fuel type | New | Used (imported) | |||
| January | January | ||||
| 2021 | 2022 | 2021 | 2022 | ||
| Petrol | 5,557 | 4,342 | 2,160 | 1,499 | |
| Diesel | 5,801 | 3,116 | 4,905 | 1,584 | |
| Electric | 739 | 1,813 | 58 | 30 | |
| PHEV1 | 827 | 1,507 | 507 | 179 | |
| Hybrid | 4,015 | 4,850 | 496 | 394 | |
| Other | 9 | 186 | 0 | 0 | |
| Total | 16,948 | 15,814 | 8,126 | 3,686 | |
| 1 Plug-in hybrid electric vehicle | |||||
The vehicle licensing figures are compiled from data supplied by the Driver and Vehicle Computer Services Division of the Department of Transport. The data provide details on the number of private cars, goods vehicles, motor cycles and other vehicles licensed for the first time in each city and county council, classified by make and size, during a given month.
The release titled 'Vehicles Licensed for the First Time' commenced in January 1993. It replaced the series previously published as 'Particulars of Vehicles Registered and Licensed for the First Time'.
In January 1993, separate systems for vehicle registration and licensing were introduced. The Office of the Revenue Commissioners became responsible for the compilation of vehicle registrations while the Department of the Environment, Heritage and Local Government retained responsibility for vehicle licensing. In January 2008, responsibility for vehicle licensing was transferred to the Department of Transport.
Motor tax charges are determined on the basis of CO2 emission level (using seven CO2 bands) for all new cars registered from 1 July 2008.
The licensing process where applicable follows the registration process.
The CSO produces vehicle licensing statistics on a monthly basis. Vehicle registration data has not been published on the CSO PxStat since June 2010.
Registration and licensing figures may differ in a given month for a number of reasons, some of which are outlined below:
The question is often asked, which reflects better vehicle sales, licensing figures or registration figures?
In practice, on a monthly basis, the licensing data is probably a better reflection of sales. In some cases, a vehicle may be registered by a dealership in advance of a sale. Whereas, typically, vehicles are only licensed at the point of sale. However, if a vehicle is purchased towards the end of a month, the buyer may wish to defer collecting and licensing it until the start of the following month. So the issue is not clear-cut.
Seasonal adjustment for each taxation class is conducted using a direct seasonal adjustment approach. However, the overall vehicle totals are estimated using the indirect approach, i.e. the ‘Total new vehicles’ is derived by adding all the seasonally adjusted new vehicles taxation classes. The main reason for adopting the indirect approach is to attribute the monthly and annual changes in vehicle licensing to each of its taxation classes. Seasonal adjustment models are developed for each series based on unadjusted data spanning from July 1996 to the current period. These models are reviewed on an annual basis; however seasonal factors are updated each month.
The adjustments are completed by applying the X-13-ARIMA model, developed by the U.S. Census Bureau to the unadjusted data. This methodology estimates seasonal factors while also taking into consideration factors that impact on the quality of the seasonal adjustment such as:
• Calendar effects, e.g. the timing of Easter,
• Outliers, temporary changes and level shifts in the series.
For additional information on the use of X-13-ARIMA see https://www.census.gov/data/software/x13as.X-13ARIMA-SEATS.html
Definitions
Private cars: The term 'private cars' in this release, refers to privately licensed vehicles which include hire, fleet and certain commercial vehicles.
New and used vehicles: The term 'new vehicles' refers to new vehicles which are licensed for use in a public place, in this country, for the first time. 'Used vehicles' refers to used vehicles which are licensed for use in a public place, in this country, for the first time. In the main used vehicles are imported.
Exempt: The term 'exempt vehicles' in this release, refers to vehicles which are licensed for the first time but are exempt from liability to pay road tax.
Exempt vehicles can be divided into four main categories:
Electric hybrid: means a vehicle that derives its motive power from a combination of an electric motor and an internal combustion engine and is capable of being driven on electric propulsion alone for a material part of its normal driving cycle.
Plug-in electric hybrid: means a vehicle that derives its motive power from a combination of an electric motor and an internal combustion engine, where the electric motor derives its power from a battery that may be charged from the internal combustion engine and an alternating current (AC) electric mains supply and is capable of being driven on electric propulsion alone for a material part of its normal driving cycle.
 Hide Background Notes
Scan the QR code below to view this release online or go to
http://www.cso.ie/en/releasesandpublications/er/vlftm/vehicleslicensedforthefirsttimejanuary2022/
 Show Table 1 Number of vehicles licensed for the first time classified by taxation class
 Hide Table 1 Number of vehicles licensed for the first time classified by taxation class