
| New vehicles | 2010 | 2011 | 2012 | 2013 | 2014 | 2015 |
| New private cars | 84,907 | 86,932 | 76,256 | 71,348 | 92,361 | 121,110 |
| New goods vehicles | 10,510 | 11,188 | 10,855 | 11,024 | 16,254 | 22,939 |
| Total new vehicles | 103,076 | 105,761 | 95,093 | 92,887 | 117,652 | 153,850 |
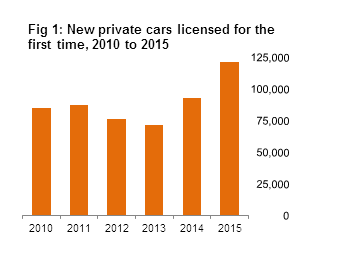
In 2015, 121,110 new private cars were licensed, an increase of 31.1% compared with the previous year. The number of used (imported) private cars licensed fell by 10.7% compared with 2014. See table 1.
Less than one percent (0.7%) of all new private cars licensed in 2015 were licensed in the month of December (847). A total of 3,164 used (imported) private cars were licensed in December, representing a fall of 1.9% on the same month in 2014.
Every county showed an increase in the number of new cars licensed in 2015, with 10 counties having over 3,000 new cars licensed in 2015. Almost half (47.6%) of all new private cars licensed in the country in 2015 were licensed in Dublin (35.8%) and Cork (11.9%). See figure 2.
The licensing figures also show that:
| Most popular makes of new cars, 2014 | |
| Volkswagen | 12.3 |
| Toyota | 10.5 |
| Ford | 9.8 |
| Nissan | 7.2 |
| Hyundai | 8 |
| Other | 52.2 |
| Most popular makes of new cars, 2015 | |
| Volkswagen | 12.4 |
| Toyota | 10.2 |
| Ford | 9.8 |
| Nissan | 9 |
| Hyundai | 8.9 |
| Other | 49.8 |
The most popular colour for new private cars licensed in 2015 was black (19.8%) followed closely by silver (19.6%), grey and white. The most popular colours in 2014 were silver and black (both 21.0%) followed by grey and white. See table 5.
| Table A: New private cars licensed for the first time by most popular make and colour, 2014 - 2015 | |||||
| Make | 2014 | 2015 | |||
| Colour | Percentage | Colour | Percentage | ||
| Volkswagen | Black | 25.8 | Silver | 25.3 | |
| Toyota | Silver | 24.9 | Silver | 20.5 | |
| Ford | Silver | 24.6 | Silver | 25.0 | |
| Nissan | Silver | 21.2 | Silver | 18.2 | |
| Hyundai | Silver | 20.5 | White | 19.4 | |
Special analysis - introduction of the dual registration system
In 2013, a dual vehicle registration system was introduced in Ireland. The new two-stage registration period was analysed to assess any potential impact on new private car licensing figures across each year, before and after the change.
| Table B: Percentage of new private cars licensed for the first time, 2010 to 2015 | ||||||||
| Year | Jan | Quarter 1 | Quarter 2 | Jan-Jun | Jul | Quarter 3 | Quarter 4 | Jul-Dec |
| 2010 | 12.3 | 40.7 | 31.6 | 72.3 | 8.3 | 20.0 | 7.7 | 27.7 |
| 2011 | 15.7 | 45.4 | 34.2 | 79.7 | 8.0 | 15.5 | 4.8 | 20.3 |
| 2012 | 19.0 | 47.3 | 30.0 | 77.3 | 8.1 | 16.6 | 6.1 | 22.7 |
| 2013 | 15.0 | 43.5 | 25.9 | 69.4 | 13.0 | 23.9 | 6.7 | 30.6 |
| 2014 | 17.3 | 42.6 | 24.8 | 67.4 | 15.2 | 26.6 | 5.9 | 32.6 |
| 2015 | 16.6 | 43.4 | 21.6 | 64.9 | 17.6 | 29.5 | 5.5 | 35.1 |
| Quarter 1 | Quarter 2 | Quarter 3 | Quarter 4 | |
| 2010 | 40.7 | 31.6 | 20 | 7.7 |
| 2011 | 45.4 | 34.2 | 15.5 | 4.8 |
| 2012 | 47.3 | 30 | 16.6 | 6.1 |
| 2013 | 43.5 | 25.9 | 23.9 | 6.7 |
| 2014 | 42.6 | 24.8 | 26.6 | 5.9 |
| 2015 | 43.4 | 21.6 | 29.5 | 5.5 |
| Licensing differs from registration in that a vehicle is licensed when a valid motor tax disc is issued for the first time. Registration occurs when a vehicle gets its licence plate (registration number) for the first time. |
| Table 1: Number of vehicles licensed for the first time classified by taxation class | |||||||
| Taxation Class | December | January - December | |||||
| 2013 | 2014 | 2015 | 2013 | 2014 | 2015 | ||
| New vehicles | |||||||
| New private cars | 639 | 920 | 847 | 71,348 | 92,361 | 121,110 | |
| New goods vehicles | 271 | 384 | 548 | 11,024 | 16,254 | 22,939 | |
| New tractors | 105 | 70 | 60 | 4,403 | 2,186 | 1,986 | |
| New motorcycles | 27 | 20 | 20 | 878 | 960 | 1,244 | |
| New exempt vehicles | 37 | 71 | 110 | 3,955 | 4,762 | 5,234 | |
| New other | 33 | 37 | 66 | 1,279 | 1,129 | 1,337 | |
| Total new vehicles | 1,112 | 1,502 | 1,651 | 92,887 | 117,652 | 153,850 | |
| Used (imported) vehicles | |||||||
| Used private cars | 3,181 | 3,224 | 3,164 | 49,762 | 52,863 | 47,217 | |
| Used goods vehicles | 689 | 756 | 596 | 7,533 | 9,074 | 8,352 | |
| Used tractors | 256 | 142 | 124 | 6,598 | 2,357 | 1,787 | |
| Used motorcycles | 72 | 85 | 67 | 1,687 | 1,655 | 1,586 | |
| Used other vehicles | 352 | 263 | 234 | 5,576 | 4,319 | 3,731 | |
| Total used vehicles | 4,550 | 4,470 | 4,185 | 71,156 | 70,268 | 62,673 | |
| Total all vehicles | 5,662 | 5,972 | 5,836 | 164,043 | 187,920 | 216,523 | |
| Table 2A: Number of new private cars licensed for the first time by CO2 emission band and fuel type, December 2015 | |||||||
| Band | Fuel Type | Total | |||||
| Petrol | Diesel | Petrol & electric | Petrol & ethanol | Electric | Other | ||
| A | 140 | 492 | 5 | 0 | 3 | 2 | 642 |
| B | 65 | 94 | 3 | 0 | 0 | 0 | 162 |
| C | 2 | 16 | 0 | 0 | 0 | 0 | 18 |
| D | 0 | 10 | 0 | 0 | 0 | 0 | 10 |
| E | 2 | 6 | 0 | 0 | 0 | 0 | 8 |
| F | 0 | 3 | 0 | 0 | 0 | 0 | 3 |
| G | 1 | 2 | 0 | 0 | 0 | 0 | 3 |
| Not available1 | 0 | 1 | 0 | 0 | 0 | 0 | 1 |
| Total | 210 | 624 | 8 | 0 | 3 | 2 | 847 |
| 1 Emission bands unavailable at time of licensing | |||||||
| Table 2B: Number of new private cars licensed for the first time by CO2 emission band and fuel type, January-December 2015 | |||||||
| Band | Fuel Type | Total | |||||
| Petrol | Diesel | Petrol & electric | Petrol & ethanol | Electric | Other | ||
| A | 21,706 | 63,447 | 1,151 | 0 | 476 | 190 | 86,970 |
| B | 10,473 | 17,810 | 192 | 0 | 0 | 24 | 28,499 |
| C | 515 | 2,604 | 9 | 0 | 0 | 0 | 3,128 |
| D | 154 | 1,091 | 1 | 0 | 0 | 0 | 1,246 |
| E | 39 | 648 | 0 | 0 | 0 | 0 | 687 |
| F | 47 | 436 | 1 | 0 | 0 | 0 | 484 |
| G | 26 | 31 | 0 | 0 | 0 | 0 | 57 |
| Not available1 | 3 | 36 | 0 | 0 | 0 | 0 | 39 |
| Total | 32,963 | 86,103 | 1,354 | 0 | 476 | 214 | 121,110 |
| 1 Emission bands unavailable at time of licensing | |||||||
| Table 3: Number of new and used (imported) private cars licensed for the first time by make, December 2015 | |||||||
| Make | December | January - December | |||||
| New | Used (imported) | Total | New | Used (imported) | Total | ||
| Audi | 39 | 272 | 311 | 5,062 | 3,753 | 8,815 | |
| BMW | 86 | 172 | 258 | 4,651 | 2,733 | 7,384 | |
| Chevrolet | 0 | 1 | 1 | 0 | 44 | 44 | |
| Citroen | 13 | 121 | 134 | 1,880 | 1,921 | 3,801 | |
| Dacia | 67 | 7 | 74 | 3,660 | 36 | 3,696 | |
| Fiat | 9 | 17 | 26 | 670 | 280 | 950 | |
| Ford | 52 | 522 | 574 | 11,823 | 6,834 | 18,657 | |
| Honda | 11 | 106 | 117 | 1,416 | 1,446 | 2,862 | |
| Hyundai | 28 | 119 | 147 | 10,743 | 1,697 | 12,440 | |
| Kia | 18 | 71 | 89 | 5,288 | 907 | 6,195 | |
| Lexus | 5 | 9 | 14 | 494 | 163 | 657 | |
| Mazda | 17 | 49 | 66 | 2,173 | 876 | 3,049 | |
| Mercedes-Benz | 11 | 114 | 125 | 2,525 | 1,502 | 4,027 | |
| Mitsubishi | 4 | 13 | 17 | 877 | 246 | 1,123 | |
| Nissan | 28 | 129 | 157 | 10,843 | 2,098 | 12,941 | |
| Opel | 64 | 2 | 66 | 7,326 | 24 | 7,350 | |
| Peugeot | 16 | 169 | 185 | 3,449 | 2,613 | 6,062 | |
| Renault | 73 | 82 | 155 | 6,110 | 1,334 | 7,444 | |
| Seat | 7 | 39 | 46 | 2,514 | 491 | 3,005 | |
| Skoda | 59 | 72 | 131 | 7,427 | 1,081 | 8,508 | |
| Subaru | 1 | 6 | 7 | 185 | 46 | 231 | |
| Suzuki | 8 | 29 | 37 | 865 | 335 | 1,200 | |
| Toyota | 72 | 245 | 317 | 12,409 | 3,705 | 16,114 | |
| Vauxhall | 0 | 288 | 288 | 1 | 4,918 | 4,919 | |
| Volkswagen | 96 | 357 | 453 | 15,016 | 6,054 | 21,070 | |
| Volvo | 15 | 55 | 70 | 1,515 | 682 | 2,197 | |
| Other | 48 | 98 | 146 | 2,188 | 1,398 | 3,586 | |
| Total | 847 | 3,164 | 4,011 | 121,110 | 47,217 | 168,327 | |
| The information in this table is available in much greater detail in Databases (see Statbank link below) | |||||||
| Table 4: Number of new vehicles licensed for the first time by body type and taxation class, 2015 | ||||||||||
| Body type | Taxation class | Total | ||||||||
| Private cars | Goods vehicles | Tractors | Motor cycles | Exempt vehicles | Other classes | |||||
| Small PSVs | Large PSVs | Machines & contrivances | Other vehicles | |||||||
| Agricultural tractor | 0 | 0 | 1,830 | 0 | 4 | 0 | 0 | 0 | 0 | 1,834 |
| Articulated tractor unit | 0 | 877 | 61 | 0 | 8 | 0 | 0 | 0 | 0 | 946 |
| Bus | 14 | 0 | 0 | 0 | 6 | 374 | 0 | 0 | 12 | 406 |
| Chassis cab | 0 | 1 | 0 | 0 | 0 | 0 | 0 | 0 | 0 | 1 |
| Convertible | 135 | 0 | 0 | 0 | 3 | 0 | 0 | 0 | 0 | 138 |
| Crew cab | 93 | 1,255 | 0 | 0 | 75 | 0 | 0 | 0 | 0 | 1,423 |
| Estate | 12,784 | 2 | 0 | 0 | 597 | 0 | 17 | 0 | 0 | 13,400 |
| Excavator/digger | 0 | 0 | 0 | 0 | 3 | 0 | 0 | 84 | 0 | 87 |
| Fork lift | 0 | 0 | 0 | 0 | 0 | 0 | 0 | 62 | 0 | 62 |
| Hatchback | 36,357 | 0 | 0 | 0 | 633 | 0 | 24 | 0 | 0 | 37,014 |
| Jeep | 4,911 | 17 | 0 | 0 | 201 | 0 | 0 | 0 | 0 | 5,129 |
| MPV | 28,143 | 2 | 0 | 0 | 1,635 | 0 | 104 | 0 | 5 | 29,889 |
| Minibus | 15 | 1 | 0 | 0 | 3 | 43 | 0 | 0 | 9 | 71 |
| Moped | 0 | 0 | 0 | 79 | 0 | 0 | 0 | 0 | 0 | 79 |
| Motor caravan | 0 | 0 | 0 | 0 | 1 | 0 | 0 | 0 | 58 | 59 |
| Motor cycle | 0 | 0 | 0 | 1,018 | 1 | 0 | 0 | 0 | 0 | 1,019 |
| Pick up | 0 | 130 | 0 | 0 | 5 | 0 | 0 | 0 | 1 | 136 |
| Rigid | 0 | 5 | 0 | 0 | 0 | 0 | 0 | 0 | 0 | 5 |
| Saloon | 28,269 | 0 | 0 | 0 | 1,065 | 0 | 174 | 0 | 1 | 29,509 |
| Scooter | 0 | 0 | 0 | 139 | 0 | 0 | 0 | 0 | 0 | 139 |
| Sports/Coupe (non convertible) | 862 | 0 | 0 | 0 | 14 | 0 | 0 | 0 | 0 | 876 |
| Station wagon/jeep | 8,088 | 4 | 0 | 0 | 600 | 0 | 20 | 0 | 0 | 8,712 |
| Telescopic handler | 0 | 0 | 26 | 0 | 0 | 0 | 0 | 85 | 0 | 111 |
| Van | 1,378 | 19,459 | 0 | 0 | 183 | 0 | 1 | 8 | 0 | 21,029 |
| Other | 61 | 1,186 | 69 | 8 | 197 | 1 | 3 | 170 | 81 | 1,776 |
| Total | 121,110 | 22,939 | 1,986 | 1,244 | 5,234 | 418 | 343 | 409 | 167 | 153,850 |
| Table 5: Percentage of new private cars licensed for the first time by most popular colour, 2011 to 2015 | |||||
| Colour | 2011 | 2012 | 2013 | 2014 | 2015 |
| Black | 24.2 | 23.2 | 22.8 | 21.0 | 19.8 |
| Silver | 24.7 | 23.4 | 22.6 | 21.0 | 19.6 |
| Grey | 18.1 | 19.2 | 17.4 | 16.9 | 17.4 |
| White | 3.5 | 5.4 | 8.5 | 11.2 | 12.7 |
| Blue | 11.3 | 10.7 | 10.2 | 10.0 | 11.1 |
| Red | 10.4 | 9.9 | 10.5 | 10.5 | 10.9 |
| Other | 7.9 | 8.3 | 8.0 | 9.4 | 8.5 |
| Total | 100.0 | 100.0 | 100.0 | 100.0 | 100.0 |
The vehicle licensing figures are compiled from data supplied by the Department of Transport, Tourism and Sport (DTTAS), Driver and Vehicle Computer Services Division. The data provide details on the number of private cars, goods vehicles, motor cycles and other vehicles licensed for the first time in each city and county council, classified by make and size, during a given month.
The release titled 'Vehicles licensed for the first time' commenced in January 1993. It replaced the series previously published as 'Particulars of vehicles registered and licensed for the first time'.
In January 1993, separate systems for vehicle registration and licensing were introduced. The Office of the Revenue Commissioners became responsible for the compilation of vehicle registrations while the Department of the Environment, Heritage and Local Government retained responsibility for vehicle licensing. In January 2008, responsibility for vehicle licensing was transferred to the Department of Transport (which later became DTTAS).
For new cars registered from 1 July 2008 motor tax charges are determined on the basis of the CO2 emission level, based on seven CO2 bands. Tables with CO2 emission data were added to this release from July 2008.
Vehicle licensing differs from registration in that a vehicle is licensed when a valid motor tax disc is issued for the first time. Registration occurs when a vehicle is issued with a license plate (registration number) for the first time. Registration precedes licensing and the time lapse between them accounts for the differences which can occur between licensing and registration figures in a given month.
The question is often asked, which best reflects vehicle sales, licensing figures or registration figures?
In practice, on a monthly basis, the licensing data is probably a better reflection of sales. In some cases, a vehicle may be registered by a dealership in advance of a sale. Whereas, typically, vehicles are only licensed at the point of sale. However, if a vehicle is purchased towards the end of a month, the buyer may wish to defer collecting and licensing it until the start of the following month. So the issue is not clear-cut.
Exempt: The term 'exempt vehicles' in this release, refers to vehicles which are licensed for the first time but are exempt from liability to pay road tax.
Exempt vehicles can be divided into four main categories:
Machines or contrivances: Vehicles included under this category are mobile machines, forklifts, excavators and diggers.
 Hide Background Notes
Scan the QR code below to view this release online or go to
http://www.cso.ie/en/releasesandpublications/er/vlftm/vehicleslicensedforthefirsttimedecemberandyear2015/
 Show Table 1: Number of vehicles licensed for the first time classified by taxation class
 Hide Table 1: Number of vehicles licensed for the first time classified by taxation class