
| €m | €m | €m | |
| Operating Surplus | 2018 | 2019 | 2020 |
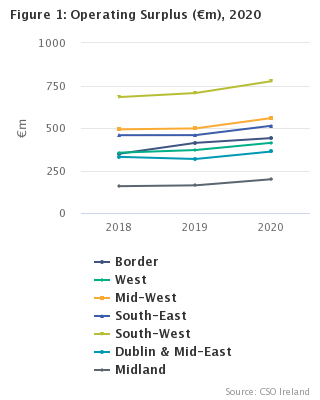
| Border | 348.6 | 412.6 | 440.8 |
| West | 354.9 | 370.4 | 413.2 |
| Mid-West | 492.1 | 497.6 | 558.8 |
| South-East | 457.7 | 458.0 | 513.5 |
| South-West | 681.9 | 705.7 | 775.8 |
| Dublin & Mid-East | 330.2 | 317.7 | 361.9 |
| Midland | 157.7 | 162.7 | 198.8 |
| State | 2,823.0 | 2,924.8 | 3,262.8 |
At the State level, livestock, milk and crops accounted for 40.3%, 30.9% and 21.8% respectively of the total value of agricultural output at basic prices. Net subsidies (i.e. subsidies on products less taxes on products) accounted for 1.1% of the value of agricultural output at basic prices.
The value of agricultural output at basic prices increased by 4.6% (+€391.8m) in 2020. The value of livestock rose by 6.5% (+€219.4m), with prices accounting for 3.5% of this growth. Cattle prices rose by 5.3% and volumes grew by 1.4% resulting in the overall value of cattle increasing by 6.8% (+€146.6m). With an 11.1% rise in prices, the value of sheep increased by 16.3% (+€42.5m). Milk production rose by 5.5% (+€144.1m) due to the combined impact of stronger milk prices (+1.6%) and higher volumes (+3.9%). Even though prices increased by 7.6%, the value of cereals fell by 11.5% (-€37.7m) due to output volumes contracting by 16.5%. Despite this, the overall value of crop production rose by 2.6% (+€49.3m) due to the large increase in the value of forage plants (+9.3%, +€97.5m).
There was only a marginal change in intermediate consumption costs (+0.3%, +€17.6m). While some costs increased, most notably forage plants (+9.6%, +€100.3m) and maintenance and repairs (+10.1%, +€49.3m), other costs fell. Expenditure on energy and lubricants contracted by 12.2% (-€53.8m) while the cost of fertilisers contracted by 8.0% (-€46.0m). The net impact of these and other changes was an increase of 11.6% (+€337.9m) in agricultural operating surplus. (See Table 1)
A regional analysis of agricultural income and expenditure shows the following:
The Border region had the second largest dependency of all regions on livestock, generating 53.0% of the region’s agricultural output at basic prices and 17.5% of Ireland’s total livestock. It also produced the majority (67.1%) of the State’s poultry output and 24.4% of Ireland’s sheep production in 2020.
With growth of 7.6% (+€84.0m), the Border region experienced the largest percentage increase in agricultural output at basic prices. Livestock production increased by 9.1% (+€52.3m) to €627.5m, with cattle, pigs and sheep accounting for €20.7m, €13.2m and €11.2m respectively of this growth. With the region producing almost a quarter (24.9%) of Ireland’s pig output, stronger prices (+3.5%) and increased volumes resulted in the value of the region’s pig production rising by 9.6% to €149.8m. Crop output grew by 11.7% (+€26.2m) to €249.8m, with forage plants accounting for €24.3m of this growth.
The region’s intermediate consumption costs increased by 5.0% (+€38.9m) to €821.7m. The cost of feedingstuffs, which accounted for 40.1% of its total intermediate consumption costs, rose by 4.8% (+€15.2m) to €329.5m. The cost of forage plants grew by 22.4% (+€24.6m) to €134.3m. At 6.8%, the Border region had the lowest operating surplus growth rate in 2020, which increased by €28.2m to €440.8m. (See Tables 1 & 2)
| X-axis label | 2020 |
|---|---|
| Cattle | 23.7 |
| Sheep | 6.2 |
| Pigs | 12.7 |
| Milk | 16.5 |
| Forage plants | 11.4 |
| All other crops | 9.7 |
| Other | 19.8 |
The West was the largest sheep producing region in 2020, producing 27.4% of Ireland’s sheep output. It also was the smallest producer of milk and cereals, generating just 4.2% of national milk output and 1.4% of its cereals in 2020. It was also the lowest consumer of feedingstuffs and fertilisers in the State, accounting for just 7.7% of total expenditure on feedingstuffs and 9.8% of the State’s expenditure on fertilisers.
The value of the West’s agricultural output at basic prices increased by 5.8% (+€45.3m) to €832.2m. The value of cattle production grew by 7.1% (+€23.2m) to €350.8m in 2020 and accounted for 42.2% of the region’s agricultural output at basic prices. The value of its sheep production rose by 15.4% (+€11.1m) to €83.1m while crops grew by 14.2% (+€22.4m) to €180.2m. Forage plants accounted for €22.0m of this growth. Milk production increased by 0.9% (+€1.1m) to €115.3m.
Intermediate consumption costs in the West fell by 1.7% (-€10.5m) to €599.5m. The largest reductions were in the cost of other goods and services, and contract work, which fell by 20.3% (-€13.0m) to €50.9m and 16.4% (-€9.7m) to €49.4m respectively. The region’s operating surplus grew by 11.5% (+€42.8m) to €413.2m. (See Table 1)
| X-axis label | 2020 |
|---|---|
| Cattle | 42.2 |
| Sheep | 10 |
| Pigs | 2 |
| Milk | 13.8 |
| Forage plants | 19.2 |
| All other crops | 2.4 |
| Other | 10.3 |
The Mid-West was the largest cattle and second largest milk producing region in 2020, supplying 19.4% of Ireland’s cattle and 21.2% of its milk production.
Agricultural output at basic prices increased by 5.2% (+€75.2m) to €1,512.1m. The value of cattle, which accounted for 29.4% of the region’s agricultural output, rose by 7.9% (+€32.5m) to €445.2m. Pig production generated 5.7% of the region’s agricultural output and its value grew by 16.7% (+€12.3m) to €85.9m. Milk, which generated 38.6% of the region’s agricultural output, increased in value by 6.7% (+€36.5m) to €583.9m. The value of the region’s crops increased by just 0.5% (+€1.2m) to €231.8m.
There was very little change in the region’s total intermediate consumption costs, which fell by €0.1m to €974.9m. While the cost of feedingstuffs rose by 2.9% (+€7.6m) to €272.5m and expenditure on forage plants increased by 2.8% (+€5.1m) to €184.5m, these and other increases were offset by a reduction in some other costs. Most notably of these were fertilisers, the cost of which fell by 11.5% (-€10.7m) to €82.1m while expenditure on energy and lubricants decreased by 11.0% (-€8.6m) to €69.9m. The region’s operating surplus grew by 12.3% (+€61.1m) to €558.8m in 2020. (See Table 1)
| X-axis label | 2020 |
|---|---|
| Cattle | 29.4 |
| Sheep | 0.8 |
| Pigs | 5.7 |
| Milk | 38.6 |
| Forage plants | 12.2 |
| All other crops | 3.1 |
| Other | 10.1 |
The South-East region was the second largest producer of crops in 2020, accounting for 19.5% of domestic crop production. It produced 30.2% of the State’s cereals and 21.7% of its potatoes. It was also the third largest milk producing region, supplying 18.9% of total output.
The value of the South East’s agricultural output at basic prices increased by 5.9% (+€82.5m) to €1,469.3m, the second largest percentage increase in the State. The value of cattle, which accounted for 20.6% of the region’s agricultural output, increased by 6.4% (+€18.3m) to €303.4m while the value of pig production grew by 21.5% (+€16.4m) to €92.4m. Milk production, which generated 35.3% of the region’s agricultural output, grew by 7.6% (+€36.7m) to €519.1m. Crop production increased by 4.5% (+€16.3m) to €379.7m.
The region’s intermediate consumption costs rose by 1.8% (+€15.0m) to €868.6m. The cost of forage plants increased by 15.0% (+€23.3m) to €179.2m and expenditure on maintenance and repairs rose by 14.9% (+€10.4m) to €80.1m. The impact of these and other increases was mitigated by a reduction in the cost of other items, including fertilisers, which fell by 10.1% (-€10.5m) to €93.6m, and other goods and services, which fell by 9.7% (-€8.9m) to €82.3m. The region’s operating surplus increased by 12.1% (+€55.5m) to €513.5m in 2020. (See Tables 1 & 2)
| X-axis label | 2020 |
|---|---|
| Cattle | 20.6 |
| Sheep | 2 |
| Pigs | 6.3 |
| Milk | 35.3 |
| Forage plants | 12.2 |
| All other crops | 13.6 |
| Other | 9.9 |
The South-West region generated 21.0% of the State’s agricultural output at basic prices, the largest of all regions. It was both the largest producer and consumer of forage plants. It also spent the most on fertilisers, accounting for 20.7% (€109.9m) of the total expenditure on fertilisers. It is the largest milk producing region in the State, generating 31.4% of national milk output in 2020.
The value of the South West’s agricultural output at basic prices increased by 4.2% (+€75.1m) to €1,870.2m. Cattle generated 20.6% of the region’s agricultural output and increased in value by 7.2% (+€25.9m) to €385.9m. Milk accounted for 46.2% of the region’s agricultural output and its value increased by 4.5% (+€37.4m) to €864.7m. The value of its crop output increased by 1.3% (+€3.8m) to €300.0m mainly due to the value of forage plants rising by 1.8% (+€3.6m) to €205.6m.
Intermediate consumption costs decreased marginally in the region (-0.2%, -€1.8m) to €1,104.9m. While the cost of many items increased, most notably the cost of maintenance and repairs (+12.2%, +€10.5m) and veterinary expenses (+11.8%, +€7.7m), these were offset by the lower cost of other inputs, the largest reductions occurring in the cost of other goods and services (-8.1%, -€9.3m) and energy and lubricants (-10.6%, -€8.1m). The region’s operating surplus grew by 9.9% (+€70.1m) to €775.8m in 2020. (See Tables 1 & 2)
| X-axis label | 2020 |
|---|---|
| Cattle | 20.6 |
| Sheep | 2.3 |
| Pigs | 5.9 |
| Milk | 46.2 |
| Forage plants | 11 |
| All other crops | 5 |
| Other | 8.9 |
This region is the largest producer of crops in the State, accounting for 22.1% of crop production. It generated almost one third of Ireland’s cereals and fresh vegetable output (32.6% and 32.3% respectively) and over half (52.2%) of its potatoes. It has the lowest levels of livestock in the State, accounting for just 10.7% of the total value of the State’s livestock.
The value of the region’s agricultural output at basic prices fell by 0.9% (-€10.6m) to €1,136.9m, the only region to experience a drop in 2020. The value of livestock production rose by 2.2% (+€8.2m) to €385.5m. Cattle output grew by 4.5% (+€9.9m) to €229.6m and sheep production increased by 16.6% (+€6.3m) to €44.3m. The value of horses contracted by 16.7% (-€12.6m) to €62.9m. The value of the region’s crop output fell by 4.5% (-€20.1m) to €429.4m. While the value of forage plants and fresh vegetables rose by 10.2% (+€14.3m) and 10.3% (+€7.2m) respectively, the value of cereals fell by 18.7% (-€21.6m) to €94.3m and potato values decreased by 24.6% (-€20.2m) to €61.8m.
Intermediate consumption costs fell by 2.7% (-€18.8m) to €679.2m. The cost of fertilisers fell by 10.8% (-€9.3m), FISIM decreased by 31.4% (-€8.5m) and seeds contracted by 30.1% (-€7.3m). These and other reductions were largely offset by the increased cost of other items, most notably forage plants, which increased by 10.6% (+€14.7m) to €153.3m. The region’s operating surplus grew by 13.9% (+€44.2m) to €361.9m. (See Tables 1 & 2)
| X-axis label | 2020 |
|---|---|
| Cattle | 20.2 |
| Sheep | 3.9 |
| Pigs | 3.3 |
| Milk | 21.7 |
| Forage plants | 13.5 |
| All other crops | 24.2 |
| Other | 13.1 |
The Midland region generated 12.3% of the total value of the State’s livestock output, 8.3% of its milk and just 8.9% of its crops. Overall, it contributed 6.1% to Ireland’s agricultural operating surplus, the lowest of all regions.
The value of the region’s agricultural output at basic prices increased by 4.7% (+€40.4m) to €903.1m. Livestock production increased by 6.5% (+€26.9m) to €441.2m. Cattle and pigs accounted for €16.0m and €10.7m respectively of that increase, with the value of cattle rising by 5.7% to €294.7m while pig production increased by 11.0% to €107.6m. Milk output grew by 7.7% (+€16.3m) to €228.4m. While there was only a very marginal change in the value of crops, (-0.2%), there was a 15.0% (-€5.2m) reduction in the value of cereals and a 22.9% decrease (-€2.2m) in the value of fresh vegetables.
The region’s total intermediate consumption costs experienced little change in 2020, falling by 0.8% (-€5.1m) to €631.2m. The lower cost of items including fertilisers (-12.0%, -€7.8m) and energy and lubricants (-10.9%, -€6.0m), was largely negated by the higher cost of others, including forage plants (+5.6%, +€6.6m) and maintenance and repairs (+9.9%, +€5.3m). The region’s operating surplus grew by 22.2% (+€36.1m) to €198.8m in 2020. (See Tables 1 & 2)
| X-axis label | 2020 |
|---|---|
| Cattle | 32.6 |
| Sheep | 2 |
| Pigs | 11.9 |
| Milk | 25.3 |
| Forage plants | 13.8 |
| All other crops | 5.3 |
| Other | 9.1 |
| Table 1a: Regional Agricultural Accounts at NUTS 3 level, 2018–2020 | €m | ||||||||||||||
| Description | Border | West | Mid-West | South-East | |||||||||||
| 20181 | 20191 | 2020 | 20181 | 20191 | 2020 | 20181 | 20191 | 2020 | 20181 | 20191 | 2020 | ||||
| Livestock | 540.2 | 575.2 | 627.5 | 435.1 | 427.5 | 461.2 | 590.1 | 564.8 | 603.4 | 489.2 | 456.5 | 486.2 | |||
| Cattle | 265.6 | 260.1 | 280.8 | 335.7 | 327.6 | 350.8 | 431.5 | 412.7 | 445.2 | 308.9 | 285.0 | 303.4 | |||
| Pigs | 104.3 | 136.7 | 149.8 | 12.8 | 16.0 | 16.9 | 71.2 | 73.6 | 85.9 | 71.6 | 76.0 | 92.4 | |||
| Sheep | 60.7 | 62.7 | 73.9 | 71.0 | 72.1 | 83.1 | 10.6 | 10.8 | 12.6 | 25.6 | 25.1 | 28.8 | |||
| Horses | 2.9 | 2.2 | 2.2 | 13.7 | 9.9 | 8.2 | 60.0 | 49.9 | 40.7 | 76.0 | 62.8 | 53.5 | |||
| Poultry | 106.7 | 113.5 | 120.8 | 1.8 | 1.9 | 2.0 | 16.8 | 17.9 | 19.0 | 7.2 | 7.6 | 8.1 | |||
| Livestock products | 225.4 | 227.4 | 238.1 | 109.0 | 117.9 | 118.5 | 540.7 | 548.9 | 585.1 | 475.3 | 487.3 | 523.1 | |||
| Milk | 182.9 | 184.9 | 194.9 | 105.1 | 114.2 | 115.3 | 539.0 | 547.4 | 583.9 | 469.8 | 482.4 | 519.1 | |||
| Other livestock products | 42.5 | 42.4 | 43.1 | 3.9 | 3.7 | 3.2 | 1.7 | 1.5 | 1.2 | 5.5 | 4.9 | 4.1 | |||
| Crops | 252.0 | 223.7 | 249.8 | 192.5 | 157.8 | 180.2 | 279.5 | 230.7 | 231.8 | 386.7 | 363.4 | 379.7 | |||
| Cereals | 5.8 | 5.3 | 5.2 | 4.2 | 4.3 | 3.9 | 24.1 | 26.4 | 25.1 | 77.0 | 93.8 | 87.6 | |||
| Potatoes | 16.3 | 14.3 | 12.4 | 0.8 | 1.0 | 0.6 | 4.0 | 4.8 | 3.3 | 31.8 | 36.4 | 25.7 | |||
| Forage plants | 139.2 | 110.4 | 134.7 | 172.7 | 137.9 | 159.9 | 226.0 | 180.9 | 185.0 | 206.8 | 156.4 | 179.5 | |||
| Fresh vegetables | 87.9 | 89.4 | 92.8 | 13.4 | 13.2 | 14.4 | 11.2 | 10.8 | 10.3 | 24.9 | 24.2 | 26.0 | |||
| Fresh fruit | 2.6 | 2.9 | 3.0 | 1.2 | 1.3 | 1.2 | 3.5 | 3.5 | 3.4 | 13.6 | 14.3 | 14.2 | |||
| Other crops | 0.2 | 1.3 | 1.7 | 0.1 | 0.1 | 0.1 | 10.8 | 4.2 | 4.8 | 32.4 | 38.2 | 46.7 | |||
| Goods output at producer prices | 1,017.6 | 1,026.2 | 1,115.4 | 736.6 | 703.2 | 759.8 | 1,410.3 | 1,344.4 | 1,420.4 | 1,351.2 | 1,307.2 | 1,389.0 | |||
| Contract work | 59.4 | 57.0 | 52.0 | 61.4 | 59.2 | 49.4 | 74.4 | 78.7 | 78.7 | 62.8 | 69.0 | 69.1 | |||
| Subsidies on products less taxes on products | 5.8 | 17.2 | 16.9 | 10.2 | 24.6 | 23.0 | -0.9 | 13.8 | 12.9 | -0.8 | 10.6 | 11.3 | |||
| Agricultural output at basic prices | 1,082.8 | 1,100.4 | 1,184.4 | 808.2 | 786.9 | 832.2 | 1,483.8 | 1,436.8 | 1,512.1 | 1,413.1 | 1,386.8 | 1,469.3 | |||
| Intermediate consumption | 840.8 | 782.8 | 821.7 | 651.0 | 610.0 | 599.5 | 1,047.9 | 975.0 | 974.9 | 899.3 | 853.6 | 868.6 | |||
| Feedingstuffs | 326.3 | 314.3 | 329.5 | 135.8 | 118.3 | 117.3 | 307.3 | 264.9 | 272.5 | 235.8 | 202.2 | 210.1 | |||
| Fertilisers | 66.3 | 56.8 | 60.2 | 65.0 | 58.9 | 52.3 | 96.7 | 92.8 | 82.1 | 94.6 | 104.1 | 93.6 | |||
| FISIM2 | 13.3 | 13.3 | 12.3 | 6.2 | 5.7 | 5.1 | 16.7 | 17.3 | 16.1 | 24.9 | 24.3 | 22.0 | |||
| Seeds | 5.9 | 5.6 | 6.1 | 6.4 | 5.6 | 6.3 | 10.4 | 9.8 | 8.9 | 15.5 | 18.9 | 16.7 | |||
| Maintenance and repairs | 66.0 | 64.5 | 72.8 | 49.3 | 60.7 | 66.1 | 91.2 | 93.8 | 98.9 | 67.2 | 69.7 | 80.1 | |||
| Other goods and services | 61.3 | 59.3 | 59.4 | 55.5 | 63.9 | 50.9 | 91.5 | 97.2 | 99.5 | 78.3 | 91.1 | 82.3 | |||
| Crop protection products | 3.0 | 2.9 | 2.9 | 2.3 | 2.5 | 3.5 | 5.2 | 5.5 | 4.9 | 16.9 | 18.8 | 19.8 | |||
| Veterinary expenses | 38.2 | 37.0 | 39.2 | 40.6 | 39.9 | 39.1 | 54.9 | 57.0 | 59.0 | 43.8 | 44.2 | 47.0 | |||
| Energy and lubricants | 62.8 | 62.3 | 53.0 | 57.2 | 58.4 | 50.1 | 76.1 | 78.5 | 69.9 | 53.4 | 55.6 | 48.7 | |||
| Forage plants | 138.1 | 109.8 | 134.3 | 171.4 | 137.0 | 159.4 | 223.6 | 179.4 | 184.5 | 206.2 | 155.9 | 179.2 | |||
| Contract work | 59.4 | 57.0 | 52.0 | 61.4 | 59.2 | 49.4 | 74.4 | 78.7 | 78.7 | 62.8 | 69.0 | 69.1 | |||
| Gross value added at basic prices | 242.0 | 317.6 | 362.6 | 157.1 | 177.0 | 232.8 | 435.8 | 461.8 | 537.2 | 513.8 | 533.2 | 600.7 | |||
| Fixed capital consumption | 91.5 | 96.2 | 107.0 | 42.6 | 40.9 | 43.9 | 114.6 | 124.8 | 139.4 | 170.8 | 175.4 | 191.1 | |||
| Net value added at basic prices | 150.5 | 221.4 | 255.7 | 114.5 | 136.1 | 188.9 | 321.2 | 337.0 | 397.7 | 343.0 | 357.8 | 409.6 | |||
| Other subsidies less taxes on production | 276.2 | 272.0 | 270.2 | 329.0 | 325.8 | 320.7 | 258.4 | 250.9 | 256.2 | 194.8 | 182.9 | 191.0 | |||
| Factor income | 426.7 | 493.3 | 525.8 | 443.5 | 461.9 | 509.5 | 579.6 | 588.0 | 653.9 | 537.9 | 540.8 | 600.7 | |||
| Compensation of employees | 78.2 | 80.7 | 85.0 | 88.6 | 91.5 | 96.4 | 87.5 | 90.3 | 95.1 | 80.1 | 82.7 | 87.1 | |||
| Operating surplus3 | 348.6 | 412.6 | 440.8 | 354.9 | 370.4 | 413.2 | 492.1 | 497.6 | 558.8 | 457.7 | 458.0 | 513.5 | |||
| Table 1b: Regional Agricultural Accounts at NUTS 3 level, 2018–2020 | €m | ||||||||||||||
| Description | South-West | Dublin & Mid-East | Midland | State | |||||||||||
| 20181 | 20191 | 2020 | 20181 | 20191 | 2020 | 20181 | 20191 | 2020 | 20181 | 20191 | 2020 | ||||
| Livestock | 559.2 | 556.7 | 586.8 | 396.8 | 377.3 | 385.5 | 420.7 | 414.3 | 441.2 | 3,431.4 | 3,372.4 | 3,591.8 | |||
| Cattle | 378.7 | 360.1 | 385.9 | 233.7 | 219.7 | 229.6 | 293.9 | 278.7 | 294.7 | 2,248.1 | 2,143.9 | 2,290.5 | |||
| Pigs | 87.8 | 109.7 | 111.2 | 27.4 | 34.1 | 38.0 | 84.0 | 96.9 | 107.6 | 459.1 | 543.0 | 601.9 | |||
| Sheep | 36.3 | 36.6 | 42.4 | 38.8 | 38.0 | 44.3 | 15.8 | 15.6 | 18.1 | 258.8 | 260.8 | 303.3 | |||
| Horses | 40.7 | 33.8 | 29.6 | 87.5 | 75.5 | 62.9 | 25.5 | 21.4 | 18.9 | 306.4 | 255.5 | 216.1 | |||
| Poultry | 15.6 | 16.6 | 17.7 | 9.4 | 10.0 | 10.6 | 1.6 | 1.7 | 1.8 | 159.0 | 169.2 | 180.0 | |||
| Livestock products | 850.9 | 841.5 | 878.9 | 239.5 | 252.7 | 258.2 | 198.5 | 213.9 | 230.0 | 2,639.2 | 2,689.7 | 2,832.0 | |||
| Milk | 836.5 | 827.3 | 864.7 | 226.8 | 240.3 | 246.4 | 196.6 | 212.1 | 228.4 | 2,556.7 | 2,608.6 | 2,752.7 | |||
| Other livestock products | 14.4 | 14.2 | 14.2 | 12.8 | 12.5 | 11.8 | 1.9 | 1.8 | 1.6 | 82.6 | 81.1 | 79.2 | |||
| Crops | 331.1 | 296.2 | 300.0 | 479.9 | 449.5 | 429.4 | 204.3 | 172.4 | 172.0 | 2,126.0 | 1,893.6 | 1,942.9 | |||
| Cereals | 40.5 | 46.8 | 44.2 | 104.9 | 115.9 | 94.3 | 31.8 | 34.6 | 29.4 | 288.4 | 327.2 | 289.5 | |||
| Potatoes | 13.6 | 14.6 | 12.4 | 70.4 | 82.0 | 61.8 | 2.5 | 3.1 | 2.1 | 139.3 | 156.3 | 118.3 | |||
| Forage plants | 247.7 | 202.0 | 205.6 | 193.3 | 139.4 | 153.7 | 154.4 | 118.4 | 124.6 | 1,340.3 | 1,045.4 | 1,143.0 | |||
| Fresh vegetables | 7.5 | 10.0 | 11.1 | 72.3 | 70.0 | 77.2 | 9.0 | 9.7 | 7.5 | 226.2 | 227.4 | 239.3 | |||
| Fresh fruit | 7.0 | 7.6 | 8.0 | 20.3 | 22.2 | 22.9 | 3.1 | 3.3 | 3.4 | 51.3 | 55.1 | 56.1 | |||
| Other crops | 14.7 | 15.1 | 18.9 | 18.8 | 20.0 | 19.6 | 3.5 | 3.3 | 5.0 | 80.5 | 82.3 | 96.7 | |||
| Goods output at producer prices | 1,741.2 | 1,694.4 | 1,765.7 | 1,116.3 | 1,079.6 | 1,073.1 | 823.4 | 800.7 | 843.2 | 8,196.7 | 7,955.7 | 8,366.7 | |||
| Contract work | 97.8 | 93.6 | 96.0 | 54.2 | 56.8 | 54.4 | 43.4 | 47.1 | 47.4 | 453.2 | 461.2 | 447.0 | |||
| Subsidies on products less taxes on products | -3.3 | 7.2 | 8.6 | 1.7 | 11.2 | 9.5 | 1.2 | 15.0 | 12.5 | 13.9 | 99.5 | 94.6 | |||
| Agricultural output at basic prices | 1,835.7 | 1,795.1 | 1,870.2 | 1,172.2 | 1,147.6 | 1,136.9 | 868.0 | 862.8 | 903.1 | 8,663.7 | 8,516.4 | 8,908.3 | |||
| Intermediate consumption | 1,195.4 | 1,106.7 | 1,104.9 | 736.5 | 698.0 | 679.2 | 673.1 | 636.3 | 631.2 | 6,044.1 | 5,662.2 | 5,679.9 | |||
| Feedingstuffs | 350.3 | 309.1 | 310.6 | 143.9 | 126.0 | 127.0 | 175.3 | 155.1 | 158.2 | 1,674.6 | 1,489.9 | 1,525.2 | |||
| Fertilisers | 117.2 | 114.4 | 109.9 | 78.2 | 85.8 | 76.5 | 64.1 | 65.6 | 57.7 | 582.1 | 578.3 | 532.3 | |||
| FISIM2 | 23.5 | 23.6 | 20.8 | 26.5 | 27.2 | 18.6 | 21.6 | 23.3 | 19.6 | 132.7 | 134.6 | 114.5 | |||
| Seeds | 12.7 | 14.0 | 12.5 | 16.4 | 24.2 | 16.9 | 7.3 | 7.7 | 7.1 | 74.6 | 85.6 | 74.5 | |||
| Maintenance and repairs | 91.9 | 86.7 | 97.2 | 57.8 | 60.7 | 65.0 | 50.6 | 53.9 | 59.2 | 474.0 | 489.9 | 539.2 | |||
| Other goods and services | 109.4 | 114.7 | 105.5 | 58.3 | 61.0 | 56.7 | 60.9 | 66.1 | 64.2 | 515.2 | 553.4 | 518.4 | |||
| Crop protection products | 7.5 | 8.1 | 6.4 | 29.3 | 32.4 | 30.8 | 9.1 | 10.5 | 8.6 | 73.3 | 80.7 | 76.9 | |||
| Veterinary expenses | 67.0 | 65.0 | 72.7 | 30.1 | 32.1 | 33.2 | 34.0 | 33.9 | 35.5 | 308.5 | 309.2 | 325.8 | |||
| Energy and lubricants | 71.2 | 76.1 | 68.0 | 49.7 | 53.3 | 46.7 | 53.6 | 55.5 | 49.5 | 424.1 | 439.6 | 385.8 | |||
| Forage plants | 247.0 | 201.5 | 205.2 | 192.2 | 138.7 | 153.3 | 153.4 | 117.6 | 124.2 | 1,331.8 | 1,039.9 | 1,140.2 | |||
| Contract work | 97.8 | 93.6 | 96.0 | 54.2 | 56.8 | 54.4 | 43.4 | 47.1 | 47.4 | 453.2 | 461.2 | 447.0 | |||
| Gross value added at basic prices | 640.3 | 688.4 | 765.3 | 435.7 | 449.6 | 457.8 | 194.9 | 226.5 | 272.0 | 2,619.7 | 2,854.2 | 3,228.4 | |||
| Fixed capital consumption | 161.4 | 170.9 | 180.9 | 182.1 | 196.5 | 161.8 | 148.7 | 168.4 | 170.6 | 911.7 | 973.1 | 994.6 | |||
| Net value added at basic prices | 478.9 | 517.6 | 584.5 | 253.6 | 253.1 | 296.0 | 46.1 | 58.1 | 101.4 | 1,708.0 | 1,881.1 | 2,233.8 | |||
| Other subsidies less taxes on production | 301.4 | 289.9 | 298.5 | 160.8 | 151.6 | 157.5 | 162.1 | 156.9 | 152.4 | 1,682.8 | 1,630.0 | 1,646.5 | |||
| Factor income | 780.4 | 807.5 | 883.0 | 414.4 | 404.7 | 453.5 | 208.3 | 215.0 | 253.8 | 3,390.7 | 3,511.1 | 3,880.2 | |||
| Compensation of employees | 98.5 | 101.7 | 107.2 | 84.2 | 87.0 | 91.6 | 50.6 | 52.3 | 55.1 | 567.7 | 586.2 | 617.5 | |||
| Operating surplus3 | 681.9 | 705.7 | 775.8 | 330.2 | 317.7 | 361.9 | 157.7 | 162.7 | 198.8 | 2,823.0 | 2,924.8 | 3,262.8 | |||
| 1 Revised | |||||||||||||||
| 2 FISIM: Financial Intermediation Services Indirectly Measured. | |||||||||||||||
| 3 This is calculated before deduction of interest payments on borrowed capital and land rental paid by farmers to landowners. | |||||||||||||||
| Table 2: Regional Distribution of Agricultural Output, Input and Income, 2020 | €m | ||||||||
| Region | Livestock | Livestock Products | Crops | Goods Output at Producer Prices | Agricultural Output at Basic Prices | Intermediate Consumption | Gross Value Added at Basic Prices | Net Subsidies1 | Operating Surplus |
| Northern and Western | 1,088.7 | 356.5 | 430.0 | 1,875.3 | 2,016.6 | 1,421.2 | 595.4 | 630.7 | 854.0 |
| % of State total | 30.3 | 12.6 | 22.1 | 22.4 | 22.6 | 25.0 | 18.4 | 36.2 | 26.2 |
| Border | 627.5 | 238.1 | 249.8 | 1,115.4 | 1,184.4 | 821.7 | 362.6 | 287.1 | 440.8 |
| % of State total | 17.5 | 8.4 | 12.9 | 13.3 | 13.3 | 14.5 | 11.2 | 16.5 | 13.5 |
| West | 461.2 | 118.5 | 180.2 | 759.8 | 832.2 | 599.5 | 232.8 | 343.6 | 413.2 |
| % of State total | 12.8 | 4.2 | 9.3 | 9.1 | 9.3 | 10.6 | 7.2 | 19.7 | 12.7 |
| Southern | 1,676.4 | 1,987.2 | 911.5 | 4,575.0 | 4,851.6 | 2,948.4 | 1,903.2 | 778.4 | 1,848.1 |
| % of State total | 46.7 | 70.2 | 46.9 | 54.7 | 54.5 | 51.9 | 59.0 | 44.7 | 56.6 |
| Mid-West | 603.4 | 585.1 | 231.8 | 1,420.4 | 1,512.1 | 974.9 | 537.2 | 269.1 | 558.8 |
| % of State total | 16.8 | 20.7 | 11.9 | 17.0 | 17.0 | 17.2 | 16.6 | 15.5 | 17.1 |
| South-East | 486.2 | 523.1 | 379.7 | 1,389.0 | 1,469.3 | 868.6 | 600.7 | 202.3 | 513.5 |
| % of State total | 13.5 | 18.5 | 19.5 | 16.6 | 16.5 | 15.3 | 18.6 | 11.6 | 15.7 |
| South-West | 586.8 | 878.9 | 300.0 | 1,765.7 | 1,870.2 | 1,104.9 | 765.3 | 307.1 | 775.8 |
| % of State total | 16.3 | 31.0 | 15.4 | 21.1 | 21.0 | 19.5 | 23.7 | 17.6 | 23.8 |
| Eastern and Midland | 826.7 | 488.2 | 601.4 | 1,916.3 | 2,040.1 | 1,310.3 | 729.8 | 331.9 | 560.7 |
| % of State total | 23.0 | 17.2 | 31.0 | 22.9 | 22.9 | 23.1 | 22.6 | 19.1 | 17.2 |
| Dublin & Mid-East | 385.5 | 258.2 | 429.4 | 1,073.1 | 1,136.9 | 679.2 | 457.8 | 167.0 | 361.9 |
| % of State total | 10.7 | 9.1 | 22.1 | 12.8 | 12.8 | 12.0 | 14.2 | 9.6 | 11.1 |
| Midland | 441.2 | 230.0 | 172.0 | 843.2 | 903.1 | 631.2 | 272.0 | 165.0 | 198.8 |
| % of State total | 12.3 | 8.1 | 8.9 | 10.1 | 10.1 | 11.1 | 8.4 | 9.5 | 6.1 |
| State | 3,591.8 | 2,832.0 | 1,942.9 | 8,366.7 | 8,908.3 | 5,679.9 | 3,228.4 | 1,741.1 | 3,262.8 |
| 1 Net subsidies: Subsidies on products less taxes on products plus subsidies on production less taxes on production. | |||||||||
| Table 3: Net Subsidies1 and Operating Surplus by Region, 2018–2020 | €m | ||
| Region | 20182 | 20192 | 2020 |
| Northern and Western | |||
| Net subsidies | 621.1 | 639.5 | 630.7 |
| Operating surplus | 703.5 | 783.0 | 854.0 |
| Net subsidies as a % of operating surplus | 88.3 | 81.7 | 73.9 |
| Border | |||
| Net subsidies | 282.0 | 289.1 | 287.1 |
| Operating surplus | 348.6 | 412.6 | 440.8 |
| Net subsidies as a % of operating surplus | 80.9 | 70.1 | 65.1 |
| West | |||
| Net subsidies | 339.1 | 350.4 | 343.6 |
| Operating surplus | 354.9 | 370.4 | 413.2 |
| Net subsidies as a % of operating surplus | 95.6 | 94.6 | 83.2 |
| Southern | |||
| Net subsidies | 749.6 | 755.3 | 778.4 |
| Operating surplus | 1,631.7 | 1,661.4 | 1,848.1 |
| Net subsidies as a % of operating surplus | 45.9 | 45.5 | 42.1 |
| Mid-West | |||
| Net subsidies | 257.4 | 264.7 | 269.1 |
| Operating surplus | 492.1 | 497.6 | 558.8 |
| Net subsidies as a % of operating surplus | 52.3 | 53.2 | 48.2 |
| South-East | |||
| Net subsidies | 194.0 | 193.5 | 202.3 |
| Operating surplus | 457.7 | 458.0 | 513.5 |
| Net subsidies as a % of operating surplus | 42.4 | 42.3 | 39.4 |
| South-West | |||
| Net subsidies | 298.2 | 297.1 | 307.1 |
| Operating surplus | 681.9 | 705.7 | 775.8 |
| Net subsidies as a % of operating surplus | 43.7 | 42.1 | 39.6 |
| Eastern and Midland | |||
| Net subsidies | 325.9 | 334.7 | 331.9 |
| Operating surplus | 487.8 | 480.4 | 560.7 |
| Net subsidies as a % of operating surplus | 66.8 | 69.7 | 59.2 |
| Dublin & Mid-East | |||
| Net subsidies | 162.5 | 162.8 | 167.0 |
| Operating surplus | 330.2 | 317.7 | 361.9 |
| Net subsidies as a % of operating surplus | 49.2 | 51.3 | 46.1 |
| Midland | |||
| Net subsidies | 163.3 | 171.9 | 165.0 |
| Operating surplus | 157.7 | 162.7 | 198.8 |
| Net subsidies as a % of operating surplus | 103.6 | 105.6 | 83.0 |
| State | |||
| Net subsidies | 1,696.6 | 1,729.5 | 1,741.1 |
| Operating surplus | 2,823.0 | 2,924.8 | 3,262.8 |
| Net subsidies as a % of operating surplus | 60.1 | 59.1 | 53.4 |
| 1 Net subsidies: Subsidies on products less taxes on products plus subsidies on production less taxes on production. | |||
| 2 Revised | |||
The Regional Accounts for Agriculture release provides a regional breakdown of figures already published at State level in the Output, Input and Income in Agriculture – Final Estimate release. Both publications are prepared using similar methodology and definitions of the accounts items, which are described in the Background Notes of the Output, Input and Income in Agriculture release.
In the absence of the actual regional value data, the values of output and input accounts items at State level are apportioned to each region using a set of appropriate allocators. Derived variables, such as Gross Value Added at basic prices (GVA) or Operating surplus are then calculated separately for each region. For example:
GVA at basic prices = Agricultural output at basic prices – Intermediate consumption
Operating surplus = GVA at basic prices – Compensation of employees
– Fixed capital consumption
+ Other subsidies less taxes on production
The choice of allocator used to distribute State values to the regions varies for each accounts item. It is, in general, the factor that mainly determines the value of the item. For example, for cattle output the allocator is the total number of cattle less number of dairy cows in each region; for pigs and sheep output it is the number of pigs and sheep in December of the reference year; for milk output it is the number of dairy cows times the average output per cow in the region etc.
Most of the items of intermediate consumption, such as expenditure on fertilisers, crop protection products, energy and lubricants, maintenance and repairs, veterinary expenses and expenditure on other goods and services, are allocated based on the total expenditures in each region as measured by the National Farm Survey conducted annually by Teagasc.
Due to the indirect nature of the methodology described above more reliance should be placed on the changes between years rather than on the absolute value of the figures for any one year.
The regional results presented in this release relate to each region as a whole. Thus, the regional values of the accounts items, including operating surplus, are not necessarily spread uniformly throughout the region.
The regional classifications in this release are based on the common classification of territorial units for statistics established by the Commission Regulation (EU) No 2066 of 2016 (NUTS - Nomenclature of Territorial Units).
The NUTS 3 regions correspond to the eight Regional Authorities established under the Local Government Act, 1991 (Regional Authorities) (Establishment) Order, 1993, and amended by the Local Government Reform Act 2014. The NUTS 2 regions are groupings of the NUTS 3 regions.
The composition of the regions is set out below:
|
NUTS 2 Region |
NUTS 3 Region |
Constituting Counties |
|
Northern and Western |
Border |
Cavan, Donegal, Leitrim, Monaghan, Sligo |
|
West |
Galway, Mayo, Roscommon |
|
|
Southern |
Mid-West |
Clare, Limerick, Tipperary |
|
South-East |
Carlow, Kilkenny, Waterford, Wexford |
|
|
South-West |
Cork, Kerry |
|
|
Eastern and Midland |
Dublin |
Dublin |
|
Mid-East |
Kildare, Louth, Meath, Wicklow |
|
|
Midland |
Laois, Longford, Offaly, Westmeath |
Unless otherwise stated, all references to agricultural output in the text, maps and figures contained in this release relate to agricultural output at basic prices.
Any revisions to previous years’ estimates are made as part of the production process for the Output, Input and Income in Agriculture (OIIA), Final estimate release. When preparing the final estimates for the current year’s release (year T), routine revisions are made to the final estimates for the two previous years also (i.e. years T-1 and T-2). The revisions cycle for the Regional Accounts for Agriculture release is the same as that for the Final estimates OIIA release. Any revisions made to the OIIAs are also made to the Regional accounts as these two sets of accounts are always based on the same data and reconcile with each other. These revisions to previously published final estimates tend to be minor. For further details on the revisions policy, please refer to the release’s Quality Report.
Individual figures have been rounded independently and therefore the component items may not add to the totals shown or, in the case of percentages, to 100%.
 Hide Background Notes
Scan the QR code below to view this release online or go to
http://www.cso.ie/en/releasesandpublications/er/raa/regionalaccountsforagriculture2020/
 Show Table 1 Regional Agriculture Accounts at NUTS 3 level, 2018–2020
 Hide Table 1 Regional Agriculture Accounts at NUTS 3 level, 2018–2020