
| €m | €m | €m | |
| Operating Surplus | 2017 | 2018 | 2019 |
| Border | 441.0 | 370.4 | 433.8 |
| West | 452.1 | 392.2 | 412.2 |
| Mid-West | 602.0 | 502.6 | 505.8 |
| South-East | 484.4 | 439.9 | 448.1 |
| South-West | 851.5 | 703.1 | 731.3 |
| Dublin & Mid-East | 378.5 | 372.3 | 352.3 |
| Midland | 212.6 | 164.0 | 171.8 |
| State | 3,422.0 | 2,944.5 | 3,055.2 |
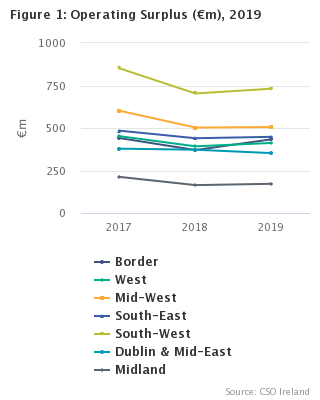
On a national basis, operating surplus for the agricultural sector increased by €110.7m (+3.8%) in 2019, a recovery of 23.2% of the €477.5m decrease experienced in 2018. This was primarily the result of reduced intermediate consumption costs during 2019 rather than output growth.
The drought of 2018 had a significant impact on crop producers, with substantial price increases resulting from lower output volumes and increased demand. When these price increases were largely reversed in 2019, the overall impact on crop producers was reduced output values. The most notable exception to this was cereal production, where the return to more suitable weather conditions resulted in output growth that significantly outweighed the impact of reduced prices. The reduction in crop prices combined with improved weather conditions had a positive impact on livestock and milk producers who profited from the reduced cost of their two main inputs, namely forage plants and feedingstuffs.
A regional analysis of agricultural income and expenditure shows the following:
This region had the largest recovery of its operating surplus in 2019. With pig production responsible for 12.4% of the value of its agricultural output at basic prices, the largest proportion of all regions, it benefited most from the increased pig prices. As a result, the value of its pig production increased by €32.4m (+31.1%). This was the main factor that contributed to it being the only region where the value of livestock grew in 2019, increasing by €28.6m (+5.2%).
With little growth in the value of milk production, the value of livestock products increased by just €1.5m (+0.7%) in the Border region. Crops, which contributed 20.2% to the value of its agricultural output, decreased in value by €28.3m (-11.2%). This was due to the large reduction in the value of forage plants, which fell by €28.5m (-20.5%). In relation to input costs, intermediate consumption fell by €60.4m (-7.2%) due mainly to a reduction of €28.0m (-20.3%) and €11.9m (-3.7%) in the cost of forage plants and feedingstuffs respectively. Net subsidies represented 69.3% of the region’s operating surplus. (See Tables 1 & 3)
| X-axis label | 2019 |
|---|---|
| Cattle | 23.6 |
| Sheep | 5.7 |
| Pigs | 12.4 |
| Other livestock | 11 |
| Milk | 16.7 |
| Cereals | 0.5 |
| Forage plants | 10 |
| All other crops | 9.8 |
| Other | 10.5 |
With growth of €20.0m (+5.1%) in operating surplus in 2019, the West recovered a third (+33.3%) of the €59.9m reduction in operating surplus that it suffered in 2018. As pig production accounted for just 1.9% of the value of its agricultural output in 2019, an increase of 24.8% in its value amounted to just €3.2m. With the value of cattle falling by €9.2m (-2.7%), the overall value of livestock fell by €4.3m (-0.9%).
The value of milk production in the West increased by €8.8m (+8.4%) in 2019. Crops, which represented 19.2% of the region’s agricultural output, fell in value by €34.7m (-18.0%), almost all of which can be attributed to a reduction in the value of forage plants. Intermediate consumption costs fell by €42.0m (-6.4%). Forage plants and feedingstuffs contributed €34.1m and €17.4m respectively to this drop. This was the region with the second highest dependency on net subsidies where they accounted for 86.4% of its operating surplus. (See Tables 1 & 3)
| X-axis label | 2019 |
|---|---|
| Cattle | 40 |
| Sheep | 8.8 |
| Pigs | 1.9 |
| Other livestock | 5.6 |
| Milk | 13.9 |
| Cereals | 0.5 |
| Forage plants | 16.8 |
| All other crops | 1.9 |
| Other | 10.6 |
The recovery of operating surplus in 2019 was relatively small for the Mid-West. While 2018 saw operating surplus decrease by €99.3m, just €3.2m of this was recovered in 2019 when operating surplus increased by 0.6%. The value of livestock fell by €30.8m (-5.3%) in 2019 with cattle responsible for €20.2m of this fall and horses for a further €13.6m.
The value of the Mid-West region’s milk production increased by €7.0m (+1.3%) while crop values fell by €48.5m (-17.3%). As with all other regions, forage plants were the main contributor to this decline with their value decreasing by €43.6m (-19.3%). Intermediate consumption costs fell by €75.0m (-7.2%) due to reductions of €42.4m and €42.7m in the cost of feedingstuffs and forage plants respectively. Over half of the operating surplus (55.7%) in the Mid-West was attributable to net subsidies. (See Tables 1 & 3)
| X-axis label | 2019 |
|---|---|
| Cattle | 29.1 |
| Sheep | 0.8 |
| Pigs | 5.2 |
| Other livestock | 3.9 |
| Milk | 38.3 |
| Cereals | 1.8 |
| Forage plants | 12.8 |
| All other crops | 1.6 |
| Other | 6.6 |
The South-East region followed the same trend as most other regions with an increase of €8.3m (+1.9%) in its operating surplus. This represents a 18.6% recovery of the €44.5m contraction experienced in 2018. The value of its livestock production fell by €27.3m (-6.0%), with cattle responsible for €24.9m of this fall.
Dairy farmers experienced some growth, with the value of milk increasing by €11.3m (+2.4%). Crops, which accounted for 26.9% of the value of region’s agricultural output, fell by €22.0m (-5.7%). Increases of €13.2m (+17.2%) in the value of cereal production helped to offset the €45.1m decrease (-21.8%) in the value of forage plants. Intermediate consumption costs fell by €45.2m (-5.0%) with feedingstuffs accounting for €33.6m of this decline. Combined with a €45.0m decrease (-21.8%) in the cost of forage plants, these two items helped to offset increases in other input costs. Just less than half of the operating surplus (47.7%) in the South-East region was dependent on net subsidies. (See Tables 1 & 3)
| X-axis label | 2019 |
|---|---|
| Cattle | 21.1 |
| Sheep | 1.8 |
| Pigs | 5.6 |
| Other livestock | 2.8 |
| Milk | 35.5 |
| Cereals | 6.7 |
| Forage plants | 11.9 |
| All other crops | 8.3 |
| Other | 6.2 |
Operating surplus increased by €28.2m (+4.0%) in 2019, a recovery of 19.0% of the €148.4m decrease experienced in 2018. Growth of €21.8m (+24.8%) in the value of pig production was offset by the €19.8m (-5.2%) fall in the value of cattle output. Overall, the value of livestock fell marginally by €3.5m (-0.6%).
This region had the highest dependency on dairy farming, with 46.1% of the value of its agricultural output derived from milk. The value of its milk output decreased by €11.4m (-1.4%) making it the only region that experienced a fall in the value of milk production. The value of crop production in the region fell by €34.4m (-10.4%), with forage plants falling by €43.2m (-17.4%). Lower crop prices contributed to a decrease of €91.0m (-7.6%) in intermediate consumption costs as the cost of feedingstuffs fell by €41.2m (-11.8%) and forage plants declined by €43.0m (-17.4%). This region had the lowest dependency on net subsidies as they represented just 44.4% of its operating surplus. (See Tables 1 & 3)
| X-axis label | 2019 |
|---|---|
| Cattle | 20.2 |
| Sheep | 2 |
| Pigs | 6.1 |
| Other livestock | 2.5 |
| Milk | 46.1 |
| Cereals | 2.5 |
| Forage plants | 11.4 |
| All other crops | 2.6 |
| Other | 6.4 |
With its large dependency on crop production, which accounted for 38.7% of the value of its agricultural output compared with a national average of 22.3%, this region was the only one to experience an actual decrease in operating surplus in 2019, which fell by €20.0m (-5.4%). This fall should be interpreted in the context of what occurred in 2018 when, again due to the high concentration of crops in the region, it experienced the smallest decrease (-1.6%) in operating surplus against a national fall of 14.0%.
In 2019, the value of livestock in the Dublin & Mid-East region fell by €27.5m (-6.5%) with the value of horse and cattle production falling by €18.9m and €14.7m respectively. Intermediate consumption costs fell by €37.3m (-5.1%), as the costs of forage plants decreased by €46.9m (-24.4%) and feedingstuffs fell by €17.9m (-12.5%). Just over half (51.4%) of the region’s operating surplus was derived from net subsidies. (See Tables 1 & 3)
| X-axis label | 2019 |
|---|---|
| Cattle | 19 |
| Sheep | 3.3 |
| Pigs | 2.9 |
| Other livestock | 8.6 |
| Milk | 20.6 |
| Cereals | 9.6 |
| Forage plants | 12.6 |
| All other crops | 16.6 |
| Other | 6.9 |
The operating surplus in the Midland region increased by €7.8m (+4.7%) which represents a 16.0% recovery of the €48.5m reduction that occurred in 2018. With pig farming responsible for 11.3% of the value of its agricultural output, the second highest in the country, this region benefited significantly from increased pig prices. These increases resulted in the value of pig production rising by €13.0m (+15.4%). With the value of both cattle falling by €16.1m and horses falling by €4.8m, overall the value of livestock fell by €8.1m (-1.9%).
Dairy farmers did relatively well, with the value of milk increasing by €15.0m (+7.6%). Similar to all other regions, the value of crop production in the region fell, decreasing by €31.4m (-15.4%) as the value of forage plants contracted by €34.1m (-22.1%). Intermediate consumption costs fell by €39.6m (-5.9%), with the costs of forage plants and feedingstuffs decreasing by €33.7m (-22.0%) and €20.2m (-11.5%) respectively. Without net subsidies, this is the only region in 2019 that would have made an operating loss as they represented 104.5% of its operating surplus. (See Tables 1 & 3)
| X-axis label | 2019 |
|---|---|
| Cattle | 32.5 |
| Sheep | 1.8 |
| Pigs | 11.3 |
| Other livestock | 2.3 |
| Milk | 24.6 |
| Cereals | 3.9 |
| Forage plants | 14 |
| All other crops | 2.2 |
| Other | 7.4 |
| Table 1a Regional Agricultural Accounts at NUTS 3 level, 2017 - 2019 | €m | ||||||||||||||
| Description | Border | West | Mid-West | South-East | |||||||||||
| 2017 | 2018 | 2019 | 2017 | 2018 | 2019 | 2017 | 2018 | 2019 | 2017 | 2018 | 2019 | ||||
| Livestock | 580.7 | 553.2 | 581.8 | 489.5 | 466.9 | 462.6 | 590.7 | 584.6 | 553.8 | 474.1 | 452.7 | 425.4 | |||
| Cattle | 282.9 | 267.2 | 261.0 | 355.4 | 337.8 | 328.7 | 456.2 | 434.2 | 414.0 | 322.8 | 310.9 | 286.0 | |||
| Pigs | 123.3 | 104.3 | 136.7 | 14.5 | 12.8 | 16.0 | 69.2 | 71.2 | 73.6 | 85.5 | 71.6 | 76.0 | |||
| Sheep | 59.9 | 60.7 | 62.7 | 72.3 | 71.0 | 72.1 | 10.9 | 10.6 | 10.8 | 26.7 | 25.6 | 25.1 | |||
| Horses | 5.2 | 8.7 | 7.1 | 45.5 | 43.3 | 43.9 | 37.2 | 50.9 | 37.4 | 31.7 | 37.1 | 30.6 | |||
| Poultry | 109.5 | 112.3 | 114.4 | 1.9 | 1.9 | 1.9 | 17.2 | 17.7 | 18.0 | 7.4 | 7.6 | 7.7 | |||
| Livestock products | 221.6 | 225.4 | 226.9 | 113.4 | 109.0 | 117.6 | 547.1 | 540.7 | 547.5 | 469.6 | 475.3 | 486.1 | |||
| Milk | 182.7 | 182.9 | 184.5 | 109.8 | 105.1 | 113.9 | 545.6 | 539.0 | 546.0 | 465.1 | 469.8 | 481.1 | |||
| Other livestock products | 38.9 | 42.5 | 42.5 | 3.6 | 3.9 | 3.7 | 1.4 | 1.7 | 1.5 | 4.5 | 5.5 | 5.0 | |||
| Crops | 224.7 | 252.0 | 223.8 | 165.5 | 192.5 | 157.8 | 220.4 | 279.5 | 231.1 | 341.7 | 386.7 | 364.6 | |||
| Cereals | 3.9 | 5.8 | 5.1 | 3.2 | 4.2 | 4.1 | 19.8 | 24.1 | 25.4 | 64.2 | 77.0 | 90.3 | |||
| Potatoes | 11.8 | 16.3 | 14.3 | 0.8 | 0.8 | 1.1 | 3.3 | 4.0 | 4.8 | 27.1 | 31.8 | 36.5 | |||
| Forage plants | 116.5 | 139.2 | 110.7 | 145.5 | 172.7 | 138.2 | 177.0 | 226.0 | 182.4 | 175.1 | 206.8 | 161.7 | |||
| Fresh vegetables | 88.6 | 87.9 | 89.4 | 14.3 | 13.4 | 13.1 | 10.5 | 11.2 | 10.8 | 24.4 | 24.9 | 23.7 | |||
| Fresh fruit | 3.0 | 2.6 | 2.9 | 1.3 | 1.2 | 1.3 | 3.6 | 3.5 | 3.5 | 14.1 | 13.6 | 14.3 | |||
| Other crops | 0.9 | 0.2 | 1.3 | 0.3 | 0.1 | 0.1 | 6.3 | 10.8 | 4.2 | 36.7 | 32.4 | 38.2 | |||
| Goods output at producer prices | 1,026.9 | 1,030.7 | 1,032.5 | 768.4 | 768.4 | 738.1 | 1,358.1 | 1,404.8 | 1,332.4 | 1,285.5 | 1,314.6 | 1,276.1 | |||
| Contract work | 45.5 | 59.4 | 57.0 | 44.9 | 61.4 | 59.2 | 66.3 | 74.4 | 78.7 | 57.4 | 62.8 | 69.0 | |||
| Subsidies on products less taxes on products | 4.8 | 5.8 | 17.2 | 9.0 | 10.2 | 24.6 | -1.0 | -0.9 | 13.8 | -0.8 | -0.8 | 10.6 | |||
| Agricultural output at basic prices | 1,077.2 | 1,095.9 | 1,106.7 | 822.3 | 839.9 | 821.8 | 1,423.4 | 1,478.2 | 1,424.9 | 1,342.1 | 1,376.5 | 1,355.6 | |||
| Intermediate consumption | 736.7 | 840.2 | 779.8 | 555.8 | 650.7 | 608.8 | 894.4 | 1,047.2 | 972.2 | 822.4 | 898.2 | 853.0 | |||
| Feedingstuffs | 288.7 | 326.3 | 314.3 | 106.6 | 135.8 | 118.3 | 233.7 | 307.3 | 264.9 | 180.4 | 235.8 | 202.2 | |||
| Fertilisers | 55.5 | 66.3 | 56.8 | 50.5 | 65.0 | 58.9 | 83.4 | 96.7 | 92.8 | 88.7 | 94.6 | 104.1 | |||
| FISIM1 | 16.8 | 12.8 | 10.1 | 8.5 | 5.9 | 4.3 | 19.9 | 16.0 | 13.1 | 31.1 | 23.8 | 18.5 | |||
| Seeds | 5.5 | 5.9 | 5.6 | 5.8 | 6.4 | 5.6 | 8.7 | 10.4 | 9.8 | 14.3 | 15.5 | 18.9 | |||
| Maintenance and repairs | 54.9 | 66.0 | 64.5 | 56.2 | 49.3 | 60.7 | 85.0 | 91.2 | 93.8 | 70.2 | 67.2 | 69.7 | |||
| Other goods and services | 59.1 | 61.3 | 59.2 | 52.7 | 55.5 | 63.8 | 91.8 | 91.5 | 97.1 | 83.2 | 78.2 | 91.0 | |||
| Crop protection products | 3.3 | 3.0 | 2.9 | 2.4 | 2.3 | 2.5 | 7.0 | 5.2 | 5.5 | 23.2 | 16.9 | 18.8 | |||
| Veterinary expenses | 35.1 | 38.2 | 37.0 | 37.4 | 40.6 | 39.9 | 53.4 | 54.9 | 57.0 | 45.3 | 43.8 | 44.2 | |||
| Energy and lubricants | 56.5 | 62.8 | 62.3 | 46.0 | 57.2 | 58.4 | 69.2 | 76.1 | 78.5 | 53.7 | 53.4 | 55.6 | |||
| Forage plants | 116.0 | 138.1 | 110.1 | 144.9 | 171.4 | 137.3 | 175.9 | 223.6 | 180.9 | 174.8 | 206.2 | 161.2 | |||
| Contract work | 45.5 | 59.4 | 57.0 | 44.9 | 61.4 | 59.2 | 66.3 | 74.4 | 78.7 | 57.4 | 62.8 | 69.0 | |||
| Gross value added at basic prices | 340.5 | 255.7 | 326.8 | 266.5 | 189.2 | 213.0 | 529.1 | 431.1 | 452.7 | 519.7 | 478.3 | 502.7 | |||
| Fixed capital consumption | 86.6 | 91.5 | 95.9 | 43.7 | 42.6 | 40.8 | 103.0 | 114.6 | 124.4 | 160.7 | 170.8 | 174.9 | |||
| Net value added at basic prices | 253.9 | 164.1 | 230.9 | 222.8 | 146.6 | 172.2 | 426.1 | 316.4 | 328.3 | 359.0 | 307.5 | 327.8 | |||
| Other subsidies less taxes on production | 259.4 | 284.4 | 283.6 | 311.4 | 334.2 | 331.4 | 256.9 | 273.6 | 267.8 | 199.5 | 212.5 | 203.0 | |||
| Factor income | 513.4 | 448.6 | 514.5 | 534.2 | 480.8 | 503.6 | 683.0 | 590.1 | 596.1 | 558.5 | 520.0 | 530.9 | |||
| Compensation of employees | 72.4 | 78.2 | 80.7 | 82.0 | 88.6 | 91.5 | 81.0 | 87.5 | 90.3 | 74.2 | 80.1 | 82.7 | |||
| Operating surplus2 | 441.0 | 370.4 | 433.8 | 452.1 | 392.2 | 412.2 | 602.0 | 502.6 | 505.8 | 484.4 | 439.9 | 448.1 | |||
| Table 1b Regional Agricultural Accounts at NUTS 3 level, 2017 - 2019 | €m | ||||||||||||||
| Description | South-West | Dublin & Mid-East | Midland | State | |||||||||||
| 2017 | 2018 | 2019 | 2017 | 2018 | 2019 | 2017 | 2018 | 2019 | 2017 | 2018 | 2019 | ||||
| Livestock | 599.6 | 556.2 | 552.7 | 423.4 | 420.4 | 392.9 | 434.3 | 419.7 | 411.6 | 3,592.4 | 3,453.7 | 3,380.7 | |||
| Cattle | 396.2 | 381.1 | 361.3 | 242.6 | 235.2 | 220.5 | 306.1 | 295.8 | 279.7 | 2,362.1 | 2,262.2 | 2,151.1 | |||
| Pigs | 104.1 | 87.8 | 109.7 | 31.9 | 27.4 | 34.1 | 88.3 | 84.0 | 96.9 | 516.8 | 459.1 | 543.0 | |||
| Sheep | 36.7 | 36.3 | 36.6 | 40.0 | 38.8 | 38.0 | 16.4 | 15.8 | 15.6 | 262.9 | 258.8 | 260.8 | |||
| Horses | 46.6 | 34.5 | 28.5 | 99.3 | 109.1 | 90.3 | 21.9 | 22.6 | 17.8 | 287.4 | 306.4 | 255.5 | |||
| Poultry | 16.0 | 16.4 | 16.7 | 9.6 | 9.8 | 10.0 | 1.6 | 1.6 | 1.7 | 163.1 | 167.3 | 170.4 | |||
| Livestock products | 876.4 | 850.9 | 839.4 | 240.2 | 239.5 | 252.1 | 200.5 | 198.5 | 213.3 | 2,668.7 | 2,639.2 | 2,683.0 | |||
| Milk | 863.3 | 836.5 | 825.2 | 228.8 | 226.8 | 239.6 | 198.8 | 196.6 | 211.6 | 2,594.1 | 2,556.7 | 2,601.9 | |||
| Other livestock products | 13.1 | 14.4 | 14.2 | 11.4 | 12.8 | 12.5 | 1.7 | 1.9 | 1.8 | 74.6 | 82.6 | 81.2 | |||
| Crops | 281.5 | 331.1 | 296.7 | 424.2 | 479.9 | 450.2 | 166.7 | 204.3 | 172.9 | 1,824.6 | 2,126.0 | 1,897.1 | |||
| Cereals | 32.9 | 40.5 | 45.0 | 88.2 | 104.9 | 111.4 | 25.0 | 31.8 | 33.3 | 237.2 | 288.4 | 314.7 | |||
| Potatoes | 11.5 | 13.6 | 14.6 | 69.8 | 70.4 | 82.1 | 2.2 | 2.5 | 3.1 | 126.5 | 139.3 | 156.5 | |||
| Forage plants | 202.7 | 247.7 | 204.5 | 162.9 | 193.3 | 146.1 | 126.1 | 154.4 | 120.3 | 1,105.7 | 1,340.3 | 1,064.0 | |||
| Fresh vegetables | 9.8 | 7.5 | 9.8 | 65.8 | 72.3 | 68.4 | 8.2 | 9.0 | 9.5 | 221.5 | 226.2 | 224.7 | |||
| Fresh fruit | 7.6 | 7.0 | 7.6 | 21.6 | 20.3 | 22.2 | 3.2 | 3.1 | 3.3 | 54.4 | 51.3 | 55.1 | |||
| Other crops | 17.1 | 14.7 | 15.1 | 15.9 | 18.8 | 20.0 | 2.1 | 3.5 | 3.3 | 79.2 | 80.5 | 82.3 | |||
| Goods output at producer prices | 1,757.4 | 1,738.1 | 1,688.8 | 1,087.8 | 1,139.9 | 1,095.2 | 801.6 | 822.5 | 797.9 | 8,085.7 | 8,218.9 | 7,960.9 | |||
| Contract work | 77.1 | 97.8 | 93.6 | 49.7 | 54.2 | 56.8 | 38.9 | 43.4 | 47.1 | 379.7 | 453.2 | 461.2 | |||
| Subsidies on products less taxes on products | -3.6 | -3.3 | 7.2 | 1.5 | 1.7 | 11.2 | 1.1 | 1.2 | 15.0 | 11.0 | 13.9 | 99.5 | |||
| Agricultural output at basic prices | 1,830.9 | 1,832.7 | 1,789.5 | 1,139.0 | 1,195.8 | 1,163.2 | 841.6 | 867.0 | 860.0 | 8,476.4 | 8,686.0 | 8,521.7 | |||
| Intermediate consumption | 1,032.2 | 1,194.3 | 1,103.4 | 676.1 | 735.4 | 698.0 | 600.4 | 672.2 | 632.6 | 5,317.9 | 6,038.2 | 5,647.7 | |||
| Feedingstuffs | 268.4 | 350.3 | 309.1 | 111.7 | 143.9 | 126.0 | 134.8 | 175.3 | 155.1 | 1,324.3 | 1,674.6 | 1,489.9 | |||
| Fertilisers | 105.5 | 117.2 | 114.4 | 74.3 | 78.2 | 85.8 | 55.0 | 64.1 | 65.6 | 513.0 | 582.1 | 578.3 | |||
| FISIM1 | 29.4 | 22.5 | 18.0 | 32.3 | 25.4 | 20.7 | 26.5 | 20.7 | 17.7 | 164.5 | 127.0 | 102.4 | |||
| Seeds | 11.3 | 12.7 | 14.0 | 15.6 | 16.4 | 24.2 | 6.4 | 7.3 | 7.7 | 67.4 | 74.6 | 85.6 | |||
| Maintenance and repairs | 92.5 | 91.9 | 86.7 | 65.2 | 57.8 | 60.7 | 49.5 | 50.6 | 53.9 | 473.5 | 474.0 | 489.9 | |||
| Other goods and services | 107.3 | 109.3 | 114.5 | 56.2 | 58.3 | 60.9 | 67.3 | 60.8 | 66.0 | 517.7 | 514.9 | 552.5 | |||
| Crop protection products | 5.7 | 7.5 | 8.1 | 29.8 | 29.3 | 32.4 | 11.2 | 9.1 | 10.5 | 82.6 | 73.3 | 80.7 | |||
| Veterinary expenses | 67.3 | 67.0 | 65.0 | 31.6 | 30.1 | 32.1 | 33.0 | 34.0 | 33.9 | 303.0 | 308.5 | 309.2 | |||
| Energy and lubricants | 65.2 | 71.2 | 76.1 | 47.3 | 49.7 | 53.3 | 52.3 | 53.6 | 55.5 | 390.2 | 424.1 | 439.6 | |||
| Forage plants | 202.3 | 247.0 | 204.0 | 162.4 | 192.2 | 145.3 | 125.6 | 153.4 | 119.6 | 1,101.9 | 1,331.8 | 1,058.4 | |||
| Contract work | 77.1 | 97.8 | 93.6 | 49.7 | 54.2 | 56.8 | 38.9 | 43.4 | 47.1 | 379.7 | 453.2 | 461.2 | |||
| Gross value added at basic prices | 798.7 | 638.3 | 686.2 | 462.9 | 460.4 | 465.2 | 241.2 | 194.9 | 227.4 | 3,158.5 | 2,647.8 | 2,874.0 | |||
| Fixed capital consumption | 152.0 | 161.4 | 170.3 | 166.8 | 182.1 | 195.9 | 136.6 | 148.8 | 167.9 | 849.3 | 911.8 | 970.1 | |||
| Net value added at basic prices | 646.7 | 476.9 | 515.8 | 296.1 | 278.3 | 269.3 | 104.6 | 46.1 | 59.5 | 2,309.2 | 1,736.0 | 1,903.9 | |||
| Other subsidies less taxes on production | 296.1 | 324.7 | 317.2 | 160.4 | 178.2 | 170.0 | 154.8 | 168.6 | 164.5 | 1,638.5 | 1,776.2 | 1,737.6 | |||
| Factor income | 942.7 | 801.6 | 833.0 | 456.5 | 456.5 | 439.2 | 259.4 | 214.7 | 224.1 | 3,947.7 | 3,512.3 | 3,641.5 | |||
| Compensation of employees | 91.2 | 98.5 | 101.7 | 78.0 | 84.2 | 87.0 | 46.9 | 50.6 | 52.3 | 525.6 | 567.7 | 586.2 | |||
| Operating surplus2 | 851.5 | 703.1 | 731.3 | 378.5 | 372.3 | 352.3 | 212.6 | 164.0 | 171.8 | 3,422.0 | 2,944.5 | 3,055.2 | |||
| 1 FISIM: Financial Intermediation Services Indirectly Measured. | |||||||||||||||
| 2 This is calculated before deduction of interest payments on borrowed capital and land rental paid by farmers to landowners. | |||||||||||||||
| Table 2 Regional Distribution of Agricultural Output, Input and Income, 2019 | €m | ||||||||
| Region | Livestock | Livestock Products | Crops | Goods Output at Producer Prices | Agricultural Output at Basic Prices | Intermediate Consumption | Gross Value Added at Basic Prices | Net Subsidies 1 | Operating Surplus |
| Northern and Western | 1,044.4 | 344.5 | 381.6 | 1,770.6 | 1,928.4 | 1,388.6 | 539.8 | 656.8 | 846.0 |
| % of State total | 30.9 | 12.8 | 20.1 | 22.2 | 22.6 | 24.6 | 18.8 | 35.7 | 27.7 |
| Border | 581.8 | 226.9 | 223.8 | 1,032.5 | 1,106.7 | 779.8 | 326.8 | 300.8 | 433.8 |
| % of State total | 17.2 | 8.5 | 11.8 | 13.0 | 13.0 | 13.8 | 11.4 | 16.4 | 14.2 |
| West | 462.6 | 117.6 | 157.8 | 738.1 | 821.8 | 608.8 | 213.0 | 356.0 | 412.2 |
| % of State total | 13.7 | 4.4 | 8.3 | 9.3 | 9.6 | 10.8 | 7.4 | 19.4 | 13.5 |
| Southern | 1,531.8 | 1,873.0 | 892.4 | 4,297.3 | 4,570.0 | 2,928.5 | 1,641.5 | 819.6 | 1,685.2 |
| % of State total | 45.3 | 69.8 | 47.0 | 54.0 | 53.6 | 51.9 | 57.1 | 44.6 | 55.2 |
| Mid-West | 553.8 | 547.5 | 231.1 | 1,332.4 | 1,424.9 | 972.2 | 452.7 | 281.6 | 505.8 |
| % of State total | 16.4 | 20.4 | 12.2 | 16.7 | 16.7 | 17.2 | 15.8 | 15.3 | 16.6 |
| South-East | 425.4 | 486.1 | 364.6 | 1,276.1 | 1,355.6 | 853.0 | 502.7 | 213.6 | 448.1 |
| % of State total | 12.6 | 18.1 | 19.2 | 16.0 | 15.9 | 15.1 | 17.5 | 11.6 | 14.7 |
| South-West | 552.7 | 839.4 | 296.7 | 1,688.8 | 1,789.5 | 1,103.4 | 686.2 | 324.4 | 731.3 |
| % of State total | 16.3 | 31.3 | 15.6 | 21.2 | 21.0 | 19.5 | 23.9 | 17.7 | 23.9 |
| Eastern and Midland | 804.5 | 465.5 | 623.1 | 1,893.1 | 2,023.2 | 1,330.6 | 692.6 | 360.7 | 524.1 |
| % of State total | 23.8 | 17.3 | 32.8 | 23.8 | 23.7 | 23.6 | 24.1 | 19.6 | 17.2 |
| Dublin & Mid-East | 392.9 | 252.1 | 450.2 | 1,095.2 | 1,163.2 | 698.0 | 465.2 | 181.2 | 352.3 |
| % of State total | 11.6 | 9.4 | 23.7 | 13.8 | 13.7 | 12.4 | 16.2 | 9.9 | 11.5 |
| Midland | 411.6 | 213.3 | 172.9 | 797.9 | 860.0 | 632.6 | 227.4 | 179.6 | 171.8 |
| % of State total | 12.2 | 8.0 | 9.1 | 10.0 | 10.1 | 11.2 | 7.9 | 9.8 | 5.6 |
| State | 3,380.7 | 2,683.0 | 1,897.1 | 7,960.9 | 8,521.7 | 5,647.7 | 2,874.0 | 1,837.1 | 3,055.2 |
| 1 Net subsidies: Subsidies on products less taxes on products plus subsidies on production less taxes on production. | |||||||||
| Table 3 Net Subsidies1 and Operating Surplus by Region, 2017 - 2019 | €m | ||
| Region | 2017 | 2018 | 2019 |
| Northern and Western | |||
| Net subsidies | 584.7 | 634.5 | 656.8 |
| Operating surplus | 893.1 | 762.6 | 846.0 |
| Net subsidies as a % of operating surplus | 65.5 | 83.2 | 77.6 |
| Border | |||
| Net subsidies | 264.3 | 290.2 | 300.8 |
| Operating surplus | 441.0 | 370.4 | 433.8 |
| Net subsidies as a % of operating surplus | 59.9 | 78.3 | 69.3 |
| West | |||
| Net subsidies | 320.4 | 344.3 | 356.0 |
| Operating surplus | 452.1 | 392.2 | 412.2 |
| Net subsidies as a % of operating surplus | 70.9 | 87.8 | 86.4 |
| Southern | |||
| Net subsidies | 747.0 | 805.8 | 819.6 |
| Operating surplus | 1,937.9 | 1,645.6 | 1,685.2 |
| Net subsidies as a % of operating surplus | 38.5 | 49.0 | 48.6 |
| Mid-West | |||
| Net subsidies | 255.8 | 272.7 | 281.6 |
| Operating surplus | 602.0 | 502.6 | 505.8 |
| Net subsidies as a % of operating surplus | 42.5 | 54.3 | 55.7 |
| South-East | |||
| Net subsidies | 198.7 | 211.6 | 213.6 |
| Operating surplus | 484.4 | 439.9 | 448.1 |
| Net subsidies as a % of operating surplus | 41.0 | 48.1 | 47.7 |
| South-West | |||
| Net subsidies | 292.4 | 321.4 | 324.4 |
| Operating surplus | 851.5 | 703.1 | 731.3 |
| Net subsidies as a % of operating surplus | 34.3 | 45.7 | 44.4 |
| Eastern and Midland | |||
| Net subsidies | 317.9 | 349.7 | 360.7 |
| Operating surplus | 591.1 | 536.3 | 524.1 |
| Net subsidies as a % of operating surplus | 53.8 | 65.2 | 68.8 |
| Dublin & Mid-East | |||
| Net subsidies | 161.9 | 180.0 | 181.2 |
| Operating surplus | 378.5 | 372.3 | 352.3 |
| Net subsidies as a % of operating surplus | 42.8 | 48.3 | 51.4 |
| Midland | |||
| Net subsidies | 155.9 | 169.8 | 179.6 |
| Operating surplus | 212.6 | 164.0 | 171.8 |
| Net subsidies as a % of operating surplus | 73.4 | 103.5 | 104.5 |
| State | |||
| Net subsidies | 1,649.5 | 1,790.1 | 1,837.1 |
| Operating surplus | 3,422.0 | 2,944.5 | 3,055.2 |
| Net subsidies as a % of operating surplus | 48.2 | 60.8 | 60.1 |
| 1 Net subsidies: Subsidies on products less taxes on products plus subsidies on production less taxes on production. | |||
The Regional Accounts for Agriculture release provides a regional breakdown of figures already published at State level in the Output, Input and Income in Agriculture – Final Estimate release. Both publications are prepared using similar methodology and definitions of the accounts items, which are described in the Background Notes of the Output, Input and Income in Agriculture release.
In the absence of the actual regional value data, the values of output and input accounts items at State level are apportioned to each region using a set of appropriate allocators. Derived variables, such as Gross Value Added at basic prices (GVA) or Operating surplus are then calculated separately for each region. For example:
GVA at basic prices = Agricultural output at basic prices – Intermediate consumption
Operating surplus = GVA at basic prices – Compensation of employees
– Fixed capital consumption
+ Other subsidies less taxes on production
The choice of allocator used to distribute State values to the regions varies for each accounts item. It is, in general, the factor that mainly determines the value of the item. For example, for cattle output the allocator is the total number of cattle less number of dairy cows in each region; for pigs and sheep output it is the number of pigs and sheep in December of the reference year; for milk output it is the number of dairy cows times the average output per cow in the region etc.
Most of the items of intermediate consumption, such as expenditure on fertilisers, crop protection products, energy and lubricants, maintenance and repairs, veterinary expenses and expenditure on other goods and services, are allocated based on the total expenditures in each region as measured by the National Farm Survey conducted annually by Teagasc.
Due to the indirect nature of the methodology described above more reliance should be placed on the changes between years rather than on the absolute value of the figures for any one year.
The regional results presented in this release relate to each region as a whole. Thus, the regional values of the accounts items, including operating surplus, are not necessarily spread uniformly throughout the region.
Individual figures have been rounded independently and therefore the component items may not add to the totals shown or, in the case of percentages, to 100%.
Unless otherwise stated, all references to agricultural output in the text, maps and figures contained in this release relate to agricultural output at basic prices.
The regional classifications in this release are based on the common classification of territorial units for statistics established by the Commission Regulation (EU) No 2066 of 2016 (NUTS - Nomenclature of Territorial Units).
The NUTS 3 regions correspond to the eight Regional Authorities established under the Local Government Act, 1991 (Regional Authorities) (Establishment) Order, 1993, and amended by the Local Government Reform Act 2014. The NUTS 2 regions are groupings of the NUTS 3 regions.
The composition of the regions is set out below:
|
NUTS 2 Region |
NUTS 3 Region |
Constituting Counties |
|
Northern and Western |
Border |
Cavan, Donegal, Leitrim, Monaghan, Sligo |
|
West |
Galway, Mayo, Roscommon |
|
|
Southern |
Mid-West |
Clare, Limerick, Tipperary |
|
South-East |
Carlow, Kilkenny, Waterford, Wexford |
|
|
South-West |
Cork, Kerry |
|
|
Eastern and Midland |
Dublin |
Dublin |
|
Mid-East |
Kildare, Louth, Meath, Wicklow |
|
|
Midland |
Laois, Longford, Offaly, Westmeath |
 Hide Background Notes
Scan the QR code below to view this release online or go to
http://www.cso.ie/en/releasesandpublications/er/raa/regionalaccountsforagriculture2019/
 Show Table 1 Regional Agriculture Accounts at NUTS 3 level, 2017 - 2019
 Hide Table 1 Regional Agriculture Accounts at NUTS 3 level, 2017 - 2019