
| Region | Net Subsidies | Operating Surplus | Net Subsidies as a % of Operating Surplus |
| €m | €m | % | |
| Border | 262.9 | 452.0 | 58.2 |
| West | 319.2 | 455.1 | 70.1 |
| Northern and Western | 582.1 | 907.1 | 64.2 |
| Mid-West | 253.8 | 612.2 | 41.5 |
| South-East | 196.6 | 486.1 | 40.5 |
| South-West | 289.2 | 855.2 | 33.8 |
| Southern | 739.6 | 1,953.5 | 37.9 |
| Dublin and Mid-East | 160.1 | 378.7 | 42.3 |
| Midland | 155.0 | 217.7 | 71.2 |
| Eastern and Midland | 315.0 | 596.3 | 52.8 |
| State | 1,636.7 | 3,456.9 | 47.3 |
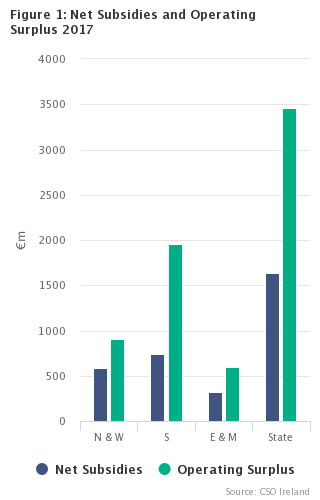
In 2017, net subsidies accounted for 47.3% of agricultural income (operating surplus) at State level. In the Northern and Western region, net subsidies accounted for 64.2% of agricultural income, in the Southern region net subsidies accounted for 37.9% of agricultural income and in the Eastern and Midland region net subsidies amounted to 52.8% of agricultural income. See above table, graph and Table 3.
An analysis of agriculture in the regions in the year 2017 shows that:
| Northern & Western | Southern | Eastern & Midland | |
| Operating surplus | 26.2400826781553 | 56.5090680623513 | 17.2508492594933 |
| Net subsidies | 35.5634605775357 | 45.1876197260121 | 19.2489196964522 |
| Intermediate consumption | 24.1515416636272 | 51.8160897449703 | 24.0323685914025 |
| Goods output at producer prices | 22.1681811231671 | 54.5076737316643 | 23.3241451451686 |
| Cereals | 2.98960021571188 | 49.3001550956713 | 47.7102446886168 |
| Potatoes | 9.99842789657189 | 33.0875382321507 | 56.9140338712774 |
| Milk | 11.2743674125809 | 72.241820508259 | 16.4838120791601 |
| Sheep | 50.2939066799996 | 28.2522661841412 | 21.4538271358592 |
| Pigs | 26.6481717380624 | 50.0918176121537 | 23.2600106497839 |
| Cattle | 27.0188849383331 | 49.7517624486769 | 23.22935261299 |
| Number of farms | 42.4503074503074 | 39.7826397826398 | 17.7670527670528 |
| Agriculture area (excluding commonage) | 33.0168848865973 | 46.0639212000688 | 20.9191501394854 |
| Table 1 Regional Agricultural Accounts at NUTS 2 level 2016-2017 | |||||||||||
| Item | Northern and Western | Southern | Eastern and Midland | State | |||||||
| 2016 | 2017 | 2016 | 2017 | 2016 | 2017 | 2016 | 2017 | ||||
| Livestock | 1,028.2 | 1,077.4 | 1,602.9 | 1,663.3 | 808.5 | 849.3 | 3,439.6 | 3,590.1 | |||
| of which: | |||||||||||
| cattle | 630.1 | 638.0 | 1,137.4 | 1,174.8 | 521.5 | 548.5 | 2,288.9 | 2,361.4 | |||
| pigs | 124.1 | 137.4 | 223.2 | 258.3 | 117.9 | 119.9 | 465.2 | 515.6 | |||
| sheep | 127.4 | 132.1 | 72.3 | 74.2 | 55.7 | 56.3 | 255.4 | 262.6 | |||
| Livestock products | 242.4 | 334.7 | 1,310.9 | 1,891.4 | 304.6 | 440.3 | 1,857.8 | 2,666.4 | |||
| of which: | |||||||||||
| milk | 203.4 | 292.2 | 1,294.3 | 1,872.3 | 293.1 | 427.2 | 1,790.8 | 2,591.7 | |||
| Crops | 378.4 | 373.8 | 817.4 | 836.6 | 570.8 | 589.5 | 1,766.7 | 1,799.9 | |||
| of which: | |||||||||||
| cereals | 6.3 | 7.1 | 115.2 | 117.0 | 109.3 | 113.2 | 230.8 | 237.2 | |||
| potatoes | 15.9 | 12.6 | 43.9 | 41.8 | 75.5 | 72.0 | 135.3 | 126.5 | |||
| forage plants - output | 244.9 | 245.7 | 535.4 | 547.8 | 269.1 | 287.6 | 1,049.4 | 1,081.0 | |||
| Goods output at producer prices | 1,649.0 | 1,785.9 | 3,731.2 | 4,391.3 | 1,683.9 | 1,879.1 | 7,064.1 | 8,056.3 | |||
| Contract work - output | 83.8 | 89.6 | 194.0 | 199.0 | 83.7 | 87.8 | 361.5 | 376.4 | |||
| Subsidies on products less taxes on products | 10.7 | 13.9 | -5.2 | -5.5 | 1.6 | 2.6 | 7.1 | 11.0 | |||
| Agricultural output at basic prices | 1,743.5 | 1,889.4 | 3,920.0 | 4,584.9 | 1,769.2 | 1,969.5 | 7,432.7 | 8,443.7 | |||
| Intermediate consumption | 1,234.4 | 1,268.6 | 2,635.0 | 2,721.7 | 1,205.5 | 1,262.3 | 5,074.8 | 5,252.7 | |||
| of which: | |||||||||||
| feedingstuffs | 381.3 | 396.4 | 620.1 | 684.7 | 227.4 | 247.5 | 1,228.7 | 1,328.6 | |||
| fertilisers | 96.2 | 106.0 | 287.0 | 277.6 | 127.6 | 129.4 | 510.8 | 513.0 | |||
| maintenance & repairs | 114.8 | 109.4 | 231.0 | 243.8 | 114.2 | 112.9 | 460.0 | 466.1 | |||
| veterinary expenses | 72.1 | 68.4 | 153.1 | 156.6 | 60.3 | 60.9 | 285.5 | 286.0 | |||
| energy and lubricants | 96.2 | 101.8 | 182.6 | 186.9 | 96.5 | 98.9 | 375.4 | 387.7 | |||
| forage plants - consumption | 244.1 | 244.5 | 533.9 | 546.2 | 268.4 | 286.5 | 1,046.3 | 1,077.2 | |||
| contract work - expenditure | 83.8 | 89.6 | 194.0 | 199.0 | 83.7 | 87.8 | 361.5 | 376.4 | |||
| Gross value added at basic prices | 509.1 | 620.8 | 1,285.0 | 1,863.1 | 563.8 | 707.2 | 2,357.9 | 3,191.1 | |||
| Fixed capital consumption | 114.8 | 128.6 | 412.4 | 410.1 | 281.9 | 299.3 | 809.0 | 837.9 | |||
| Net value added at basic prices | 394.4 | 492.2 | 872.7 | 1,453.1 | 281.9 | 407.9 | 1,548.9 | 2,353.2 | |||
| Other subsidies less taxes on production | 541.9 | 568.2 | 744.4 | 745.1 | 314.4 | 312.4 | 1,600.7 | 1,625.7 | |||
| Factor income | 936.2 | 1,060.4 | 1,617.0 | 2,198.1 | 596.3 | 720.3 | 3,149.6 | 3,978.8 | |||
| Compensation of employees | 149.5 | 153.3 | 238.5 | 244.7 | 120.9 | 124.0 | 508.9 | 521.9 | |||
| Operating surplus 1 | 786.8 | 907.1 | 1,378.5 | 1,953.5 | 475.5 | 596.3 | 2,640.7 | 3,456.9 | |||
| 1 This is calculated before deduction of interest payments on borrowed capital and land rental paid by farmers to landowners. | |||||||||||
| Table 2 Regional Agricultural Accounts at NUTS 3 level 2017 | ||||||||
| Item | Livestock | Livestock Products | Crops | Goods Output at producer prices | Intermediate Consumption | Gross Value Added at basic prices | Net Subsidies 1 | Operating Surplus |
| Region | ||||||||
| Border | ||||||||
| Value €m | 588.2 | 221.4 | 218.8 | 1,028.4 | 727.0 | 351.3 | 262.9 | 452.0 |
| % of State total | 16.4 | 8.3 | 12.2 | 12.8 | 13.8 | 11.0 | 16.1 | 13.1 |
| West | ||||||||
| Value €m | 489.3 | 113.3 | 155.0 | 757.5 | 541.6 | 269.5 | 319.2 | 455.1 |
| % of State total | 13.6 | 4.2 | 8.6 | 9.4 | 10.3 | 8.4 | 19.5 | 13.2 |
| Northern and Western (value €m) | 1,077.4 | 334.7 | 373.8 | 1,785.9 | 1,268.6 | 620.8 | 582.1 | 907.1 |
| Mid-West | ||||||||
| Value €m | 595.9 | 546.6 | 206.4 | 1,348.9 | 874.3 | 539.3 | 253.8 | 612.2 |
| % of State total | 16.6 | 20.5 | 11.5 | 16.7 | 16.6 | 16.9 | 15.5 | 17.7 |
| South-East | ||||||||
| Value €m | 468.2 | 469.2 | 336.3 | 1,273.7 | 809.0 | 520.8 | 196.6 | 486.1 |
| % of State total | 13.0 | 17.6 | 18.7 | 15.8 | 15.4 | 16.3 | 12.0 | 14.1 |
| South-West | ||||||||
| Value €m | 599.2 | 875.6 | 293.9 | 1,768.7 | 1,038.5 | 803.0 | 289.2 | 855.2 |
| % of State total | 16.7 | 32.8 | 16.3 | 22.0 | 19.8 | 25.2 | 17.7 | 24.7 |
| Southern (value €m) | 1,663.3 | 1,891.4 | 836.6 | 4,391.3 | 2,721.7 | 1,863.1 | 739.6 | 1,953.5 |
| Dublin and Mid-East | ||||||||
| Value €m | 415.3 | 240.0 | 423.5 | 1,078.8 | 667.4 | 462.1 | 160.1 | 378.7 |
| % of State total | 11.6 | 9.0 | 23.5 | 13.4 | 12.7 | 14.5 | 9.8 | 11.0 |
| Midland | ||||||||
| Value €m | 434.0 | 200.3 | 166.0 | 800.3 | 594.9 | 245.0 | 155.0 | 217.7 |
| % of State total | 12.1 | 7.5 | 9.2 | 9.9 | 11.3 | 7.7 | 9.5 | 6.3 |
| Eastern and Midland (value €m) | 849.3 | 440.3 | 589.5 | 1,879.1 | 1,262.3 | 707.2 | 315.0 | 596.3 |
| State (value €m) | 3,590.1 | 2,666.4 | 1,799.9 | 8,056.3 | 5,252.7 | 3,191.1 | 1,636.7 | 3,456.9 |
| 1 Net subsidies: Subsidies on products less taxes on products plus subsidies on production less taxes on production. | ||||||||
| Table 3 Net Subsidies1 and Operating Surplus by Region | €m | ||
| Region | 2015 | 2016 | 2017 |
| Border | |||
| Net subsidies | 213.9 | 250.9 | 262.9 |
| Operating surplus | 389.2 | 401.4 | 452.0 |
| Net subsidies as a % of operating surplus | 54.9 | 62.5 | 58.2 |
| West | |||
| Net subsidies | 258.6 | 301.7 | 319.2 |
| Operating surplus | 393.7 | 385.3 | 455.1 |
| Net subsidies as a % of operating surplus | 65.7 | 78.3 | 70.1 |
| Northern and Western (value €m) | |||
| Net subsidies | 472.4 | 552.6 | 582.1 |
| Operating surplus | 782.9 | 786.8 | 907.1 |
| Net subsidies as a % of operating surplus | 60.3 | 70.2 | 64.2 |
| Mid-West | |||
| Net subsidies | 205.4 | 250.9 | 253.8 |
| Operating surplus | 432.2 | 449.8 | 612.2 |
| Net subsidies as a % of operating surplus | 47.5 | 55.8 | 41.5 |
| South-East | |||
| Net subsidies | 162.7 | 202.6 | 196.6 |
| Operating surplus | 327.8 | 311.4 | 486.1 |
| Net subsidies as a % of operating surplus | 49.6 | 65.0 | 40.5 |
| South-West | |||
| Net subsidies | 227.7 | 285.7 | 289.2 |
| Operating surplus | 591.4 | 617.2 | 855.2 |
| Net subsidies as a % of operating surplus | 38.5 | 46.3 | 33.8 |
| Southern (value €m) | |||
| Net subsidies | 595.8 | 739.2 | 739.6 |
| Operating surplus | 1,351.5 | 1,378.5 | 1,953.5 |
| Net subsidies as a % of operating surplus | 44.1 | 53.6 | 37.9 |
| Dublin and Mid-East | |||
| Net subsidies | 134.2 | 160.2 | 160.1 |
| Operating surplus | 293.1 | 298.3 | 378.7 |
| Net subsidies as a % of operating surplus | 45.8 | 53.7 | 42.3 |
| Midland | |||
| Net subsidies | 130.8 | 155.8 | 155.0 |
| Operating surplus | 159.9 | 177.1 | 217.7 |
| Net subsidies as a % of operating surplus | 81.8 | 88.0 | 71.2 |
| Eastern and Midland (value €m) | |||
| Net subsidies | 265.0 | 316.0 | 315.0 |
| Operating surplus | 453.0 | 475.5 | 596.3 |
| Net subsidies as a % of operating surplus | 58.5 | 66.5 | 52.8 |
| State (value €m) | |||
| Net subsidies | 1,333.3 | 1,607.8 | 1,636.7 |
| Operating surplus | 2,587.3 | 2,640.7 | 3,456.9 |
| Net subsidies as a % of operating surplus | 51.5 | 60.9 | 47.3 |
| 1 Net subsidies: Subsidies on products less taxes on products plus subsidies on production less taxes on production. | |||
The Regional Accounts for Agriculture release provides a regional breakdown of figures already published at State level in the Output, Input and Income in Agriculture – Final Estimate release. Both publications are prepared using similar methodology and definitions of the accounts items, which are described in the Background Notes of the Output, Input and Income in Agriculture release.
In the absence of the actual regional value data, the values of output and input accounts items at State level are apportioned to each region using a set of appropriate allocators. Derived variables, such as Gross Value Added at basic prices (GVA) or Operating surplus are then calculated separately for each region. For example:
GVA at basic prices = Agricultural output at basic prices – Intermediate consumption
Operating surplus = GVA at basic prices – Compensation of employees
– Fixed capital consumption
+ Other subsidies less taxes on production
The choice of allocator used to distribute State values to the regions varies for each accounts item. It is, in general, the factor that mainly determines the value of the item. For example, for cattle output the allocator is the total number of cattle less number of dairy cows in each region; for pigs and sheep output it is the number of pigs and sheep in December of the reference year; for milk output it is the number of dairy cows times the average output per cow in the region etc.
Most of the items of intermediate consumption, such as expenditure on fertilisers, crop protection products, energy and lubricants, maintenance and repairs, veterinary expenses and expenditure on other goods and services, are allocated based on the total expenditures in each region as measured by the National Farm Survey conducted annually by Teagasc.
Due to the indirect nature of the methodology described above more reliance should be placed on the changes between years rather than on the absolute value of the figures for any one year.
The regional results presented in this release relate to each region as a whole. Thus, the regional values of the accounts items, including operating surplus, are not necessarily spread uniformly throughout the region.
The regional classifications in this release are based on the common classification of territorial units for statistics established by the Commission Regulation (EU) No 2066 of 2016 (NUTS - Nomenclature of Territorial Units).
The NUTS 3 regions correspond to the eight Regional Authorities established under the Local Government Act, 1991 (Regional Authorities) (Establishment) Order, 1993, and amended by the Local Government Reform Act 2014. The NUTS 2 regions are groupings of the NUTS 3 regions.
The composition of the regions is set out below:
|
NUTS 2 Region |
NUTS 3 Region |
Constituting Counties |
|
Northern and Western |
Border |
Cavan, Donegal, Leitrim, Monaghan, Sligo |
|
West |
Galway, Mayo, Roscommon |
|
|
Southern |
Mid-West |
Clare, Limerick, Tipperary |
|
South-East |
Carlow, Kilkenny, Waterford, Wexford |
|
|
South-West |
Cork, Kerry |
|
|
Eastern and Midland |
Dublin |
Dublin |
|
Mid-East |
Kildare, Louth, Meath, Wicklow |
|
|
Midland |
Laois, Longford, Offaly, Westmeath |
 Hide Background Notes
Scan the QR code below to view this release online or go to
http://www.cso.ie/en/releasesandpublications/er/raa/regionalaccountsforagriculture2017/
 Show Table 1 Regional Agriculture Accounts at NUTS 2 level 2016-2017
 Hide Table 1 Regional Agriculture Accounts at NUTS 2 level 2016-2017