
LFS estimates were updated on 22nd Feb 2024 to incorporate updated population estimates for the period 2016 Q3 to 2023 Q3, based on the results of Census 2022. LFS results are updated in this way following each Census of Population. For further information see Background Notes.
The data in this publication does not reflect these updates. Please refer to the relevant tables on LFS Px-stat for updated LFS estimates.
| Indicator | Quarter 2 2017 | Annual change |
| Employed | 2,063,000 | +48,100 |
| Unemployed | 141,500 | -46,300 |
| In labour force | 2,204,500 | +1,800 |
| Not in labour force | 1,477,400 | +42,500 |
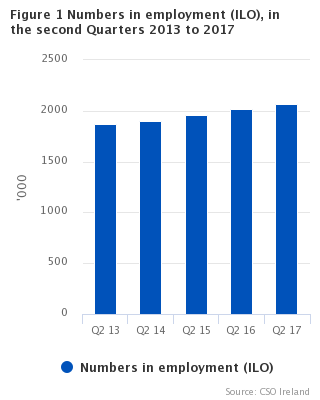
There was an annual increase in employment of 2.4% or 48,100 in the year to the second quarter of 2017, bringing total employment to 2,063,000. This compares with an annual increase of 3.5% or 68,600 in employment in the previous quarter and an increase of 2.9% or 56,200 in the year to Q2 2016.
Summary points for Q2 2017
|
After each Census of Population the sample of households for the QNHS is updated to ensure the sample remains representative. The new sample based on the 2011 Census of Population was introduced incrementally from Q4 2012 to Q4 2013. An additional new sample also based on the 2011 Census of Population has been introduced incrementally from Q3 2016. These changes in sample can lead to some level of variability in estimates, particularly at more detailed levels and some caution is warranted in the interpretation of trends involving the period of their introduction. Users should also note that effective from Q3 2017, the Quarterly National Household Survey (QNHS) is being replaced by a new Labour Force Survey (LFS). Further information is available in the background notes and information note. |
Employment
| NACE Rev.2 Economic Sector | Q2 2016 | Q2 2017 |
|---|---|---|
| 1 | 116400 | 110100 |
| 2 | 255000 | 260100 |
| 3 | 136900 | 147400 |
| 4 | 274100 | 278400 |
| 5 | 94900 | 95900 |
| 6 | 145800 | 151900 |
| 7 | 84700 | 92500 |
| 8 | 101600 | 100200 |
| 9 | 115000 | 119600 |
| 10 | 70100 | 74000 |
| 11 | 105000 | 105100 |
| 12 | 150900 | 156900 |
| 13 | 251100 | 259800 |
| 14 | 106500 | 104600 |
| KEY | |
| 1- | Agriculture, forestry and fishing |
| 2- | Industry |
| 3- | Construction |
| 4- | Wholesale and retail trade; repair of motor vehicles and motorcycles |
| 5- | Transportation and storage |
| 6- | Accommodation and food storage activities |
| 7- | Information and communication |
| 8- | Financial, insurance and real estate activities |
| 9- | Professional, scientific and technical activities |
| 10- | Administrative and support service activities |
| 11- | Public administration and defence; compulsory social security |
| 12- | Education |
| 13- | Human health and social work activities |
| 14- | Other NACE activities |
Public Sector Employment
Unemployment
| Short-term | Long-term | |
| Q2 14 Male | 56400 | 101800 |
| Q2 17 Male | 36900 | 47700 |
| Q2 14 Female | 47200 | 44800 |
| Q2 17 Female | 29200 | 21200 |
|
The male long-term unemployed figure for Q2 2017 in the above graph has been updated due to a typing error |
Labour force
International Comparisons
Implications of Census 2016 Final Results
The QNHS results are weighted using population estimates which are generated on a quarterly basis. Historically every 5 years the Census of Population results have been used to revise these population estimates, and QNHS results are revised as a consequence. Final results from the Census of Population 2016 are now available and the CSO is in the process of revising the population estimates beginning with Q3 2011 based on this final Census count. See Background Notes for more details.
| Table 1 Persons aged 15 years and over classified by sex and ILO Economic Status | ||||||||||
| '000 | ||||||||||
| ILO Economic Status | Q2 15 | Q1 16 | Q2 16 | Q3 16 | Q4 16 | Q1 17 | Q2 17 | |||
| Males | ||||||||||
| In labour force | 1,196.5 | 1,185.9 | 1,208.3 | 1,219.7 | 1,202.8 | 1,195.9 | 1,207.1 | |||
| In employment | 1,064.9 | 1,068.4 | 1,091.0 | 1,109.6 | 1,112.7 | 1,107.7 | 1,118.1 | |||
| full-time | 923.3 | 925.1 | 943.3 | 963.3 | 977.0 | 974.9 | 991.3 | |||
| part-time | 141.6 | 143.4 | 147.8 | 146.3 | 135.7 | 132.7 | 126.8 | |||
| of which: | part-time, not underemployed | 86.6 | 96.5 | 97.4 | 98.3 | 95.3 | 90.9 | 89.0 | ||
| part-time, underemployed | 55.0 | 46.8 | 50.4 | 48.0 | 40.4 | 41.8 | 37.7 | |||
| Unemployed | 131.6 | 117.5 | 117.2 | 110.2 | 90.1 | 88.2 | 89.0 | |||
| seeking full-time work/future job-starter | 123.7 | 109.7 | 107.5 | 101.2 | 82.3 | 80.6 | 79.6 | |||
| seeking part-time work | [3.2] | [3.7] | 5.2 | [5.0] | [3.8] | [4.3] | 6.8 | |||
| seeking work as self-employed | 4.7 | [4.1] | [4.5] | [3.9] | [4.1] | [3.4] | * | |||
| Not in labour force | 566.6 | 589.4 | 574.1 | 568.4 | 588.7 | 600.1 | 597.2 | |||
| Potential additional labour force | 22.0 | 18.0 | 21.4 | 19.0 | 18.2 | 17.2 | 19.5 | |||
| Others | 544.6 | 571.4 | 552.7 | 549.4 | 570.5 | 583.0 | 577.7 | |||
| Total males aged 15 or over | 1,763.1 | 1,775.4 | 1,782.4 | 1,788.1 | 1,791.5 | 1,796.0 | 1,804.2 | |||
| Unemployment rate % (Persons aged 15-74) | 11.1 | 10.0 | 9.8 | 9.1 | 7.5 | 7.4 | 7.4 | |||
| Participation rate % | 67.9 | 66.8 | 67.8 | 68.2 | 67.1 | 66.6 | 66.9 | |||
| Females | ||||||||||
| In labour force | 973.5 | 970.0 | 994.4 | 998.5 | 992.7 | 995.5 | 997.4 | |||
| In employment | 893.8 | 908.1 | 923.9 | 930.9 | 935.4 | 937.5 | 945.0 | |||
| full-time | 584.8 | 595.2 | 609.7 | 615.6 | 626.3 | 629.6 | 639.5 | |||
| part-time | 309.0 | 312.9 | 314.2 | 315.4 | 309.1 | 307.9 | 305.4 | |||
| of which: | part-time, not underemployed | 244.3 | 260.6 | 250.2 | 262.9 | 257.5 | 256.9 | 254.8 | ||
| part-time, underemployed | 64.6 | 52.3 | 64.0 | 52.4 | 51.6 | 51.0 | 50.7 | |||
| Unemployed | 79.7 | 61.9 | 70.5 | 67.5 | 57.3 | 58.0 | 52.5 | |||
| seeking full-time work/future job-starter | 61.1 | 45.6 | 50.7 | 49.5 | 41.3 | 40.5 | 37.8 | |||
| seeking part-time work | 17.3 | 15.1 | 18.8 | 17.0 | 15.5 | 16.4 | 14.6 | |||
| seeking work as self-employed | * | * | * | * | * | * | * | |||
| Not in labour force | 870.5 | 880.7 | 860.9 | 862.0 | 870.6 | 874.8 | 880.3 | |||
| Potential additional labour force | 17.5 | 12.7 | 17.8 | 17.7 | 13.5 | 13.9 | 14.4 | |||
| Others | 853.0 | 868.0 | 843.0 | 844.2 | 857.0 | 860.9 | 865.8 | |||
| Total females aged 15 or over | 1,844.0 | 1,850.8 | 1,855.3 | 1,860.4 | 1,863.3 | 1,870.3 | 1,877.7 | |||
| Unemployment rate % (Persons aged 15-74) | 8.2 | 6.4 | 7.1 | 6.8 | 5.8 | 5.8 | 5.3 | |||
| Participation rate % | 52.8 | 52.4 | 53.6 | 53.7 | 53.3 | 53.2 | 53.1 | |||
| All persons | ||||||||||
| In labour force | 2,169.9 | 2,156.0 | 2,202.7 | 2,218.2 | 2,195.6 | 2,191.4 | 2,204.5 | |||
| In employment | 1,958.7 | 1,976.5 | 2,014.9 | 2,040.5 | 2,048.1 | 2,045.1 | 2,063.0 | |||
| full-time | 1,508.1 | 1,520.3 | 1,553.0 | 1,578.9 | 1,603.3 | 1,604.5 | 1,630.8 | |||
| part-time | 450.6 | 456.2 | 461.9 | 461.6 | 444.8 | 440.6 | 432.2 | |||
| of which: | part-time, not underemployed | 331.0 | 357.1 | 347.5 | 361.2 | 352.9 | 347.8 | 343.8 | ||
| part-time, underemployed | 119.6 | 99.1 | 114.4 | 100.4 | 92.0 | 92.8 | 88.4 | |||
| Unemployed | 211.2 | 179.5 | 187.8 | 177.7 | 147.4 | 146.2 | 141.5 | |||
| seeking full-time work/future job-starter | 184.7 | 155.3 | 158.2 | 150.8 | 123.6 | 121.0 | 117.3 | |||
| seeking part-time work | 20.4 | 18.8 | 24.0 | 22.0 | 19.3 | 20.7 | 21.5 | |||
| seeking work as self-employed | 6.1 | [5.3] | 5.6 | [4.9] | [4.6] | [4.6] | * | |||
| Not in labour force | 1,437.2 | 1,470.2 | 1,434.9 | 1,430.3 | 1,459.3 | 1,474.9 | 1,477.4 | |||
| Potential additional labour force | 39.5 | 30.7 | 39.2 | 36.7 | 31.8 | 31.0 | 33.9 | |||
| Others | 1,397.6 | 1,439.5 | 1,395.7 | 1,393.6 | 1,427.5 | 1,443.9 | 1,443.5 | |||
| Total persons aged 15 or over | 3,607.1 | 3,626.1 | 3,637.7 | 3,648.5 | 3,654.8 | 3,666.3 | 3,681.9 | |||
| Unemployment rate % (Persons aged 15-74) | 9.8 | 8.4 | 8.6 | 8.0 | 6.7 | 6.7 | 6.4 | |||
| Participation rate % | 60.2 | 59.5 | 60.6 | 60.8 | 60.1 | 59.8 | 59.9 | |||
| Employment rate % (Persons aged 15-64) | ||||||||||
| Male | 68.7 | 68.7 | 69.9 | 71.1 | 71.2 | 70.9 | 71.1 | |||
| Female | 57.6 | 58.6 | 59.5 | 59.8 | 60.1 | 60.1 | 60.4 | |||
| Total persons | 63.1 | 63.6 | 64.7 | 65.4 | 65.6 | 65.4 | 65.7 | |||
| See Background Notes for further information regarding minor modifications to calculation of unemployment rate | ||||||||||
| Table 2 Persons aged 15 years and over in employment (ILO) classified by sex and NACE Rev.2 Economic Sector | ||||||||||
| '000 | ||||||||||
| Economic sector (NACE Rev.2) | Q2 15 | Q1 16 | Q2 16 | Q3 16 | Q4 16 | Q1 17 | Q2 17 | |||
| Males | ||||||||||
| A | Agriculture, forestry and fishing | 99.2 | 96.6 | 103.8 | 102.5 | 97.8 | 94.5 | 97.1 | ||
| B-F | Total Industry | 295.8 | 302.3 | 307.7 | 316.2 | 317.5 | 325.6 | 325.1 | ||
| B-E | Industry | 177.0 | 178.9 | 179.5 | 187.2 | 186.2 | 192.1 | 185.8 | ||
| F | Construction | 118.8 | 123.3 | 128.2 | 129.0 | 131.3 | 133.5 | 139.3 | ||
| G-U | Total Services | 666.7 | 666.8 | 676.3 | 687.9 | 694.2 | 684.4 | 691.8 | ||
| G | Wholesale and retail trade; repair of motor vehicles and motorcycles | 138.5 | 140.6 | 143.0 | 144.6 | 146.1 | 140.7 | 141.8 | ||
| H | Transportation and storage | 77.1 | 79.0 | 79.7 | 76.8 | 77.2 | 77.6 | 79.3 | ||
| I | Accommodation and food service activities | 63.7 | 67.0 | 65.3 | 67.2 | 65.9 | 66.7 | 65.4 | ||
| J | Information and communication | 57.0 | 60.2 | 58.7 | 62.1 | 64.0 | 67.3 | 68.1 | ||
| K-L | Financial, insurance and real estate activities | 50.8 | 46.5 | 48.8 | 48.2 | 49.2 | 48.3 | 49.0 | ||
| M | Professional, scientific and technical activities | 69.4 | 64.5 | 66.0 | 72.8 | 73.4 | 67.1 | 68.5 | ||
| N | Administrative and support service activities | 32.4 | 35.7 | 37.8 | 38.5 | 36.7 | 38.4 | 38.7 | ||
| O | Public administration and defence; compulsory social security | 50.7 | 49.8 | 51.0 | 47.9 | 48.9 | 48.7 | 49.9 | ||
| P | Education | 40.4 | 37.5 | 37.1 | 38.5 | 41.4 | 41.0 | 40.3 | ||
| Q | Human health and social work activities | 46.7 | 46.0 | 45.9 | 47.3 | 47.2 | 47.4 | 50.2 | ||
| R-U | Other NACE activities | 40.0 | 40.1 | 42.9 | 44.2 | 44.3 | 41.2 | 40.5 | ||
| Not stated | [3.2] | * | * | * | * | [3.2] | [4.1] | |||
| Total males | 1,064.9 | 1,068.4 | 1,091.0 | 1,109.6 | 1,112.7 | 1,107.7 | 1,118.1 | |||
| Females | ||||||||||
| A | Agriculture, forestry and fishing | 13.3 | 12.7 | 12.6 | 13.5 | 12.0 | 13.2 | 13.0 | ||
| B-F | Total Industry | 75.9 | 79.1 | 84.2 | 88.3 | 79.9 | 80.6 | 82.4 | ||
| B-E | Industry | 68.8 | 71.1 | 75.5 | 80.5 | 72.9 | 71.7 | 74.3 | ||
| F | Construction | 7.1 | 8.0 | 8.7 | 7.8 | 7.0 | 8.9 | 8.1 | ||
| G-U | Total Services | 801.4 | 812.7 | 823.5 | 826.6 | 839.4 | 839.6 | 847.2 | ||
| G | Wholesale and retail trade; repair of motor vehicles and motorcycles | 133.3 | 131.9 | 131.2 | 134.4 | 137.1 | 135.8 | 136.6 | ||
| H | Transportation and storage | 15.7 | 16.0 | 15.2 | 18.5 | 19.3 | 17.8 | 16.6 | ||
| I | Accommodation and food service activities | 73.0 | 75.5 | 80.4 | 86.1 | 82.1 | 85.5 | 86.5 | ||
| J | Information and communication | 25.3 | 25.1 | 26.0 | 24.6 | 25.9 | 25.5 | 24.4 | ||
| K-L | Financial, insurance and real estate activities | 51.9 | 54.2 | 52.8 | 53.5 | 52.3 | 52.0 | 51.2 | ||
| M | Professional, scientific and technical activities | 46.3 | 45.8 | 49.0 | 52.5 | 52.8 | 49.4 | 51.0 | ||
| N | Administrative and support service activities | 31.4 | 32.5 | 32.3 | 27.5 | 30.6 | 33.8 | 35.3 | ||
| O | Public administration and defence; compulsory social security | 49.6 | 48.8 | 54.0 | 51.8 | 52.3 | 52.0 | 55.2 | ||
| P | Education | 110.3 | 116.4 | 113.8 | 110.1 | 114.7 | 117.0 | 116.6 | ||
| Q | Human health and social work activities | 202.4 | 202.6 | 205.1 | 206.4 | 210.3 | 208.8 | 209.6 | ||
| R-U | Other NACE activities | 62.2 | 63.9 | 63.6 | 61.2 | 62.0 | 62.0 | 64.1 | ||
| Not stated | [3.2] | * | * | * | [4.1] | [4.1] | * | |||
| Total females | 893.8 | 908.1 | 923.9 | 930.9 | 935.4 | 937.5 | 945.0 | |||
| All persons | ||||||||||
| A | Agriculture, forestry and fishing | 112.5 | 109.3 | 116.4 | 116.0 | 109.7 | 107.7 | 110.1 | ||
| B-F | Total Industry | 371.7 | 381.4 | 391.9 | 404.4 | 397.4 | 406.2 | 407.5 | ||
| B-E | Industry | 245.8 | 250.0 | 255.0 | 267.7 | 259.1 | 263.8 | 260.1 | ||
| F | Construction | 125.9 | 131.3 | 136.9 | 136.7 | 138.2 | 142.5 | 147.4 | ||
| G-U | Total Services | 1,468.1 | 1,479.6 | 1,499.7 | 1,514.5 | 1,533.6 | 1,524.0 | 1,539.0 | ||
| G | Wholesale and retail trade; repair of motor vehicles and motorcycles | 271.7 | 272.5 | 274.1 | 279.0 | 283.2 | 276.5 | 278.4 | ||
| H | Transportation and storage | 92.8 | 95.0 | 94.9 | 95.2 | 96.4 | 95.4 | 95.9 | ||
| I | Accommodation and food service activities | 136.7 | 142.4 | 145.8 | 153.2 | 148.0 | 152.2 | 151.9 | ||
| J | Information and communication | 82.3 | 85.2 | 84.7 | 86.7 | 89.9 | 92.7 | 92.5 | ||
| K-L | Financial, insurance and real estate activities | 102.7 | 100.7 | 101.6 | 101.7 | 101.5 | 100.4 | 100.2 | ||
| M | Professional, scientific and technical activities | 115.8 | 110.3 | 115.0 | 125.3 | 126.1 | 116.5 | 119.6 | ||
| N | Administrative and support service activities | 63.8 | 68.2 | 70.1 | 66.0 | 67.3 | 72.2 | 74.0 | ||
| O | Public administration and defence; compulsory social security | 100.4 | 98.5 | 105.0 | 99.7 | 101.2 | 100.7 | 105.1 | ||
| P | Education | 150.7 | 153.9 | 150.9 | 148.5 | 156.1 | 158.1 | 156.9 | ||
| Q | Human health and social work activities | 249.1 | 248.7 | 251.1 | 253.7 | 257.5 | 256.2 | 259.8 | ||
| R-U | Other NACE activities | 102.1 | 104.1 | 106.5 | 105.4 | 106.3 | 103.1 | 104.6 | ||
| Not stated | 6.4 | [6.3] | 7.0 | [5.6] | 7.4 | 7.3 | 6.4 | |||
| Total persons | 1,958.7 | 1,976.5 | 2,014.9 | 2,040.5 | 2,048.1 | 2,045.1 | 2,063.0 | |||
| Table 3 Seasonally adjusted series of persons aged 15 years and over classified by sex, ILO Economic Status and NACE Rev.2 Economic Sector | ||||||||||
| '000 | ||||||||||
| ILO Economic Status/NACE Rev.2 Economic Sector | Q2 15 | Q1 16 | Q2 16 | Q3 16 | Q4 16 | Q1 17 | Q2 17 | |||
| Males | ||||||||||
| In labour force | 1,195.4 | 1,195.7 | 1,207.4 | 1,207.9 | 1,205.6 | 1,205.8 | 1,206.2 | |||
| In employment | 1,067.0 | 1,078.3 | 1,092.2 | 1,100.2 | 1,111.1 | 1,117.7 | 1,119.1 | |||
| of which: | Full-time | 927.6 | 932.7 | 947.3 | 958.4 | 970.1 | 983.0 | 995.1 | ||
| Part-time | 141.0 | 144.2 | 147.0 | 144.4 | 137.5 | 133.4 | 126.1 | |||
| A | Agriculture, forestry and fishing | 97.5 | 98.6 | 101.9 | 101.0 | 99.1 | 96.6 | 95.0 | ||
| B-E | Industry | 178.9 | 178.4 | 181.8 | 185.8 | 186.0 | 191.2 | 188.3 | ||
| F | Construction | 118.4 | 124.3 | 127.4 | 128.2 | 132.0 | 134.5 | 138.3 | ||
| G | Wholesale and retail trade; repair of motor vehicles and motorcycles | 139.5 | 141.7 | 143.9 | 143.8 | 144.6 | 142.2 | 142.5 | ||
| H | Transportation and storage | 76.8 | 78.5 | 79.3 | 77.6 | 77.1 | 77.9 | 78.1 | ||
| I | Accommodation and food service activities | 64.3 | 67.5 | 66.0 | 66.2 | 65.8 | 67.1 | 66.1 | ||
| J | Information and communication | 57.1 | 60.0 | 59.1 | 62.2 | 63.7 | 66.7 | 69.0 | ||
| K-L | Financial, insurance and real estate activities | 50.7 | 46.9 | 48.6 | 48.0 | 49.2 | 48.8 | 48.8 | ||
| M | Professional, scientific and technical activities | 70.5 | 66.8 | 67.1 | 70.7 | 71.5 | 69.7 | 70.0 | ||
| N | Administrative and support service activities | 32.5 | 36.2 | 37.9 | 38.0 | 36.5 | 39.0 | 38.7 | ||
| O | Public administration and defence; compulsory social security | 50.7 | 50.1 | 50.7 | 47.8 | 49.0 | 48.5 | 50.1 | ||
| P | Education | 41.3 | 37.2 | 37.8 | 38.9 | 40.5 | 40.8 | 41.0 | ||
| Q | Human health and social work activities | 46.6 | 46.7 | 45.9 | 46.3 | 47.5 | 48.1 | 50.3 | ||
| R-U | Other NACE activities | 40.3 | 40.2 | 43.4 | 43.4 | 44.4 | 41.3 | 41.0 | ||
| Unemployed | 128.3 | 118.7 | 114.2 | 107.8 | 93.6 | 89.0 | 86.6 | |||
| Not in labour force | 569.4 | 579.3 | 576.6 | 579.3 | 585.5 | 589.8 | 599.5 | |||
| Unemployment rate % (Persons aged 15-74) | 10.8 | 10.0 | 9.5 | 9.0 | 7.8 | 7.4 | 7.2 | |||
| Participation rate % | 67.8 | 67.3 | 67.7 | 67.6 | 67.3 | 67.1 | 66.8 | |||
| Females | ||||||||||
| In labour force | 968.7 | 978.2 | 989.8 | 992.7 | 995.3 | 1,003.0 | 993.3 | |||
| In employment | 893.0 | 913.6 | 922.9 | 928.8 | 933.7 | 942.1 | 944.1 | |||
| of which: | Full-time | 584.1 | 599.3 | 608.7 | 614.7 | 624.2 | 633.3 | 638.6 | ||
| Part-time | 309.1 | 313.7 | 314.5 | 315.4 | 308.1 | 308.4 | 305.9 | |||
| A | Agriculture, forestry and fishing | 13.3 | 12.7 | 12.5 | 12.9 | 12.7 | 13.2 | 13.0 | ||
| B-E | Industry | 68.5 | 71.2 | 75.4 | 81.1 | 72.5 | 72.2 | 73.5 | ||
| F | Construction | 7.1 | 8.1 | 8.6 | 7.9 | 6.9 | 9.0 | 8.1 | ||
| G | Wholesale and retail trade; repair of motor vehicles and motorcycles | 134.0 | 133.3 | 131.9 | 133.6 | 136.0 | 136.9 | 137.4 | ||
| H | Transportation and storage | 15.8 | 15.9 | 15.4 | 18.9 | 18.7 | 17.6 | 16.9 | ||
| I | Accommodation and food service activities | 73.2 | 77.5 | 80.9 | 83.0 | 82.5 | 87.8 | 87.1 | ||
| J | Information and communication | 25.1 | 25.3 | 25.9 | 24.9 | 25.4 | 25.7 | 24.4 | ||
| K-L | Financial, insurance and real estate activities | 51.9 | 54.4 | 52.9 | 53.0 | 52.8 | 52.1 | 51.3 | ||
| M | Professional, scientific and technical activities | 46.7 | 47.2 | 49.3 | 51.2 | 52.1 | 51.2 | 51.2 | ||
| N | Administrative and support service activities | 32.1 | 33.3 | 33.0 | 26.3 | 30.8 | 34.5 | 36.0 | ||
| O | Public administration and defence; compulsory social security | 48.6 | 49.6 | 52.8 | 51.3 | 53.2 | 52.9 | 53.9 | ||
| P | Education | 108.3 | 113.9 | 112.0 | 115.5 | 113.6 | 114.5 | 115.1 | ||
| Q | Human health and social work activities | 202.7 | 204.1 | 205.5 | 206.5 | 208.3 | 210.3 | 210.0 | ||
| R-U | Other NACE activities | 61.7 | 63.9 | 63.0 | 60.8 | 63.1 | 62.0 | 63.4 | ||
| Unemployed | 77.5 | 63.1 | 68.4 | 64.0 | 61.2 | 59.9 | 50.2 | |||
| Not in labour force | 874.2 | 875.0 | 863.2 | 867.1 | 868.3 | 870.7 | 881.4 | |||
| Unemployment rate % (Persons aged 15-74) | 8.0 | 6.5 | 6.9 | 6.5 | 6.2 | 6.0 | 5.1 | |||
| Participation rate % | 52.5 | 52.9 | 53.4 | 53.4 | 53.4 | 53.6 | 52.9 | |||
| All persons | ||||||||||
| In labour force | 2,166.3 | 2,172.3 | 2,199.1 | 2,200.5 | 2,200.4 | 2,207.9 | 2,201.2 | |||
| In employment | 1,959.7 | 1,991.6 | 2,015.0 | 2,029.2 | 2,044.9 | 2,059.6 | 2,062.9 | |||
| of which: | Full-time | 1,511.6 | 1,532.3 | 1,556.4 | 1,571.6 | 1,594.9 | 1,616.7 | 1,634.5 | ||
| Part-time | 450.9 | 457.9 | 462.2 | 459.7 | 444.8 | 442.3 | 432.5 | |||
| A | Agriculture, forestry and fishing | 110.9 | 111.0 | 114.6 | 113.9 | 111.8 | 109.4 | 108.3 | ||
| B-E | Industry | 248.1 | 250.5 | 258.0 | 264.7 | 258.8 | 265.2 | 262.1 | ||
| F | Construction | 125.5 | 132.1 | 136.1 | 135.9 | 139.2 | 143.1 | 146.5 | ||
| G | Wholesale and retail trade; repair of motor vehicles and motorcycles | 273.6 | 275.1 | 276.0 | 277.7 | 279.8 | 279.4 | 280.3 | ||
| H | Transportation and storage | 92.1 | 94.9 | 94.1 | 96.5 | 96.1 | 95.2 | 95.1 | ||
| I | Accommodation and food service activities | 137.0 | 145.6 | 146.0 | 149.5 | 148.2 | 155.6 | 152.2 | ||
| J | Information and communication | 82.3 | 85.2 | 85.2 | 87.2 | 89.1 | 92.3 | 93.3 | ||
| K-L | Financial, insurance and real estate activities | 102.8 | 101.2 | 101.7 | 100.8 | 101.9 | 100.7 | 100.2 | ||
| M | Professional, scientific and technical activities | 117.3 | 114.6 | 116.7 | 121.3 | 123.3 | 121.7 | 121.2 | ||
| N | Administrative and support service activities | 63.8 | 69.4 | 70.1 | 64.6 | 67.5 | 73.4 | 74.0 | ||
| O | Public administration and defence; compulsory social security | 99.7 | 99.5 | 104.1 | 98.7 | 102.3 | 101.8 | 104.0 | ||
| P | Education | 149.9 | 151.3 | 150.3 | 153.8 | 154.1 | 155.3 | 156.5 | ||
| Q | Human health and social work activities | 249.2 | 250.8 | 251.3 | 252.7 | 256.0 | 258.4 | 260.2 | ||
| R-U | Other NACE activities | 101.6 | 104.3 | 106.0 | 104.7 | 107.2 | 103.5 | 104.1 | ||
| Unemployed | 205.8 | 181.8 | 182.5 | 171.7 | 154.8 | 149.0 | 136.7 | |||
| Not in labour force | 1,444.2 | 1,452.6 | 1,440.9 | 1,446.9 | 1,453.8 | 1,458.5 | 1,482.6 | |||
| Unemployment rate % (Persons aged 15-74) | 9.6 | 8.4 | 8.3 | 7.8 | 7.1 | 6.8 | 6.2 | |||
| Participation rate % | 60.0 | 59.9 | 60.4 | 60.3 | 60.2 | 60.2 | 59.8 | |||
| See Background Notes for further detail. The not stated group presented in Table 2 has not been separately seasonally adjusted. | ||||||||||
| See Background Notes for further information regarding minor modifications to calculation of unemployment rate and coherence with monthly unemployment estimates. | ||||||||||
| Table 4 Persons aged 15 years and over in employment (ILO) classified by sex and occupation (SOC2010) | ||||||||||
| '000 | ||||||||||
| Broad occupational group | Q2 15 | Q1 16 | Q2 16 | Q3 16 | Q4 16 | Q1 17 | Q2 17 | |||
| Males | ||||||||||
| 1. | Managers, directors and senior officials | 108.3 | 106.9 | 111.6 | 110.7 | 112.9 | 113.1 | 114.1 | ||
| 2. | Professionals | 153.5 | 154.6 | 156.1 | 166.1 | 163.4 | 164.1 | 167.8 | ||
| 3. | Associate professional and technical | 136.3 | 130.9 | 135.6 | 141.2 | 143.6 | 139.8 | 141.5 | ||
| 4. | Administrative and secretarial | 42.6 | 39.3 | 41.3 | 42.7 | 44.0 | 48.0 | 47.4 | ||
| 5. | Skilled trades | 287.6 | 288.2 | 289.4 | 283.9 | 286.2 | 293.7 | 287.8 | ||
| 6. | Caring, leisure and other services | 27.7 | 26.4 | 26.9 | 26.5 | 26.8 | 25.6 | 29.1 | ||
| 7. | Sales and customer service | 58.8 | 59.5 | 60.2 | 61.0 | 59.7 | 58.6 | 59.0 | ||
| 8. | Process, plant and machine operatives | 125.1 | 129.0 | 131.5 | 136.6 | 134.2 | 131.2 | 136.3 | ||
| 9. | Elementary | 122.6 | 123.9 | 127.2 | 130.4 | 133.0 | 124.5 | 126.0 | ||
| Other/Not stated | * | 9.7 | 11.3 | 10.5 | 8.9 | 9.0 | 9.0 | |||
| Total males | 1,064.9 | 1,068.4 | 1,091.0 | 1,109.6 | 1,112.7 | 1,107.7 | 1,118.1 | |||
| Females | ||||||||||
| 1. | Managers, directors and senior officials | 55.1 | 57.2 | 56.9 | 59.7 | 60.7 | 59.6 | 59.2 | ||
| 2. | Professionals | 202.9 | 202.6 | 207.5 | 196.8 | 204.3 | 206.4 | 207.3 | ||
| 3. | Associate professional and technical | 95.1 | 101.7 | 97.2 | 97.0 | 98.7 | 98.6 | 103.6 | ||
| 4. | Administrative and secretarial | 163.4 | 167.5 | 167.2 | 170.7 | 167.0 | 163.1 | 166.3 | ||
| 5. | Skilled trades | 28.5 | 30.0 | 31.7 | 32.2 | 33.1 | 33.1 | 34.6 | ||
| 6. | Caring, leisure and other services | 129.5 | 132.8 | 136.6 | 142.5 | 146.5 | 145.7 | 144.0 | ||
| 7. | Sales and customer service | 104.9 | 101.5 | 103.2 | 108.0 | 105.4 | 106.5 | 107.5 | ||
| 8. | Process, plant and machine operatives | 20.7 | 20.8 | 21.8 | 21.7 | 21.0 | 21.7 | 20.1 | ||
| 9. | Elementary | 90.9 | 86.3 | 93.8 | 94.5 | 89.9 | 93.4 | 95.7 | ||
| Other/Not stated | [2.9] | 7.7 | 8.0 | 7.8 | 8.8 | 9.4 | 6.8 | |||
| Total females | 893.8 | 908.1 | 923.9 | 930.9 | 935.4 | 937.5 | 945.0 | |||
| All persons | ||||||||||
| 1. | Managers, directors and senior officials | 163.4 | 164.1 | 168.5 | 170.4 | 173.6 | 172.7 | 173.3 | ||
| 2. | Professionals | 356.4 | 357.2 | 363.6 | 363.0 | 367.7 | 370.5 | 375.1 | ||
| 3. | Associate professional and technical | 231.4 | 232.6 | 232.7 | 238.2 | 242.2 | 238.4 | 245.1 | ||
| 4. | Administrative and secretarial | 205.9 | 206.8 | 208.5 | 213.4 | 211.0 | 211.1 | 213.7 | ||
| 5. | Skilled trades | 316.1 | 318.1 | 321.1 | 316.1 | 319.3 | 326.7 | 322.5 | ||
| 6. | Caring, leisure and other services | 157.1 | 159.1 | 163.5 | 169.0 | 173.2 | 171.3 | 173.1 | ||
| 7. | Sales and customer service | 163.7 | 161.0 | 163.4 | 168.9 | 165.1 | 165.1 | 166.5 | ||
| 8. | Process, plant and machine operatives | 145.8 | 149.8 | 153.3 | 158.3 | 155.2 | 152.8 | 156.3 | ||
| 9. | Elementary | 213.5 | 210.2 | 221.0 | 224.9 | 223.0 | 218.0 | 221.7 | ||
| Other/Not stated | 5.4 | 17.4 | 19.3 | 18.3 | 17.7 | 18.4 | 15.9 | |||
| Total persons | 1,958.7 | 1,976.5 | 2,014.9 | 2,040.5 | 2,048.1 | 2,045.1 | 2,063.0 | |||
| Note: From Q1 2011 occupational estimates are now captured and coded on the basis of the newer UK SOC2010 classification. | ||||||||||
| The CSO has re-coded previous quarters to 2007 inclusive on the basis of the text string captured under the old UK SOC90 | ||||||||||
| classification. As with the introduction of any new classification comparability of estimates over time can be impacted - users | ||||||||||
| should bear this in mind when comparing results from quarters prior to Q1 2011 to those from Q1 2011 onwards. | ||||||||||
| Table 5 Persons aged 15 years and over in employment (ILO) classified by sex and employment status | ||||||||||
| '000 | ||||||||||
| Employment status | Q2 15 | Q1 16 | Q2 16 | Q3 16 | Q4 16 | Q1 17 | Q2 17 | |||
| Males | ||||||||||
| Self employed (with paid employees) | 72.7 | 70.2 | 71.7 | 72.8 | 72.1 | 68.6 | 71.7 | |||
| Self employed (with no paid employees) | 189.1 | 186.0 | 188.8 | 183.7 | 181.8 | 176.2 | 188.5 | |||
| Total self employed | 261.9 | 256.3 | 260.5 | 256.5 | 253.9 | 244.8 | 260.2 | |||
| Employee | 796.2 | 806.0 | 822.2 | 845.6 | 852.2 | 856.9 | 850.4 | |||
| Assisting relative | 6.9 | 6.1 | 8.4 | 7.5 | 6.6 | 5.9 | 7.5 | |||
| Total males | 1,064.9 | 1,068.4 | 1,091.0 | 1,109.6 | 1,112.7 | 1,107.7 | 1,118.1 | |||
| Females | ||||||||||
| Self employed (with paid employees) | 20.9 | 22.2 | 20.9 | 23.2 | 22.6 | 22.9 | 20.6 | |||
| Self employed (with no paid employees) | 44.7 | 47.0 | 47.1 | 47.7 | 44.9 | 44.6 | 45.4 | |||
| Total self employed | 65.6 | 69.2 | 68.0 | 70.9 | 67.5 | 67.5 | 65.9 | |||
| Employee | 819.8 | 830.4 | 846.8 | 852.7 | 861.8 | 864.3 | 874.5 | |||
| Assisting relative | 8.4 | 8.4 | 9.1 | 7.3 | 6.0 | 5.7 | [4.5] | |||
| Total females | 893.8 | 908.1 | 923.9 | 930.9 | 935.4 | 937.5 | 945.0 | |||
| All persons | ||||||||||
| Self employed (with paid employees) | 93.6 | 92.5 | 92.6 | 96.0 | 94.7 | 91.5 | 92.3 | |||
| Self employed (with no paid employees) | 233.9 | 233.0 | 235.9 | 231.4 | 226.7 | 220.8 | 233.9 | |||
| Total self employed | 327.5 | 325.5 | 328.5 | 327.4 | 321.4 | 312.3 | 326.2 | |||
| Employee | 1,615.9 | 1,636.4 | 1,669.0 | 1,698.3 | 1,714.1 | 1,721.2 | 1,724.9 | |||
| Assisting relative | 15.3 | 14.5 | 17.4 | 14.8 | 12.7 | 11.6 | 11.9 | |||
| Total persons | 1,958.7 | 1,976.5 | 2,014.9 | 2,040.5 | 2,048.1 | 2,045.1 | 2,063.0 | |||
| Table 6 Persons aged 15 years and over classified by sex and duration of unemployment (ILO) | ||||||||||
| '000 | ||||||||||
| Duration of unemployment (ILO) | Q2 15 | Q1 16 | Q2 16 | Q3 16 | Q4 16 | Q1 17 | Q2 17 | |||
| Males | ||||||||||
| Less than 1 year | 47.1 | 40.8 | 44.6 | 42.8 | 33.4 | 35.3 | 36.9 | |||
| 1 year and over | 81.0 | 70.8 | 68.2 | 63.6 | 53.5 | 49.6 | 47.7 | |||
| Not stated | [3.4] | [6.0] | [4.5] | [3.8] | [3.3] | [3.4] | [4.4] | |||
| Total males | 131.6 | 117.5 | 117.2 | 110.2 | 90.1 | 88.2 | 89.0 | |||
| Females | ||||||||||
| Less than 1 year | 40.9 | 30.4 | 40.5 | 37.4 | 30.3 | 28.3 | 29.2 | |||
| 1 year and over | 37.6 | 29.9 | 27.7 | 28.8 | 26.2 | 29.0 | 21.2 | |||
| Not stated | * | * | * | * | * | * | * | |||
| Total females | 79.7 | 61.9 | 70.5 | 67.5 | 57.3 | 58.0 | 52.5 | |||
| All persons | ||||||||||
| Less than 1 year | 88.1 | 71.2 | 85.0 | 80.2 | 63.6 | 63.5 | 66.1 | |||
| 1 year and over | 118.6 | 100.6 | 95.9 | 92.3 | 79.7 | 78.7 | 68.9 | |||
| Not stated | 4.6 | 7.7 | 6.9 | [5.2] | [4.2] | [4.1] | 6.5 | |||
| Total persons | 211.2 | 179.5 | 187.8 | 177.7 | 147.4 | 146.2 | 141.5 | |||
| Long-term unemployment rate % (Persons aged 15-74) | 5.5 | 4.7 | 4.4 | 4.2 | 3.6 | 3.6 | 3.1 | |||
| See Background Notes for further information regarding minor modifications to calculation of unemployment rate | ||||||||||
| Table 7 Persons aged 15 years and over classified by ILO economic status, sex, age group and quarter | |||||||||||||
| '000 | |||||||||||||
| Employed | Unemployed | In labour force | |||||||||||
| Q2 15 | Q2 16 | Q2 17 | Q2 15 | Q2 16 | Q2 17 | Q2 15 | Q2 16 | Q2 17 | |||||
| Males | |||||||||||||
| 15-19 | 16.3 | 21.2 | 19.6 | 7.6 | 7.3 | 5.3 | 23.9 | 28.4 | 25.0 | ||||
| 20-24 | 60.9 | 66.5 | 65.1 | 17.0 | 15.5 | 13.6 | 77.9 | 82.0 | 78.7 | ||||
| Total 15-24 (Youths) | 77.3 | 87.6 | 84.7 | 24.6 | 22.8 | 19.0 | 101.8 | 110.4 | 103.7 | ||||
| 25-34 | 240.3 | 237.0 | 239.5 | 35.2 | 30.3 | 22.9 | 275.5 | 267.3 | 262.4 | ||||
| 35-44 | 298.1 | 304.0 | 309.8 | 30.0 | 26.8 | 19.9 | 328.1 | 330.8 | 329.7 | ||||
| 45-54 | 244.9 | 250.7 | 264.6 | 25.7 | 22.3 | 16.6 | 270.6 | 273.0 | 281.1 | ||||
| 55-59 | 93.5 | 97.3 | 99.9 | 9.2 | 9.3 | 6.4 | 102.7 | 106.7 | 106.3 | ||||
| 60-64 | 64.9 | 65.9 | 70.5 | 6.4 | 5.0 | [4.2] | 71.3 | 70.9 | 74.6 | ||||
| 65+ | 46.0 | 48.4 | 49.1 | * | * | * | 46.5 | 49.1 | 49.3 | ||||
| Total males | 1,064.9 | 1,091.0 | 1,118.1 | 131.6 | 117.2 | 89.0 | 1,196.5 | 1,208.3 | 1,207.1 | ||||
| Females | |||||||||||||
| 15-19 | 13.1 | 20.8 | 17.5 | 5.4 | 6.6 | 7.1 | 18.5 | 27.5 | 24.5 | ||||
| 20-24 | 54.9 | 60.0 | 64.7 | 11.9 | 10.0 | 7.0 | 66.7 | 70.0 | 71.6 | ||||
| Total 15-24 (Youths) | 68.0 | 80.8 | 82.1 | 17.3 | 16.6 | 14.0 | 85.3 | 97.4 | 96.2 | ||||
| 25-34 | 242.1 | 236.8 | 227.9 | 20.8 | 18.3 | 12.4 | 262.9 | 255.1 | 240.3 | ||||
| 35-44 | 249.1 | 259.8 | 272.1 | 17.5 | 18.4 | 10.2 | 266.7 | 278.2 | 282.3 | ||||
| 45-54 | 202.0 | 203.9 | 211.7 | 16.0 | 11.3 | 9.2 | 218.0 | 215.1 | 220.9 | ||||
| 55-59 | 72.7 | 79.0 | 81.0 | 4.7 | [3.1] | [4.2] | 77.4 | 82.1 | 85.2 | ||||
| 60-64 | 40.7 | 44.5 | 51.7 | [2.7] | * | * | 43.4 | 46.9 | 53.7 | ||||
| 65+ | 19.1 | 19.2 | 18.5 | * | * | * | 19.7 | 19.6 | 18.9 | ||||
| Total females | 893.8 | 923.9 | 945.0 | 79.7 | 70.5 | 52.5 | 973.5 | 994.4 | 997.4 | ||||
| All persons | |||||||||||||
| 15-19 | 29.4 | 42.0 | 37.1 | 13.0 | 13.9 | 12.4 | 42.4 | 55.9 | 49.5 | ||||
| 20-24 | 115.8 | 126.4 | 129.7 | 28.9 | 25.5 | 20.6 | 144.7 | 151.9 | 150.3 | ||||
| Total 15-24 (Youths) | 145.2 | 168.4 | 166.8 | 41.9 | 39.4 | 33.0 | 187.1 | 207.8 | 199.8 | ||||
| 25-34 | 482.4 | 473.7 | 467.4 | 56.0 | 48.6 | 35.3 | 538.4 | 522.4 | 502.7 | ||||
| 35-44 | 547.2 | 563.8 | 581.9 | 47.5 | 45.3 | 30.0 | 594.8 | 609.1 | 611.9 | ||||
| 45-54 | 446.9 | 454.6 | 476.3 | 41.6 | 33.6 | 25.7 | 488.6 | 488.2 | 502.0 | ||||
| 55-59 | 166.3 | 176.3 | 180.9 | 13.9 | 12.4 | 10.6 | 180.2 | 188.7 | 191.5 | ||||
| 60-64 | 105.6 | 110.4 | 122.1 | 9.1 | 7.4 | 6.2 | 114.7 | 117.9 | 128.3 | ||||
| 65+ | 65.1 | 67.6 | 67.6 | * | * | * | 66.2 | 68.7 | 68.2 | ||||
| Total persons | 1,958.7 | 2,014.9 | 2,063.0 | 211.2 | 187.8 | 141.5 | 2,169.9 | 2,202.7 | 2,204.5 | ||||
| Table 8 Persons aged 15 years and over classified by key economic rates, sex, age group and quarter | |||||||||||||
| % | |||||||||||||
| Employment rate (15-64) | Unemployment rate (15-74) | Participation rate | |||||||||||
| Q2 15 | Q2 16 | Q2 17 | Q2 15 | Q2 16 | Q2 17 | Q2 15 | Q2 16 | Q2 17 | |||||
| Males | |||||||||||||
| 15-19 | 11.2 | 14.3 | 12.8 | 31.8 | 25.5 | 21.4 | 16.4 | 19.1 | 16.3 | ||||
| 20-24 | 50.9 | 56.5 | 54.1 | 21.8 | 18.9 | 17.3 | 65.1 | 69.6 | 65.5 | ||||
| Total 15-24 (Youths) | 29.1 | 32.9 | 31.0 | 24.1 | 20.6 | 18.3 | 38.3 | 41.5 | 37.9 | ||||
| 25-34 | 77.0 | 77.6 | 81.0 | 12.8 | 11.3 | 8.7 | 88.3 | 87.5 | 88.7 | ||||
| 35-44 | 83.8 | 84.4 | 85.4 | 9.1 | 8.1 | 6.0 | 92.2 | 91.8 | 90.9 | ||||
| 45-54 | 80.1 | 80.5 | 83.2 | 9.5 | 8.2 | 5.9 | 88.5 | 87.7 | 88.4 | ||||
| 55-59 | 72.6 | 73.6 | 74.1 | 9.0 | 8.8 | 6.0 | 79.7 | 80.7 | 78.8 | ||||
| 60-64 | 56.8 | 56.9 | 59.4 | 9.0 | 7.0 | 5.6 | 62.4 | 61.2 | 62.9 | ||||
| 65+ | : | : | : | 1.4 | 1.6 | 0.4 | 16.6 | 16.9 | 16.4 | ||||
| Total males | 68.7 | 69.9 | 71.1 | 11.1 | 9.8 | 7.4 | 67.9 | 67.8 | 66.9 | ||||
| Females | |||||||||||||
| 15-19 | 9.5 | 14.8 | 11.9 | 29.2 | 24.1 | 28.8 | 13.5 | 19.5 | 16.7 | ||||
| 20-24 | 47.9 | 54.3 | 57.9 | 17.8 | 14.3 | 9.7 | 58.2 | 63.3 | 64.1 | ||||
| Total 15-24 (Youths) | 27.0 | 32.2 | 31.8 | 20.3 | 17.0 | 14.6 | 33.8 | 38.8 | 37.2 | ||||
| 25-34 | 70.9 | 72.2 | 72.4 | 7.9 | 7.2 | 5.2 | 77.0 | 77.8 | 76.4 | ||||
| 35-44 | 67.8 | 69.6 | 71.8 | 6.6 | 6.6 | 3.6 | 72.6 | 74.6 | 74.5 | ||||
| 45-54 | 65.2 | 64.8 | 65.9 | 7.3 | 5.2 | 4.2 | 70.4 | 68.3 | 68.7 | ||||
| 55-59 | 55.5 | 58.7 | 58.7 | 6.1 | 3.8 | 5.0 | 59.1 | 61.0 | 61.8 | ||||
| 60-64 | 35.0 | 37.4 | 42.5 | 6.3 | 5.2 | 3.8 | 37.3 | 39.5 | 44.1 | ||||
| 65+ | : | : | : | 3.6 | 2.2 | 2.4 | 6.0 | 5.8 | 5.5 | ||||
| Total females | 57.6 | 59.5 | 60.4 | 8.2 | 7.1 | 5.3 | 52.8 | 53.6 | 53.1 | ||||
| All persons | |||||||||||||
| 15-19 | 10.4 | 14.5 | 12.4 | 30.7 | 24.8 | 25.1 | 15.0 | 19.3 | 16.5 | ||||
| 20-24 | 49.4 | 55.4 | 55.9 | 19.9 | 16.8 | 13.7 | 61.7 | 66.6 | 64.8 | ||||
| Total 15-24 (Youths) | 28.0 | 32.6 | 31.4 | 22.4 | 19.0 | 16.5 | 36.1 | 40.2 | 37.6 | ||||
| 25-34 | 73.8 | 74.8 | 76.6 | 10.4 | 9.3 | 7.0 | 82.4 | 82.5 | 82.3 | ||||
| 35-44 | 75.7 | 76.9 | 78.5 | 8.0 | 7.4 | 4.9 | 82.2 | 83.1 | 82.5 | ||||
| 45-54 | 72.6 | 72.6 | 74.5 | 8.5 | 6.9 | 5.1 | 79.4 | 78.0 | 78.5 | ||||
| 55-59 | 64.0 | 66.1 | 66.3 | 7.7 | 6.6 | 5.5 | 69.3 | 70.7 | 70.2 | ||||
| 60-64 | 45.8 | 47.0 | 50.8 | 8.0 | 6.3 | 4.8 | 49.7 | 50.2 | 53.4 | ||||
| 65+ | : | : | : | 2.1 | 1.8 | 1.0 | 10.9 | 11.0 | 10.6 | ||||
| Total persons | 63.1 | 64.7 | 65.7 | 9.8 | 8.6 | 6.4 | 60.2 | 60.6 | 59.9 | ||||
| See Background Notes for further information regarding minor modifications to calculation of unemployment rate | |||||||||||||
| Table 9 Persons aged 15 years and over classified by NUTS2 and NUTS3 regions and ILO Economic Status | ||||||||||
| Region | Q2 15 | Q1 16 | Q2 16 | Q3 16 | Q4 16 | Q1 17 | Q2 17 | |||
| Border, Midland and Western | ||||||||||
| In employment ('000) | 492.3 | 489.7 | 498.6 | 502.8 | 507.5 | 511.7 | 507.1 | |||
| Unemployed ('000) | 57.8 | 53.4 | 52.7 | 51.5 | 43.5 | 40.2 | 38.6 | |||
| In labour force ('000) | 550.2 | 543.1 | 551.3 | 554.3 | 550.9 | 551.9 | 545.7 | |||
| Unemployment rate (%) (Persons aged 15-74) | 10.6 | 9.9 | 9.6 | 9.4 | 8.0 | 7.4 | 7.1 | |||
| Participation rate (%) | 58.4 | 57.5 | 58.3 | 58.3 | 57.9 | 57.8 | 57.0 | |||
| Border | ||||||||||
| In employment ('000) | 193.1 | 195.7 | 196.9 | 196.3 | 197.5 | 195.4 | 196.7 | |||
| Unemployed ('000) | 20.0 | 18.2 | 19.7 | 19.7 | 17.1 | 15.7 | 13.8 | |||
| In labour force ('000) | 213.1 | 213.9 | 216.6 | 216.0 | 214.6 | 211.2 | 210.5 | |||
| Unemployment rate (%) (Persons aged 15-74) | 9.4 | 8.6 | 9.2 | 9.2 | 8.0 | 7.5 | 6.6 | |||
| Participation rate (%) | 56.2 | 56.3 | 57.0 | 56.6 | 56.2 | 55.1 | 54.7 | |||
| Midland | ||||||||||
| In employment ('000) | 116.0 | 117.4 | 116.6 | 120.1 | 121.6 | 121.3 | 122.4 | |||
| Unemployed ('000) | 16.5 | 15.3 | 13.9 | 13.4 | 10.3 | 10.2 | 11.0 | |||
| In labour force ('000) | 132.5 | 132.7 | 130.6 | 133.5 | 131.9 | 131.6 | 133.4 | |||
| Unemployment rate (%) (Persons aged 15-74) | 12.5 | 11.6 | 10.7 | 10.1 | 7.9 | 7.8 | 8.3 | |||
| Participation rate (%) | 59.1 | 58.8 | 58.5 | 59.5 | 58.6 | 58.2 | 58.6 | |||
| West | ||||||||||
| In employment ('000) | 183.3 | 176.6 | 185.0 | 186.4 | 188.4 | 194.9 | 187.9 | |||
| Unemployed ('000) | 21.3 | 19.9 | 19.1 | 18.4 | 16.1 | 14.3 | 13.8 | |||
| In labour force ('000) | 204.6 | 196.5 | 204.1 | 204.7 | 204.5 | 209.1 | 201.8 | |||
| Unemployment rate (%) (Persons aged 15-74) | 10.5 | 10.2 | 9.5 | 9.1 | 7.9 | 6.9 | 6.9 | |||
| Participation rate (%) | 60.3 | 58.0 | 59.7 | 59.4 | 59.4 | 60.5 | 58.4 | |||
| Southern and Eastern | ||||||||||
| In employment ('000) | 1,466.4 | 1,486.8 | 1,516.4 | 1,537.7 | 1,540.7 | 1,533.4 | 1,556.0 | |||
| Unemployed ('000) | 153.4 | 126.1 | 135.1 | 126.2 | 104.0 | 106.0 | 102.8 | |||
| In labour force ('000) | 1,619.8 | 1,612.9 | 1,651.5 | 1,663.9 | 1,644.6 | 1,639.5 | 1,658.8 | |||
| Unemployment rate (%) (Persons aged 15-74) | 9.5 | 7.8 | 8.2 | 7.6 | 6.3 | 6.5 | 6.2 | |||
| Participation rate (%) | 60.8 | 60.1 | 61.3 | 61.7 | 60.8 | 60.5 | 60.9 | |||
| Dublin | ||||||||||
| In employment ('000) | 591.8 | 611.7 | 617.5 | 621.5 | 629.9 | 627.2 | 627.0 | |||
| Unemployed ('000) | 51.8 | 45.5 | 54.2 | 50.5 | 40.3 | 41.7 | 42.0 | |||
| In labour force ('000) | 643.6 | 657.2 | 671.7 | 672.0 | 670.2 | 668.9 | 669.1 | |||
| Unemployment rate (%) (Persons aged 15-74) | 8.1 | 6.9 | 8.1 | 7.5 | 6.0 | 6.3 | 6.3 | |||
| Participation rate (%) | 62.2 | 62.9 | 64.0 | 63.8 | 63.5 | 63.1 | 62.9 | |||
| Mid-East | ||||||||||
| In employment ('000) | 232.7 | 231.4 | 242.2 | 239.5 | 241.6 | 243.6 | 247.4 | |||
| Unemployed ('000) | 22.2 | 14.5 | 17.7 | 17.7 | 13.5 | 12.7 | 15.2 | |||
| In labour force ('000) | 254.9 | 245.9 | 259.9 | 257.2 | 255.1 | 256.2 | 262.5 | |||
| Unemployment rate (%) (Persons aged 15-74) | 8.7 | 5.9 | 6.9 | 6.9 | 5.3 | 5.0 | 5.8 | |||
| Participation rate (%) | 61.6 | 58.9 | 61.9 | 61.1 | 60.5 | 60.4 | 61.4 | |||
| Mid-West | ||||||||||
| In employment ('000) | 152.3 | 153.9 | 157.6 | 162.4 | 164.4 | 157.9 | 161.9 | |||
| Unemployed ('000) | 19.1 | 13.2 | 14.6 | 12.9 | 10.4 | 11.5 | 11.5 | |||
| In labour force ('000) | 171.4 | 167.1 | 172.2 | 175.3 | 174.8 | 169.4 | 173.4 | |||
| Unemployment rate (%) (Persons aged 15-74) | 11.2 | 7.9 | 8.5 | 7.4 | 6.0 | 6.8 | 6.7 | |||
| Participation rate (%) | 58.2 | 57.1 | 58.3 | 59.4 | 59.0 | 57.2 | 58.6 | |||
| South-East | ||||||||||
| In employment ('000) | 206.6 | 204.4 | 213.8 | 215.1 | 214.8 | 214.3 | 214.9 | |||
| Unemployed ('000) | 29.5 | 29.1 | 25.9 | 24.9 | 22.1 | 21.9 | 18.8 | |||
| In labour force ('000) | 236.1 | 233.5 | 239.6 | 240.0 | 237.0 | 236.2 | 233.8 | |||
| Unemployment rate (%) (Persons aged 15-74) | 12.6 | 12.5 | 10.8 | 10.4 | 9.4 | 9.3 | 8.1 | |||
| Participation rate (%) | 59.9 | 58.8 | 60.0 | 60.2 | 59.5 | 58.9 | 58.0 | |||
| South-West | ||||||||||
| In employment ('000) | 283.0 | 285.4 | 285.4 | 299.1 | 290.0 | 290.5 | 304.7 | |||
| Unemployed ('000) | 30.9 | 23.7 | 22.7 | 20.3 | 17.5 | 18.3 | 15.3 | |||
| In labour force ('000) | 313.9 | 309.1 | 308.0 | 319.4 | 307.5 | 308.8 | 320.0 | |||
| Unemployment rate (%) (Persons aged 15-74) | 9.9 | 7.7 | 7.4 | 6.4 | 5.7 | 5.9 | 4.8 | |||
| Participation rate (%) | 59.5 | 58.4 | 58.3 | 60.3 | 57.9 | 58.2 | 59.8 | |||
| State | ||||||||||
| In employment ('000) | 1,958.7 | 1,976.5 | 2,014.9 | 2,040.5 | 2,048.1 | 2,045.1 | 2,063.0 | |||
| Unemployed ('000) | 211.2 | 179.5 | 187.8 | 177.7 | 147.4 | 146.2 | 141.5 | |||
| In labour force ('000) | 2,169.9 | 2,156.0 | 2,202.7 | 2,218.2 | 2,195.6 | 2,191.4 | 2,204.5 | |||
| Unemployment rate (%) (Persons aged 15-74) | 9.8 | 8.4 | 8.6 | 8.0 | 6.7 | 6.7 | 6.4 | |||
| Participation rate (%) | 60.2 | 59.5 | 60.6 | 60.8 | 60.1 | 59.8 | 59.9 | |||
| See Background Notes for further information regarding minor modifications to calculation of unemployment rate | ||||||||||
| Table 10 Persons aged 15 years and over classified by Principal Economic Status (PES) | ||||||||||
| '000 | ||||||||||
| Principal Economic Status | Q2 15 | Q1 16 | Q2 16 | Q3 16 | Q4 16 | Q1 17 | Q2 17 | |||
| Males | ||||||||||
| At work | 1,038.5 | 1,044.8 | 1,058.4 | 1,068.2 | 1,085.8 | 1,084.4 | 1,091.9 | |||
| Unemployed | 164.0 | 154.4 | 149.8 | 147.4 | 128.7 | 124.2 | 119.9 | |||
| Student | 207.4 | 212.7 | 206.9 | 196.3 | 202.2 | 209.3 | 210.4 | |||
| Home duties | 9.5 | 10.3 | 9.2 | 10.1 | 8.9 | 9.9 | 10.4 | |||
| Retired | 259.3 | 266.3 | 266.5 | 272.0 | 271.5 | 272.1 | 272.5 | |||
| Others | 84.4 | 86.9 | 91.7 | 94.2 | 94.5 | 96.1 | 99.1 | |||
| Total males | 1,763.1 | 1,775.4 | 1,782.4 | 1,788.1 | 1,791.5 | 1,796.0 | 1,804.2 | |||
| Females | ||||||||||
| At work | 864.3 | 881.3 | 882.7 | 893.5 | 901.4 | 906.3 | 915.8 | |||
| Unemployed | 81.0 | 68.3 | 72.0 | 73.2 | 65.4 | 64.8 | 61.3 | |||
| Student | 202.5 | 206.8 | 201.9 | 196.6 | 200.5 | 208.5 | 202.1 | |||
| Home duties | 467.2 | 444.7 | 445.5 | 435.0 | 427.1 | 421.7 | 417.3 | |||
| Retired | 159.0 | 175.4 | 177.8 | 185.7 | 195.6 | 195.5 | 204.8 | |||
| Others | 69.9 | 74.2 | 75.4 | 76.4 | 73.3 | 73.4 | 76.4 | |||
| Total females | 1,844.0 | 1,850.8 | 1,855.3 | 1,860.4 | 1,863.3 | 1,870.3 | 1,877.7 | |||
| All persons | ||||||||||
| At work | 1,902.8 | 1,926.1 | 1,941.1 | 1,961.7 | 1,987.1 | 1,990.7 | 2,007.6 | |||
| Unemployed | 245.0 | 222.7 | 221.8 | 220.6 | 194.1 | 188.9 | 181.3 | |||
| Student | 409.9 | 419.6 | 408.8 | 392.9 | 402.8 | 417.8 | 412.6 | |||
| Home duties | 476.7 | 455.0 | 454.6 | 445.2 | 436.0 | 431.6 | 427.7 | |||
| Retired | 418.3 | 441.7 | 444.3 | 457.7 | 467.1 | 467.7 | 477.3 | |||
| Others | 154.4 | 161.1 | 167.1 | 170.6 | 167.8 | 169.5 | 175.4 | |||
| Total persons | 3,607.1 | 3,626.1 | 3,637.7 | 3,648.5 | 3,654.8 | 3,666.3 | 3,681.9 | |||
| Note: The Principal Economic Status (PES) classification is based on a respondent's own subjective assessment - see Background Notes. | ||||||||||
| Table 11 Labour Force Survey results classified by ILO Economic Status for persons in EU member states | |||||||||||||||
| % | |||||||||||||||
| Employment rate % (15-64 years) | Unemployment rate % (15-74 years) | Participation rate % (15 years and over) | |||||||||||||
| Q1 15 | Q1 16 | Q1 17 | Annual change | Q1 15 | Q1 16 | Q1 17 | Annual change | Q1 15 | Q1 16 | Q1 17 | Annual change | ||||
| Q1 17 pp | Q1 17 pp | Q1 17 pp | |||||||||||||
| EU28 | 64.7 | 65.7 | 66.7 | 1.0 | 10.2 | 9.2 | 8.3 | -0.9 | 57.3 | 57.5 | 57.5 | 0.0 | |||
| EU15 | 65.4 | 66.3 | 67.0 | 0.7 | 10.5 | 9.6 | 8.9 | -0.7 | 57.8 | 57.9 | 57.9 | 0.0 | |||
| Eurozone | 63.7 | 64.6 | 65.4 | 0.8 | 11.7 | 10.7 | 9.9 | -0.8 | 56.6 | 56.8 | 56.8 | 0.0 | |||
| Belgium | 61.9 | 61.6 | 62.2 | 0.6 | 8.8 | 8.3 | 7.7 | -0.6 | 53.6 | 52.8 | 53.5 | 0.7 | |||
| Bulgaria | 61.0 | 62.3 | 64.3 | 2.0 | 10.6 | 8.6 | 6.9 | -1.7 | 53.4 | 53.1 | 53.7 | 0.6 | |||
| Czech Republic | 69.4 | 71.0 | 72.8 | 1.8 | 6.0 | 4.4 | 3.5 | -0.9 | 59.3 | 59.6 | 59.9 | 0.3 | |||
| Denmark | 73.0 | 74.4 | 73.2 | -1.2 | 6.6 | 6.3 | 6.5 | 0.2 | 62.2 | 63.3 | 62.1 | -1.2 | |||
| Germany | 73.7 | 74.0 | 74.6 | 0.6 | 5.0 | 4.5 | 4.1 | -0.4 | 60.0 | 60.8 | 60.8 | 0.0 | |||
| Estonia | 69.9 | 70.3 | 73.1 | 2.8 | 6.6 | 6.5 | 5.6 | -0.9 | 60.7 | 61.2 | 62.5 | 1.3 | |||
| Ireland | 62.2 | 63.6 | 65.4 | 1.8 | 10.0 | 8.4 | 6.7 | -1.7 | 59.4 | 59.5 | 59.8 | 0.3 | |||
| Greece | 49.2 | 50.9 | 52.0 | 1.1 | 26.7 | 24.9 | 23.4 | -1.5 | 51.6 | 52.0 | 51.9 | -0.1 | |||
| Spain | 56.4 | 58.5 | 59.9 | 1.4 | 23.8 | 21.0 | 18.8 | -2.2 | 58.7 | 58.6 | 58.1 | -0.5 | |||
| France | 63.3 | 63.7 | 63.8 | 0.1 | 10.8 | 10.7 | 10.0 | -0.7 | 56.0 | 56.0 | 55.4 | -0.6 | |||
| Croatia | 54.4 | 55.0 | 55.9 | 0.9 | 17.8 | 15.4 | 14.1 | -1.3 | 52.4 | 51.1 | 50.6 | -0.5 | |||
| Italy | 55.5 | 56.3 | 57.2 | 0.9 | 13.0 | 12.1 | 12.2 | 0.1 | 48.9 | 49.0 | 49.7 | 0.7 | |||
| Cyprus | 61.9 | 61.6 | 63.3 | 1.7 | 17.7 | 14.1 | 13.6 | -0.5 | 63.6 | 60.0 | 61.5 | 1.5 | |||
| Latvia | 66.9 | 68.2 | 68.7 | 0.5 | 10.2 | 10.3 | 9.4 | -0.9 | 59.2 | 60.4 | 60.1 | -0.3 | |||
| Lithuania | 66.0 | 68.3 | 69.0 | 0.7 | 10.0 | 8.4 | 8.1 | -0.3 | 58.6 | 59.8 | 60.3 | 0.5 | |||
| Luxembourg | 66.2 | 65.4 | 65.9 | 0.5 | 7.3 | 5.9 | 6.1 | 0.2 | 60.6 | 58.5 | 59.4 | 0.9 | |||
| Hungary | 62.4 | 65.1 | 67.1 | 2.0 | 7.8 | 6.0 | 4.5 | -1.5 | 54.1 | 55.1 | 55.7 | 0.6 | |||
| Malta | 62.5 | 64.3 | 65.8 | 1.5 | 5.7 | 4.9 | 4.2 | -0.7 | 53.8 | 54.3 | 54.7 | 0.4 | |||
| Netherlands | 73.6 | 74.0 | 75.1 | 1.1 | 7.5 | 6.8 | 5.6 | -1.2 | 64.4 | 64.0 | 63.9 | -0.1 | |||
| Austria | 70.2 | 70.4 | 71.0 | 0.6 | 5.8 | 6.3 | 6.0 | -0.3 | 60.0 | 60.5 | 60.5 | 0.0 | |||
| Poland | 61.9 | 63.7 | 65.4 | 1.7 | 8.6 | 7.0 | 5.4 | -1.6 | 56.0 | 56.1 | 56.2 | 0.1 | |||
| Portugal | 62.8 | 64.0 | 66.3 | 2.3 | 13.9 | 12.6 | 10.2 | -2.4 | 58.5 | 58.1 | 58.5 | 0.4 | |||
| Romania | 59.1 | 59.8 | 61.2 | 1.4 | 7.4 | 6.6 | 5.5 | -1.1 | 52.9 | 52.7 | 52.9 | 0.2 | |||
| Slovenia | 63.5 | 64.2 | 67.3 | 3.1 | 9.8 | 8.9 | 7.8 | -1.1 | 56.5 | 55.8 | 57.7 | 1.9 | |||
| Slovakia | 61.9 | 64.1 | 65.8 | 1.7 | 12.4 | 10.4 | 8.7 | -1.7 | 59.5 | 59.8 | 59.9 | 0.1 | |||
| Finland | 67.2 | 67.5 | 68.0 | 0.5 | 9.7 | 9.6 | 9.3 | -0.3 | 58.1 | 58.0 | 57.8 | -0.2 | |||
| Sweden | 74.0 | 74.9 | 75.7 | 0.8 | 8.3 | 7.7 | 7.2 | -0.5 | 64.3 | 64.3 | 64.8 | 0.5 | |||
| United Kingdom | 72.4 | 73.1 | 73.7 | 0.6 | 5.5 | 5.0 | 4.5 | -0.5 | 62.7 | 62.7 | 62.8 | 0.1 | |||
| Source: Eurostat | |||||||||||||||
| Note: | Trends in some member states may be affected by changes in methodology | ||||||||||||||
| pp refers to percentage point change | |||||||||||||||
| Eurozone consists of EU15 states (with the exceptions of Denmark, Sweden and United Kingdom), Cyprus, Estonia, Latvia, Lithuania, Malta, Slovakia and Slovenia | |||||||||||||||
| Table A1 Estimated number of persons aged 15 years and over classified by nationality and ILO Economic Status | ||||||||||
| '000 | ||||||||||
| Nationality | ILO Economic Status | Total | ||||||||
| In employment | Unemployed | In labour force | Not in labour force | |||||||
| Q2 17 | ||||||||||
| Irish nationals | 1,733.4 | 116.3 | 1,849.7 | 1,312.2 | 3,161.9 | |||||
| Non-Irish nationals | 329.7 | 25.1 | 354.8 | 165.2 | 520.0 | |||||
| of which: | ||||||||||
| United Kingdom | 57.7 | * | 61.7 | 47.4 | 109.1 | |||||
| EU15 excl. Irl and UK | 24.1 | * | 25.0 | 6.3 | 31.2 | |||||
| EU15 to EU28 | 144.8 | 10.8 | 155.6 | 44.1 | 199.7 | |||||
| Other | 103.0 | [9.5] | 112.5 | 67.5 | 180.0 | |||||
| Total persons | 2,063.0 | 141.5 | 2,204.5 | 1,477.4 | 3,681.9 | |||||
| Q2 16 | ||||||||||
| Irish nationals | 1,699.7 | 152.4 | 1,852.1 | 1,280.2 | 3,132.3 | |||||
| Non-Irish nationals | 315.2 | 35.4 | 350.6 | 154.8 | 505.4 | |||||
| of which: | ||||||||||
| United Kingdom | 54.6 | [7.6] | 62.2 | 46.7 | 108.9 | |||||
| EU15 excl. Irl and UK | 21.1 | * | 22.3 | 5.2 | 27.5 | |||||
| EU15 to EU28 | 143.4 | 13.7 | 157.2 | 39.1 | 196.3 | |||||
| Other | 96.1 | 12.9 | 109.0 | 63.8 | 172.7 | |||||
| Total persons | 2,014.9 | 187.8 | 2,202.7 | 1,434.9 | 3,637.7 | |||||
| Year on year changes | ||||||||||
| Irish nationals | 33.6 | -36.1 | -2.4 | 32.1 | 29.6 | |||||
| Non-Irish nationals | 14.5 | -10.3 | 4.2 | 10.4 | 14.6 | |||||
| of which: | ||||||||||
| United Kingdom | 3.1 | * | -0.5 | 0.6 | 0.1 | |||||
| EU15 excl. Irl and UK | 3.0 | * | 2.7 | 1.0 | 3.7 | |||||
| EU15 to EU28 | 1.4 | -2.9 | -1.6 | 5.0 | 3.4 | |||||
| Other | 6.9 | [-3.4] | 3.6 | 3.7 | 7.3 | |||||
| Total persons | 48.1 | -46.3 | 1.8 | 42.5 | 44.3 | |||||
| Note: Persons whose nationality is not stated are included with Irish nationals | ||||||||||
| Table A2 Number of employees in the Public Sector by sub-sector and in the Private Sector | ||||||||||
| '000 | ||||||||||
| Q2 14 | Q2 15 | Q2 16 | Q1 17 | Q2 171 | ||||||
| Civil Service | 38.8 | 38.3 | 44.2 | 39.9 | 40.3 | |||||
| Defence | 9.6 | 9.6 | 9.5 | 9.5 | 9.4 | |||||
| Garda Siochána | 12.9 | 12.7 | 12.8 | 13.3 | 13.5 | |||||
| Education | 110.1 | 111.5 | 113.1 | 112.8 | 114.0 | |||||
| Regional bodies | 32.7 | 33.0 | 33.1 | 33.0 | 33.3 | |||||
| Health | 118.4 | 120.7 | 124.0 | 127.5 | 128.6 | |||||
| Total Public Sector excluding Semi-State bodies | 322.5 | 325.8 | 336.9 | 336.1 | 339.1 | |||||
| Semi-State bodies | 51.4 | 50.4 | 52.9 | 53.6 | 54.0 | |||||
| Total Public Sector including Semi-State bodies | 373.9 | 376.2 | 389.8 | 389.6 | 393.2 | |||||
| Excluding Census 2016 temporary field staff | ||||||||||
| Civil Service | 38.8 | 38.3 | 39.5 | 39.9 | 40.3 | |||||
| Total Public Sector excluding Semi-State bodies | 322.5 | 325.8 | 332.2 | 336.1 | 339.1 | |||||
| Total Public Sector including Semi-State bodies | 373.9 | 376.2 | 385.1 | 389.6 | 393.2 | |||||
| Total Private Sector | 1,175.5 | 1,212.9 | 1,256.6 | 1,309.2 | 1,311.2 | |||||
| 1 Preliminary | ||||||||||
| Table A3 Seasonally adjusted monthly unemployment by sex - All persons aged 15-74 years | |||||||||
| Number of persons | Unemployment rate (%) | ||||||||
| Males | Females | All Persons | Males | Females | All Persons | ||||
| 2015 | August | 124,500 | 71,300 | 195,900 | 10.5 | 7.4 | 9.1 | ||
| September | 126,300 | 70,600 | 196,900 | 10.6 | 7.3 | 9.1 | |||
| October | 127,800 | 70,400 | 198,200 | 10.8 | 7.2 | 9.2 | |||
| November | 128,400 | 68,800 | 197,100 | 10.8 | 7.1 | 9.1 | |||
| December | 126,800 | 66,600 | 193,400 | 10.7 | 6.8 | 8.9 | |||
| 2016 | January | 121,300 | 62,900 | 184,200 | 10.2 | 6.5 | 8.5 | ||
| February | 118,500 | 62,400 | 180,900 | 10.0 | 6.4 | 8.4 | |||
| March | 116,300 | 64,200 | 180,400 | 9.8 | 6.6 | 8.3 | |||
| April | 115,200 | 67,600 | 182,900 | 9.6 | 6.9 | 8.4 | |||
| May | 114,400 | 68,800 | 183,200 | 9.5 | 7.0 | 8.4 | |||
| June | 112,900 | 68,700 | 181,600 | 9.4 | 6.9 | 8.3 | |||
| July | 111,200 | 65,700 | 177,000 | 9.3 | 6.6 | 8.1 | |||
| August | 108,900 | 64,400 | 173,400 | 9.1 | 6.5 | 7.9 | |||
| September | 103,100 | 61,700 | 164,800 | 8.6 | 6.2 | 7.5 | |||
| October | 97,300 | 61,100 | 158,400 | 8.1 | 6.2 | 7.2 | |||
| November | 92,900 | 61,100 | 154,000 | 7.8 | 6.2 | 7.0 | |||
| December | 90,700 | 61,400 | 152,000 | 7.6 | 6.2 | 6.9 | |||
| 2017 | January | 89,800 | 61,500 | 151,300 | 7.5 | 6.1 | 6.9 | ||
| February | 89,300 | 60,600 | 149,900 | 7.4 | 6.1 | 6.8 | |||
| March | 88,000 | 57,700 | 145,700 | 7.3 | 5.8 | 6.6 | |||
| April | 87,300 | 52,100 | 139,400 | 7.3 | 5.2 | 6.4 | |||
| May | 86,700 | 49,800 | 136,500 | 7.2 | 5.0 | 6.2 | |||
| June | 85,700 | 48,600 | 134,300 | 7.2 | 4.9 | 6.1 | |||
| July | 85,000 | 50,000 | 135,000 | 7.1 | 5.0 | 6.2 | |||
| August | 83,600 | 49,500 | 133,200 | 7.0 | 5.0 | 6.1 | |||
| Table A4 Seasonally adjusted monthly unemployment by sex - persons aged 15-24 years | |||||||||
| Number of persons | Unemployment rate (%) | ||||||||
| Males | Females | All Persons | Males | Females | All Persons | ||||
| 2015 | August | 23,000 | 14,900 | 37,900 | 22.8 | 17.0 | 20.1 | ||
| September | 23,500 | 15,200 | 38,600 | 23.3 | 17.4 | 20.5 | |||
| October | 23,300 | 14,700 | 38,000 | 23.3 | 17.0 | 20.4 | |||
| November | 23,200 | 14,100 | 37,300 | 23.2 | 16.4 | 20.1 | |||
| December | 22,900 | 13,200 | 36,100 | 22.8 | 15.4 | 19.4 | |||
| 2016 | January | 22,400 | 11,700 | 34,000 | 22.0 | 13.8 | 18.2 | ||
| February | 22,000 | 11,600 | 33,600 | 21.3 | 13.4 | 17.7 | |||
| March | 21,700 | 12,600 | 34,300 | 20.6 | 14.0 | 17.6 | |||
| April | 21,700 | 14,200 | 35,900 | 20.2 | 15.0 | 17.8 | |||
| May | 21,700 | 14,700 | 36,400 | 19.8 | 15.3 | 17.7 | |||
| June | 21,600 | 14,600 | 36,200 | 19.5 | 15.1 | 17.4 | |||
| July | 21,500 | 14,300 | 35,800 | 19.3 | 14.9 | 17.3 | |||
| August | 21,400 | 14,100 | 35,500 | 19.2 | 14.8 | 17.2 | |||
| September | 20,700 | 13,900 | 34,500 | 18.7 | 14.6 | 16.8 | |||
| October | 20,200 | 14,100 | 34,300 | 18.5 | 14.7 | 16.7 | |||
| November | 19,100 | 14,000 | 33,000 | 17.8 | 14.5 | 16.2 | |||
| December | 17,500 | 13,800 | 31,200 | 16.7 | 14.1 | 15.5 | |||
| 2017 | January | 15,500 | 13,100 | 28,700 | 15.2 | 13.5 | 14.4 | ||
| February | 14,800 | 12,700 | 27,500 | 14.6 | 13.1 | 13.9 | |||
| March | 15,700 | 12,500 | 28,200 | 15.4 | 12.9 | 14.2 | |||
| April | 17,200 | 12,200 | 29,400 | 16.6 | 12.7 | 14.7 | |||
| May | 18,200 | 12,100 | 30,300 | 17.5 | 12.8 | 15.3 | |||
| June | 18,400 | 12,300 | 30,700 | 18.0 | 13.1 | 15.7 | |||
| July | 18,200 | 12,500 | 30,700 | 17.8 | 13.5 | 15.7 | |||
| August | 17,700 | 12,000 | 29,600 | 17.3 | 13.0 | 15.3 | |||
| Table A5 Seasonally adjusted monthly unemployment by sex - persons aged 25-74 years | |||||||||
| Number of persons | Unemployment rate (%) | ||||||||
| Males | Females | All Persons | Males | Females | All Persons | ||||
| 2015 | August | 101,500 | 56,400 | 158,000 | 9.3 | 6.4 | 8.0 | ||
| September | 102,800 | 55,500 | 158,200 | 9.4 | 6.3 | 8.0 | |||
| October | 104,600 | 55,700 | 160,300 | 9.6 | 6.3 | 8.1 | |||
| November | 105,200 | 54,700 | 159,900 | 9.7 | 6.1 | 8.1 | |||
| December | 103,900 | 53,400 | 157,300 | 9.6 | 6.0 | 8.0 | |||
| 2016 | January | 99,000 | 51,200 | 150,200 | 9.1 | 5.8 | 7.6 | ||
| February | 96,500 | 50,800 | 147,300 | 8.9 | 5.7 | 7.5 | |||
| March | 94,600 | 51,500 | 146,200 | 8.7 | 5.8 | 7.4 | |||
| April | 93,500 | 53,500 | 147,000 | 8.6 | 6.0 | 7.4 | |||
| May | 92,700 | 54,100 | 146,800 | 8.5 | 6.1 | 7.4 | |||
| June | 91,300 | 54,100 | 145,400 | 8.4 | 6.0 | 7.3 | |||
| July | 89,700 | 51,500 | 141,200 | 8.2 | 5.7 | 7.1 | |||
| August | 87,600 | 50,400 | 137,900 | 8.0 | 5.6 | 6.9 | |||
| September | 82,500 | 47,800 | 130,300 | 7.6 | 5.3 | 6.6 | |||
| October | 77,100 | 47,000 | 124,100 | 7.1 | 5.3 | 6.3 | |||
| November | 73,900 | 47,100 | 121,000 | 6.8 | 5.3 | 6.1 | |||
| December | 73,200 | 47,600 | 120,800 | 6.7 | 5.3 | 6.1 | |||
| 2017 | January | 74,300 | 48,300 | 122,600 | 6.8 | 5.4 | 6.1 | ||
| February | 74,500 | 47,900 | 122,400 | 6.8 | 5.3 | 6.1 | |||
| March | 72,400 | 45,100 | 117,500 | 6.6 | 5.0 | 5.9 | |||
| April | 70,100 | 39,900 | 110,000 | 6.4 | 4.5 | 5.5 | |||
| May | 68,500 | 37,700 | 106,200 | 6.3 | 4.2 | 5.3 | |||
| June | 67,300 | 36,400 | 103,600 | 6.2 | 4.1 | 5.2 | |||
| July | 66,800 | 37,500 | 104,300 | 6.1 | 4.2 | 5.2 | |||
| August | 66,000 | 37,500 | 103,500 | 6.0 | 4.2 | 5.2 | |||
Purpose of Survey
The Quarterly National Household Survey (QNHS) began in September 1997, replacing the annual April Labour Force Survey (LFS). The purpose of the survey is the production of quarterly labour force estimates and occasional reports on special social topics. The survey meets the requirements of Council Regulation (EC) No. 577/98, adopted in March 1998, which requires the introduction of quarterly labour force surveys in EU member states.
Reference Period
Information is collected continuously throughout the year from households surveyed each week in each quarter. Up to and including the fourth quarter of 2008 the Quarterly National Household Survey (QNHS) operated on a seasonal quarter basis since its establishment in Q4 1997. As of the first quarter of 2009 the QNHS is now undertaken on a calendar quarter basis.
The reference quarters for survey results are:
Q1 - January to March, Q2 - April to June, Q3 - July to September and Q4 - October to December.
Data Collection
Information is collected on tablet computers, using computer-assisted personal interview (CAPI) software.
Sample Design
A two-stage sample design is used. A new sample was introduced in Q4 2012 following the 2011 Census of Population and an additional new sample also based on the 2011 Census of Population will be introduced incrementally from Q3 2016. The sample frame of households is clustered into blocks (small areas) with each block containing a minimum of 60 occupied households on the night of the 2011 Census of Population. In the case of the sample introduced in 2012 the sample frame is stratified using administrative county and population density while the sample introduced in 2016 is stratified using administrative county and the Pobal HP (Haase and Pratschke) Deprivation Index. In the first stage 1,300 blocks are selected using Probability Proportional to Size (PPS) sampling and in the second stage 20 households are selected using Simple Random Sampling (SRS). This ensures that each household in the sample frame has an equal probability of selection and results in a total quarterly sample of 26,000 households. The actual achieved sample varies over time depending on the level of response.
The number of valid responding households in Q2 2017 was 15,287.
Households are asked to take part in the survey for five consecutive quarters and are then replaced by other households in the same block. Thus, one fifth of the households in the survey are replaced each quarter and the QNHS sample involves an overlap of 80% between consecutive quarters and 20% between the same quarter in consecutive years. As the new sample based on the 2011 Census of Population was introduced incrementally across each quarter from Q4 2012 to Q4 2013, the new sample is fully effective from Q4 2013.
The survey results are weighted to agree with population estimates broken down by age, sex and region and are also calibrated to nationality control totals. The population estimates for April of each year are published in a separate release.
Statistical significance
All estimates based on sample surveys are subject to error, some of which is measurable. Where an estimate is statistically significantly different from another estimate it means that we can be 95% confident that differences between those two estimates are not due to sampling error.
Usual residence and de facto population concepts
Up to and including Q1 2006 the annual population estimates were calculated using the de facto definition of population (i.e. all persons present in the state). Since Q2 2006 a new concept of usual residence has been used, i.e. all persons usually resident and present in the state plus absent persons who are usually resident in Ireland but are temporarily away from home and outside the state.
ILO Labour Force Classification
The primary classification used for the QNHS results is the ILO (International Labour Office) labour force classification. Labour Force Survey data on this basis have been published since 1988. The ILO classification distinguishes the following main subgroups of the population aged 15 or over:
In Employment: Persons who worked in the week before the survey for one hour or more for payment or profit, including work on the family farm or business and all persons who had a job but were not at work because of illness, holidays etc. in the week.
Unemployed: Persons who, in the week before the survey, were without work and available for work within the next two weeks, and had taken specific steps, in the preceding four weeks, to find work. It should be noted that as per Eurostat’s operational implementation, the upper age limit for classifying a person as unemployed is 74 years.
Inactive Population (not in labour force): All other persons.
The labour force comprises persons employed plus unemployed.
Participation, Employment and Unemployment Rates
The rates given in this release are based on the ILO classification. The Participation Rate is the number of persons in the labour force expressed as a percentage of the total population aged 15 or over. The Employment Rate is the number of employed aged 15 to 64 expressed as a percentage of the total population aged 15 to 64.
To ensure coherence with Unemployment Rates produced by Eurostat, the CSO has introduced methodological changes as of Q2 2015 in the calculation of these rates. Previously the Unemployment Rate was calculated as the number of unemployed expressed as a percentage of the total labour force aged 15 and over. The changes introduced limit the labour force to persons aged 15-74 and this excludes a small number of persons aged 75 and over in employment from the total labour force used in the calculation. The overall impact of this change is minimal.
Duration of Unemployment
The duration of unemployment is the length of time since a person last had a job or began looking for work, whichever is more recent. The long-term unemployment rate is the number of persons unemployed for one year or more expressed as a percentage of the total labour force aged 15 to 74 years.
Part-time Underemployment
The calculation of part-time underemployment is based on ILO and Eurostat recommendations and uses the following criteria to derive underemployment:
1. Working part-time
2. Willing to work additional hours
3. Available to work additional hours
This indicator is only available from quarter 3 2008 onwards as estimates prior to that quarter were based on one single question which included the need for the person to be looking for additional work. From quarter 3 2008 the indicator is derived from a series of separate questions which allow this requirement to be excluded.
Potential Additional Labour Force
The Potential Additional Labour Force (PALF) is the sum of the two groups ‘persons seeking work but not immediately available’ and ‘persons available for work but not seeking’. Persons in the PALF are not part of the standard labour force, which encompasses only employed and unemployed people but however they have a stronger attachment to the labour market than other persons not in the labour force. The new indicators have been defined by the European statistical office (Eurostat) following extensive international discussion regarding appropriate indicators to supplement the unemployment rate.
Further background information regarding the methodology and approach adopted by Eurostat in building these new indicators can be found at the link below. European wide and individual country results are also available from this link: Click here
Principal Economic Status Classification
Results are also available using the Principal Economic Status (PES) classification which was used in the Labour Force Survey and the Census of Population. The PES classification is based on a single question in which respondents are asked what is their usual situation with regard to employment and given the following response categories:
• At work
• Unemployed
• Student
• Engaged on home duties
• Retired
• Other.
NACE Industrial Classification
The QNHS sectoral employment figures are based on the EU NACE Rev. 2 (Nomenclature générale des activités économiques dans la Communauté européenne) classification as defined in Council Regulation (EC) no 1893/2006. Fourteen NACE sub-categories are distinguished in Table 2 of this release. From Q1 2009 NACE Rev. 2 has been adopted as the primary classification of industrial sectors for use in QNHS outputs. From Q4 1997 to Q4 2008 the NACE Rev. 1.1 classification had been in use.
NACE Rev. 2 classification is more detailed than the NACE Rev. 1.1 classification. In particular more sections are now identified for services activities with the aim of better capturing economic activity within services. In cases where there is a direct one to one correspondence (e.g. section H ‘Hotels and restaurants’ in NACE Rev. 1.1 directly corresponds to section I ‘Accommodation and food service activities’ sector in NACE Rev. 2) then the two different series can be expected to be broadly comparable.
However, the series will not be exactly the same, as the process of applying NACE Rev. 2 involved a very detailed recoding process whereby the new NACE classification was applied to each record in each quarter. The detailed nature of this process means it should be expected that even in the case of a one to one correspondence between a NACE Rev. 2 and NACE Rev. 1.1 section; minor differences in the level of the estimates may be seen.
To facilitate analysis and the running of seasonal adjustment on the time series NACE Rev. 2 estimates have been produced from Q1 1998 onwards. As of Q2 2009 only NACE Rev. 2 estimates will be published.
Occupation Classification
As a result of changes to the European regulations governing the Quarterly Labour Force Survey (implemented in Ireland using the QNHS) the CSO is obliged to report occupational coding data to Eurostat based on the new Europe wide classification ISCO-08 from Q1 2011 onwards. To allow this requirement to be met the CSO has changed to using UK SOC2010 as the primary classification used in collecting the data. ISCO-08 is then derived from UK SOC2010. This change has also been implemented for the Census 2011 results.
The previously used classification for publication purposes in Ireland was UK SOC1990 and this cannot be directly compared to the new UK SOC2010 classification as all occupations have been reclassified accordingly. This newer classification reflects the evolution over a period of time of certain occupational areas which were developing rapidly, both in terms of their scale and the complexity of work organisation. One particular example which highlights the impact of these changes on published results is the reclassifying of farmers from the major occupation grouping of ‘Managers and administrators’ in SOC1990 to the major occupation grouping of ‘Skilled trades’ in SOC2010.
Results for occupations coded to the new SOC2010 classification have now been recoded for historical quarters back to Q1 2007 to provide a longer and consistent time series for users.
Further information regarding SOC 2010 is available from this link: Click here
NUTS2 and NUTS3 Regions
The regional classifications in this release are based on the NUTS (Nomenclature of Territorial Units) classification used by Eurostat. The NUTS3 regions correspond to the eight Regional Authorities established under the Local Government Act, 1991 (Regional Authorities) (Establishment) Order, 1993, which came into operation on 1 January 1994. The NUTS2 regions, which were proposed by Government and agreed by Eurostat in 1999, are groupings of the NUTS3 regions. The composition of the regions is set out below.
| Border, Midland and Western NUTS2 Region | Southern and Eastern NUTS2 Region | ||
| Border | Cavan | Dublin | Dublin City |
| Donegal | Dun Laoghaire-Rathdown | ||
| Leitrim | Fingal | ||
| Louth | South Dublin | ||
| Monaghan | |||
| Sligo | Mid-East | Kildare | |
| Meath | |||
| Midland | Laois | Wicklow | |
| Longford | Mid-West | Clare | |
| Offaly | Limerick City | ||
| Westmeath | Limerick County | ||
| North Tipperary | |||
| West | Galway City | ||
| Galway County | South-East | Carlow | |
| Mayo | Kilkenny | ||
| Roscommon | South Tipperary | ||
| Waterford City | |||
| Waterford County | |||
| Wexford | |||
| South-West | Cork City | ||
| Cork County | |||
| Kerry | |||
Seasonal Adjustment Methodology
To correct for typical seasonal patterns, the series presented in Table 3 have been seasonally adjusted. Since Q1 2011 the seasonal adjustment of data from the QNHS is completed by applying the X-12-ARIMA model, developed by the U.S. Census Bureau. Seasonal adjustment is conducted using the direct approach, where each individual series is independently adjusted. As a result of this direct seasonal adjustment approach it should be noted that the sum of any component series may not be equal to seasonally adjusted series to which these components belong, e.g. the seasonally adjusted number of males in employment and the seasonally adjusted number of females in employment will not necessarily add up to the total employment on a seasonally adjusted basis.
The X-12-ARIMA method has the X-11 moving averages process at its core, but builds on this by providing options for pre-treating the series using a regARIMA approach for prior adjustment and series extension. In essence this methodology will estimate seasonal factors while taking account of calendar effects (e.g timing of Easter), outliers, temporary changes and level shifts.
For additional information on the use of X-12-ARIMA see detailed note in the Q1 2011 QNHS release.
Monthly Unemployment Estimates
Monthly unemployment estimates were introduced by the CSO in June 2015 for reference month May. The latest monthly unemployment estimates have been revised with the publication of new QNHS benchmark estimates for this quarter. These revisions are included in Tables A3, A4 and A5 of this release.
In line with Eurostat practice, the seasonally adjusted quarterly unemployment volumes and rates included in Table 3 of this release are now calculated as the average of the relevant 3 months of the quarter from the new monthly unemployment series. This approach ensures consistency between these new seasonally adjusted monthly series and the seasonally adjusted quarterly series. The overall impact of this change is minimal.
Reliability of Estimates Presented
Estimates for number of persons where there are less than 30 persons in a cell are too small to be considered reliable. These estimates are presented with an asterisk (*) in the relevant tables.
Where there are 30-49 persons in a cell, estimates are considered to have a wider margin of error and should be treated with caution. These cells are presented with parentheses [ ].
In the case of rates, these limits apply to the denominator used in generating the rate. In the case of annual changes, both the current year and the preceding year are taken into account when deciding whether the estimate should be suppressed or flagged as having a wider margin of error.
Calculation of Rates and Estimates of Change
Rates and estimates of change presented in this release are calculated from whole unrounded numbers. Due to rounding, these may differ from the rates and estimates of change calculated from the rounded volumes presented in the tables.
Interpretation of volume and rate changes
The overall change in the number of people employed, unemployed, in the labour force and not in the labour force is a function both of changes in the population as well as changes in the proportion of people with that status. Therefore, in interpreting changes in the volume of persons who are employed, unemployed etc, both changes in population and changes in the relevant rates should be considered.
In recent years there has been a natural decline in the number of people in younger age groups arising from the falling number of births through the 1980’s until 1994 when a low of 48,255 births was recorded (compared with 74,278 in 2009). For example there were 326,030 people born in Ireland between 1982 and 1986 and, all other things being equal, these people would have been in the 20-24 age group in 2006. However between 1986 and 1990 there were nearly 50,000 fewer births which would create a natural decrease in the 20-24 age group of close to 50,000 between 2006 and 2010.
In addition to natural changes in population, net migration has been a significant feature of population change in Ireland in recent years and net migration has also been most heavily concentrated in younger age groups. Evidence shows that migration is also most heavily concentrated in the 20-24 and 25-34 age groups. As a result of both natural decrease and net outward migration, the population of persons in the younger age groups has fallen and this should be borne in mind when considering the changes in the number of people in these age groups who are employed, unemployed and in the labour force.
Additional Data Series
Additional data series previously included in the QNHS release can still be accessed through the CSO website and are available from this link: Click here
Labour market data can also be accessed from Statbank, the CSO’s main data dissemination service, through the CSO website from this link: Click here
Implications of Census 2016 Final Results
The QNHS results are weighted using population estimates which are generated on anongoing basis. Historically every 5 years the Census of Population results have been used to revise these population estimates, and QNHS results are revised as a consequence.
The population concept of usual residence is used for the QNHS, i.e. all persons usually resident and present in the State plus absent persons who are usually resident in Ireland but are temporarily away from home and outside the State.
The final Census count was published on April 6 2017. The total for this usually resident population concept which was enumerated on Census Night, April 24 2016, was 4,739,597 persons, while the existing estimate for the usually resident population for April 2016 is 4,673,700 as detailed in the 2016 Population and Migration Estimates release. There is a difference, therefore, of just over 65,900 or 1.4% between the two figures.
The CSO is in the process of revising the population estimates for 2012 to 2016 based on this final Census count. Estimates of persons employed and unemployed will then be revised in line with the higher population totals when available. However, in terms of trends, the impacts would be expected to be relatively low as the population difference is introduced incrementally over the period. In the case of rates (unemployment rate, employment rate, participation rate) these are likely to have a lower level of difference as the population increase would be reflected both in the denominator and the numerator. In the case of the unemployment rate for example, changes in both the numbers unemployed and the numbers in the labour force could leave unemployment rates relatively unchanged.
Once the revision work has been completed the CSO will issue an explanatory note on the subject along with the revised labour market estimates.
Changes to CSO Labour Market Statistics
Effective from Q3 2017, the QNHS is being replaced by a new Labour Force Survey (LFS).This is part of a major Household Survey Development (HSD) project that the CSO has been engaged in over the past number of years with the aim of expanding the range of social statistics to meet new needs for information on households and persons. This new survey includes the introduction of Computer Assisted Telephone Interviewing (CATI), a redesigned questionnaire and enhancements to the survey methodology.
The introduction of such large scale changes will inevitably lead to discontinuity in some series and this is in line with international experience of introducing such large scale changes. However the CSO will seek to limit such discontinuities by back-casting of existing QNHS data using the results from the new survey.
The first results from this new survey, which will be for Q3 2017, will be published before the end of January 2018. These will incorporate the revision of population estimates arising from the 2016 Census of Population along with a back-cast series of the existing data for the QNHS.
Participating Households
The Central Statistics Office wishes to thank the participating households for their co-operation in agreeing to take part in the survey and for facilitating the collection of the relevant data.
 Hide Background Notes
Scan the QR code below to view this release online or go to
http://www.cso.ie/en/releasesandpublications/er/qnhs/quarterlynationalhouseholdsurveyquarter22017/
 Show Table 1 Persons aged 15 years and over classified by sex and ILO Economic Status
 Hide Table 1 Persons aged 15 years and over classified by sex and ILO Economic Status