
| Networked Gas Consumption by Sector 2011-2019 | ||||
| % of row | Gigawatt hours | |||
| Year | % Power Plants | % Non-Residential | % Residential | Total |
| 2011 | 64 | 21 | 15 | 53,339 |
| 2012 | 62 | 23 | 15 | 51,059 |
| 2013 | 60 | 24 | 16 | 48,981 |
| 2014 | 60 | 25 | 15 | 47,167 |
| 2015 | 59 | 26 | 15 | 47,503 |
| 2016 | 62 | 24 | 13 | 53,704 |
| 2017 | 63 | 24 | 13 | 54,726 |
| 2018 | 61 | 25 | 14 | 57,129 |
| 2019 | 58 | 30 | 13 | 57,744 |
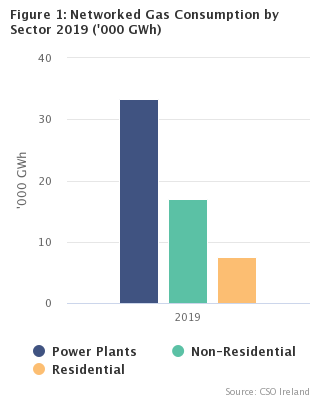
Power plants accounted for 58% of total networked gas consumption in 2019, compared with 30% by the non-residential sector and 13% by the residential sector (see Headline Table, Table 1 and Figure 1). This pattern was broadly similar in the period from 2011 to 2018. Total consumption in 2019 was 57,744 gigawatt hours, an increase of 1.1% over 2018 consumption, and the highest consumption over the 2011-2019 period. The increase in consumption was comprised of a 5.3% decrease in consumption by power plants, a 21.7% increase by the non-residential sector and a 6.9% decrease by the residential sector (see Tables 2B, 2C, and 2D).
There is strong seasonal variation in networked gas consumption by households. The January to March quarter has by far the highest consumption, at 40% of the annual total in 2019. In contrast, July to September accounted for only 8% of total residential consumption in 2019 (see Table 2D and Figure 2). Seasonal variation was less evident in other sectors, with the third quarter of 2019 accounting for 26% of total usage by power plants and for 21% of consumption in the non-residential sector (see Tables 2B and 2C).
| X-axis label | Jan-Mar | Apr-Jun | Jul-Sep | Oct-Dec |
|---|---|---|---|---|
| 2011 | 5.762 | 2.029 | 0.681 | 1.946 |
| 2012 | 4.363 | 2.556 | 0.596 | 2.537 |
| 2013 | 4.647 | 2.925 | 0.427 | 1.914 |
| 2014 | 4.454 | 1.962 | 0.416 | 1.804 |
| 2015 | 4.522 | 2.151 | 0.557 | 1.861 |
| 2016 | 3.989 | 2.416 | 0.415 | 2.002 |
| 2017 | 3.992 | 1.989 | 0.483 | 2.036 |
| 2018 | 4.658 | 2.445 | 0.367 | 2.305 |
| 2019 | 3.773 | 2.301 | 0.501 | 2.358 |
Table 3B shows residential consumption by county. Dublin postal districts accounted for 45% of total residential consumption in 2019, followed by Dublin County, which accounted for a further 17%, and Cork at 10%. Three counties (Donegal, Leitrim, and Sligo) are not connected to the gas network.
Table 4B shows residential consumption for individual Dublin postal districts. Dublin 15, with 360 GWh, had the highest residential consumption in 2019, followed by Dublin 14 with 231 GWh. The postal districts with the lowest residential consumption were Dublin 2 (29 GWh) and Dublin 1 (31 GWh).
Table 5C provides median residential consumption figures at Dublin postal district level. Dublin 2 at 6,366 kWh, Dublin 1 at 6,536 kWh, and Dublin 8 at 7,663 kWh had the lowest median consumption figures in 2019. These areas were all well below the median consumption of 10,154 kWh for all households in the Dublin postal district areas. In contrast, Dublin 14 had the highest median consumption (13,048 kWh), followed by Dublin 6W (12,248 kWh) and Dublin 5 (11,880 kWh).
| X-axis label | Median consumption |
|---|---|
| Meath | 10.572 |
| Dublin County | 10.473 |
| Cavan | 10.387 |
| Kildare | 10.344 |
| Dublin Postal Districts | 10.154 |
| Offaly | 9.952 |
| Wicklow | 9.644 |
| Laois | 9.547 |
| Carlow | 9.538 |
| Wexford | 9.36 |
| Tipperary | 9.271 |
| Louth | 9.243 |
| Kilkenny | 9.15 |
| Westmeath | 9.118 |
| Monaghan | 8.884 |
| Galway | 8.665 |
| Limerick | 8.617 |
| Clare | 8.308 |
| Cork | 8.279 |
| Waterford | 7.891 |
| Mayo | 7.302 |
Table 5B and Figure 3 show the median residential consumption at county level. Figures for Kerry, Longford, Roscommon and Wexford are based on low numbers of meters (see Table 6B) and have been omitted from the graph. Out of the other counties, Mayo had the lowest median consumption in 2019 at 7,302 kWh, while Meath had the highest median consumption at 10,572 kWh. Table 5D shows the quarterly median consumption figures for 2019 at county level.
Tables 6A and 6B show the number of gas meters by county. Dublin postal district areas accounted for 43% of both non-residential and residential meters in 2019. The number of non-residential meters increased by 9.6% from 26,523 in 2011 to 29,081 in 2018; since then, it has decreased by 0.5% to 28,928 in 2019. The number of residential meters has increased by 7.7% from 632,935 in 2011 to 681,412 in 2019.
| Table 1 Networked Gas Consumption by Sector 2011-2019 | |||||||
| Gigawatt hours | % of row | ||||||
| Year | Power Plants | Non-Residential | Residential | Total | % Power Plants | % Non-Residential | % Residential |
| 2011 | 33,960 | 11,379 | 8,000 | 53,339 | 64 | 21 | 15 |
| 2012 | 31,553 | 11,804 | 7,702 | 51,059 | 62 | 23 | 15 |
| 2013 | 29,264 | 11,976 | 7,740 | 48,981 | 60 | 24 | 16 |
| 2014 | 28,520 | 11,791 | 6,856 | 47,167 | 60 | 25 | 15 |
| 2015 | 27,830 | 12,422 | 7,251 | 47,503 | 59 | 26 | 15 |
| 2016 | 33,536 | 13,004 | 7,164 | 53,704 | 62 | 24 | 13 |
| 2017 | 34,574 | 13,091 | 7,061 | 54,726 | 63 | 24 | 13 |
| 2018 | 35,119 | 13,998 | 8,011 | 57,129 | 61 | 25 | 14 |
| 2019 | 33,245 | 17,039 | 7,460 | 57,744 | 58 | 30 | 13 |
| Table 2A Networked Gas Consumption by Quarter 2011-2019 | |||||||||
| Gigawatt hours | % of row | ||||||||
| Year | Jan-Mar | Apr-Jun | Jul-Sep | Oct-Dec | Total | % Q1 | % Q2 | % Q3 | % Q4 |
| 2011 | 16,894 | 12,407 | 11,691 | 12,347 | 53,339 | 32 | 23 | 22 | 23 |
| 2012 | 14,995 | 12,661 | 10,486 | 12,918 | 51,059 | 29 | 25 | 21 | 25 |
| 2013 | 14,880 | 12,539 | 9,880 | 11,681 | 48,981 | 30 | 26 | 20 | 24 |
| 2014 | 13,590 | 11,806 | 10,658 | 11,113 | 47,167 | 29 | 25 | 23 | 24 |
| 2015 | 13,807 | 11,277 | 10,778 | 11,640 | 47,503 | 29 | 24 | 23 | 25 |
| 2016 | 14,297 | 13,600 | 12,092 | 13,715 | 53,704 | 27 | 25 | 23 | 26 |
| 2017 | 14,697 | 13,644 | 12,953 | 13,432 | 54,726 | 27 | 25 | 24 | 25 |
| 2018 | 14,990 | 14,975 | 12,940 | 14,224 | 57,129 | 26 | 26 | 23 | 25 |
| 2019 | 15,125 | 15,465 | 12,783 | 14,370 | 57,744 | 26 | 27 | 22 | 25 |
| Table 2B Networked Gas Consumption by Quarter for Power Plants Sector 2011-2019 | |||||||||
| Gigawatt hours | % of row | ||||||||
| Year | Jan-Mar | Apr-Jun | Jul-Sep | Oct-Dec | Total | % Q1 | % Q2 | % Q3 | % Q4 |
| 2011 | 9,153 | 8,086 | 8,742 | 7,978 | 33,960 | 27 | 24 | 26 | 23 |
| 2012 | 8,423 | 7,670 | 7,523 | 7,937 | 31,553 | 27 | 24 | 24 | 25 |
| 2013 | 7,688 | 7,089 | 7,183 | 7,304 | 29,264 | 26 | 24 | 25 | 25 |
| 2014 | 6,642 | 7,236 | 7,891 | 6,751 | 28,520 | 23 | 25 | 28 | 24 |
| 2015 | 6,584 | 6,435 | 7,716 | 7,094 | 27,830 | 24 | 23 | 28 | 25 |
| 2016 | 7,349 | 8,355 | 9,044 | 8,789 | 33,536 | 22 | 25 | 27 | 26 |
| 2017 | 7,715 | 8,757 | 9,754 | 8,348 | 34,574 | 22 | 25 | 28 | 24 |
| 2018 | 7,129 | 9,426 | 9,821 | 8,743 | 35,119 | 20 | 27 | 28 | 25 |
| 2019 | 7,097 | 9,040 | 8,682 | 8,427 | 33,245 | 21 | 27 | 26 | 25 |
| Table 2C Networked Gas Consumption by Quarter for Non-Residential Sector 2011-2019 | |||||||||
| Gigawatt hours | % of row | ||||||||
| Year | Jan-Mar | Apr-Jun | Jul-Sep | Oct-Dec | Total | % Q1 | % Q2 | % Q3 | % Q4 |
| 2011 | 3,534 | 2,704 | 2,291 | 2,849 | 11,379 | 31 | 24 | 20 | 25 |
| 2012 | 3,360 | 3,020 | 2,375 | 3,048 | 11,804 | 28 | 26 | 20 | 26 |
| 2013 | 3,703 | 3,154 | 2,246 | 2,873 | 11,976 | 31 | 26 | 19 | 24 |
| 2014 | 3,609 | 2,952 | 2,318 | 2,912 | 11,791 | 31 | 25 | 20 | 25 |
| 2015 | 3,812 | 3,057 | 2,504 | 3,048 | 12,422 | 31 | 25 | 20 | 25 |
| 2016 | 3,861 | 3,259 | 2,592 | 3,292 | 13,004 | 30 | 25 | 20 | 25 |
| 2017 | 3,852 | 3,183 | 2,687 | 3,369 | 13,091 | 29 | 24 | 21 | 26 |
| 2018 | 4,215 | 3,452 | 2,704 | 3,627 | 13,998 | 30 | 25 | 19 | 26 |
| 2019 | 5,010 | 4,478 | 3,540 | 4,010 | 17,039 | 29 | 26 | 21 | 24 |
| Table 2D Networked Gas Consumption by Quarter for Residential Sector 2011-2019 | |||||||||
| Gigawatt hours | % of row | ||||||||
| Year | Jan-Mar | Apr-Jun | Jul-Sep | Oct-Dec | Total | % Q1 | % Q2 | % Q3 | % Q4 |
| 2011 | 4,206 | 1,616 | 657 | 1,520 | 8,000 | 53 | 20 | 8 | 19 |
| 2012 | 3,212 | 1,970 | 587 | 1,932 | 7,702 | 42 | 26 | 8 | 25 |
| 2013 | 3,489 | 2,296 | 451 | 1,504 | 7,740 | 45 | 30 | 6 | 19 |
| 2014 | 3,338 | 1,618 | 449 | 1,450 | 6,856 | 49 | 24 | 7 | 21 |
| 2015 | 3,411 | 1,785 | 558 | 1,498 | 7,251 | 47 | 25 | 8 | 21 |
| 2016 | 3,088 | 1,986 | 457 | 1,633 | 7,164 | 43 | 28 | 6 | 23 |
| 2017 | 3,130 | 1,703 | 512 | 1,716 | 7,061 | 44 | 24 | 7 | 24 |
| 2018 | 3,646 | 2,096 | 414 | 1,854 | 8,011 | 46 | 26 | 5 | 23 |
| 2019 | 3,018 | 1,947 | 562 | 1,933 | 7,460 | 40 | 26 | 8 | 26 |
| Table 3A Networked Gas Consumption by County1 for Non-Residential Sector 2011-2019 | |||||||||
| Gigawatt hours | |||||||||
| County | 2011 | 2012 | 2013 | 2014 | 2015 | 2016 | 2017 | 2018 | 2019 |
| Carlow | 143 | 145 | 127 | 121 | 125 | 141 | 140 | 149 | 148 |
| Cavan | 409 | 389 | 430 | 507 | 520 | 626 | 687 | 750 | 824 |
| Clare | 117 | 108 | 113 | 98 | 106 | 117 | 120 | 126 | 148 |
| Cork | 2,741 | 3,027 | 2,992 | 2,941 | 3,034 | 3,155 | 3,082 | 3,148 | 5,859 |
| Dublin County | 615 | 651 | 618 | 574 | 594 | 591 | 600 | 625 | 849 |
| Dublin Postal Districts | 3,328 | 3,320 | 3,419 | 3,205 | 3,402 | 3,451 | 3,446 | 3,768 | 3,696 |
| Galway | 186 | 202 | 214 | 226 | 251 | 270 | 276 | 287 | 339 |
| Kerry | _ | _ | _ | _ | _ | _ | _ | 140 | 321 |
| Kildare | 617 | 647 | 680 | 697 | 764 | 776 | 775 | 816 | 777 |
| Kilkenny | 511 | 511 | 520 | 526 | 640 | 663 | 649 | 690 | 720 |
| Laois | 68 | 74 | 80 | 77 | 83 | 78 | 74 | 74 | 81 |
| Limerick | 812 | 784 | 767 | 755 | 754 | 800 | 794 | 844 | 792 |
| Longford | _ | _ | _ | _ | _ | _ | _ | 0 | 14 |
| Louth | 524 | 537 | 490 | 502 | 448 | 474 | 546 | 560 | 492 |
| Mayo | 220 | 249 | 258 | 271 | 285 | 288 | 291 | 300 | 332 |
| Meath | 147 | 152 | 182 | 214 | 227 | 241 | 247 | 272 | 273 |
| Monaghan | 43 | 38 | 65 | 91 | 116 | 121 | 93 | 91 | 48 |
| Offaly | 42 | 52 | 47 | 52 | 67 | 83 | 92 | 112 | 108 |
| Roscommon2 | 0 | 0 | 0 | 0 | 0 | 0 | 0 | 0 | 9 |
| Tipperary | 271 | 311 | 330 | 347 | 405 | 479 | 483 | 489 | 471 |
| Waterford | 326 | 345 | 342 | 289 | 293 | 344 | 376 | 398 | 381 |
| Westmeath | 101 | 117 | 146 | 144 | 146 | 141 | 134 | 148 | 134 |
| Wexford | _ | _ | _ | _ | _ | 9 | 50 | 64 | 79 |
| Wicklow | 157 | 147 | 158 | 155 | 162 | 156 | 135 | 147 | 144 |
| Total | 11,379 | 11,804 | 11,976 | 11,791 | 12,422 | 13,004 | 13,091 | 13,998 | 17,039 |
| 1 Three counties (Donegal, Leitrim, and Sligo) are not connected to the gas network | |||||||||
| 2 Meters in Roscommon are located only in the western part of Athlone | |||||||||
| – No consumption recorded | |||||||||
| Due to rounding, a value of 0 in this table indicates consumption of less than 0.5 GWh | |||||||||
| Table 3B Networked Gas Consumption by County1 for Residential Sector 2011-2019 | |||||||||
| Gigawatt hours | |||||||||
| County | 2011 | 2012 | 2013 | 2014 | 2015 | 2016 | 2017 | 2018 | 2019 |
| Carlow | 70 | 74 | 69 | 63 | 66 | 69 | 69 | 75 | 71 |
| Cavan | 17 | 18 | 19 | 15 | 17 | 18 | 17 | 18 | 18 |
| Clare | 46 | 43 | 46 | 42 | 45 | 45 | 46 | 51 | 46 |
| Cork | 858 | 784 | 819 | 719 | 748 | 762 | 721 | 858 | 777 |
| Dublin County | 1,280 | 1,248 | 1,296 | 1,133 | 1,202 | 1,147 | 1,177 | 1,312 | 1,235 |
| Dublin Postal Districts | 3,701 | 3,612 | 3,583 | 3,165 | 3,352 | 3,320 | 3,234 | 3,637 | 3,373 |
| Galway | 68 | 64 | 67 | 57 | 63 | 63 | 62 | 72 | 68 |
| Kerry | _ | _ | _ | _ | _ | _ | _ | 0 | 0 |
| Kildare | 402 | 384 | 350 | 338 | 367 | 335 | 359 | 413 | 383 |
| Kilkenny | 74 | 72 | 72 | 64 | 68 | 69 | 67 | 71 | 75 |
| Laois | 88 | 81 | 82 | 72 | 78 | 75 | 79 | 86 | 81 |
| Limerick | 273 | 247 | 257 | 234 | 239 | 245 | 237 | 271 | 254 |
| Longford | _ | _ | _ | _ | _ | _ | _ | _ | 0 |
| Louth | 241 | 239 | 239 | 209 | 227 | 225 | 227 | 254 | 238 |
| Mayo | 3 | 4 | 4 | 4 | 6 | 6 | 7 | 8 | 9 |
| Meath | 293 | 286 | 285 | 253 | 266 | 270 | 255 | 302 | 293 |
| Monaghan | 10 | 11 | 15 | 11 | 12 | 11 | 10 | 13 | 12 |
| Offaly | 20 | 19 | 19 | 17 | 18 | 18 | 18 | 20 | 19 |
| Roscommon2 | 1 | 1 | 1 | 1 | 1 | 1 | 1 | 1 | 1 |
| Tipperary | 99 | 82 | 86 | 77 | 75 | 79 | 78 | 89 | 80 |
| Waterford | 178 | 163 | 158 | 143 | 145 | 148 | 149 | 165 | 152 |
| Westmeath | 38 | 36 | 36 | 32 | 35 | 34 | 35 | 40 | 38 |
| Wexford | _ | _ | _ | _ | _ | 0 | 0 | 0 | 0 |
| Wicklow | 241 | 232 | 237 | 208 | 223 | 225 | 215 | 253 | 236 |
| Total | 8,000 | 7,702 | 7,740 | 6,856 | 7,251 | 7,164 | 7,061 | 8,011 | 7,460 |
| 1 Three counties (Donegal, Leitrim, and Sligo) are not connected to the gas network. | |||||||||
| 2 Meters in Roscommon are located only in the western part of Athlone | |||||||||
| – No consumption recorded | |||||||||
| Due to rounding, a value of 0 in this table indicates consumption of less than 0.5 GWh | |||||||||
| Table 4A Networked Gas Consumption by Dublin Postal District for Non-Residential Sector 2011-2019 | |||||||||
| Gigawatt hours | |||||||||
| Dublin Postal District | 2011 | 2012 | 2013 | 2014 | 2015 | 2016 | 2017 | 2018 | 2019 |
| Dublin 01 | 205 | 184 | 207 | 191 | 216 | 215 | 213 | 221 | 242 |
| Dublin 02 | 327 | 322 | 362 | 333 | 364 | 361 | 353 | 374 | 413 |
| Dublin 03 | 70 | 59 | 58 | 55 | 62 | 64 | 63 | 69 | 62 |
| Dublin 04 | 381 | 390 | 399 | 367 | 367 | 370 | 365 | 380 | 379 |
| Dublin 05 | 52 | 56 | 53 | 52 | 56 | 50 | 48 | 55 | 54 |
| Dublin 06 | 57 | 54 | 62 | 58 | 61 | 60 | 59 | 62 | 64 |
| Dublin 06W | 26 | 25 | 26 | 23 | 28 | 28 | 27 | 27 | 31 |
| Dublin 07 | 155 | 152 | 157 | 139 | 148 | 152 | 145 | 169 | 166 |
| Dublin 08 | 497 | 482 | 479 | 469 | 483 | 488 | 474 | 483 | 486 |
| Dublin 09 | 138 | 142 | 148 | 128 | 145 | 144 | 141 | 150 | 147 |
| Dublin 10 | 47 | 50 | 50 | 48 | 49 | 48 | 48 | 53 | 51 |
| Dublin 11 | 108 | 109 | 101 | 88 | 97 | 97 | 101 | 113 | 113 |
| Dublin 12 | 158 | 173 | 177 | 167 | 169 | 174 | 175 | 190 | 184 |
| Dublin 13 | 22 | 22 | 27 | 26 | 31 | 32 | 31 | 34 | 40 |
| Dublin 14 | 67 | 66 | 69 | 61 | 66 | 64 | 65 | 64 | 68 |
| Dublin 15 | 235 | 243 | 234 | 227 | 235 | 249 | 239 | 304 | 283 |
| Dublin 16 | 34 | 31 | 33 | 32 | 36 | 39 | 37 | 36 | 42 |
| Dublin 17 | 54 | 55 | 57 | 54 | 60 | 60 | 59 | 62 | 69 |
| Dublin 18 | 82 | 88 | 92 | 88 | 93 | 88 | 100 | 99 | 102 |
| Dublin 20 | 24 | 33 | 28 | 26 | 27 | 27 | 30 | 33 | 32 |
| Dublin 22 | 409 | 400 | 403 | 395 | 423 | 454 | 489 | 575 | 470 |
| Dublin 24 | 180 | 184 | 196 | 178 | 186 | 187 | 185 | 214 | 198 |
| Total | 3,328 | 3,320 | 3,419 | 3,205 | 3,402 | 3,451 | 3,446 | 3,768 | 3,696 |
| Table 4B Networked Gas Consumption by Dublin Postal District for Residential Sector 2011-2019 | |||||||||
| Gigawatt hours | |||||||||
| Dublin Postal District | 2011 | 2012 | 2013 | 2014 | 2015 | 2016 | 2017 | 2018 | 2019 |
| Dublin 01 | 40 | 32 | 35 | 32 | 32 | 32 | 31 | 35 | 31 |
| Dublin 02 | 30 | 25 | 33 | 28 | 29 | 28 | 29 | 32 | 29 |
| Dublin 03 | 157 | 147 | 154 | 136 | 143 | 140 | 135 | 154 | 141 |
| Dublin 04 | 195 | 192 | 199 | 174 | 183 | 185 | 178 | 176 | 179 |
| Dublin 05 | 239 | 228 | 230 | 196 | 210 | 208 | 194 | 223 | 207 |
| Dublin 06 | 176 | 159 | 174 | 158 | 168 | 171 | 161 | 188 | 168 |
| Dublin 06W | 110 | 119 | 86 | 101 | 110 | 105 | 104 | 121 | 109 |
| Dublin 07 | 201 | 176 | 182 | 157 | 167 | 166 | 153 | 178 | 164 |
| Dublin 08 | 135 | 138 | 119 | 121 | 124 | 122 | 123 | 138 | 126 |
| Dublin 09 | 214 | 220 | 226 | 197 | 209 | 205 | 198 | 226 | 210 |
| Dublin 10 | 77 | 78 | 70 | 63 | 64 | 57 | 63 | 69 | 64 |
| Dublin 11 | 237 | 224 | 224 | 194 | 207 | 204 | 198 | 218 | 205 |
| Dublin 12 | 233 | 243 | 210 | 179 | 213 | 203 | 202 | 227 | 207 |
| Dublin 13 | 170 | 165 | 168 | 144 | 155 | 154 | 148 | 164 | 170 |
| Dublin 14 | 228 | 229 | 227 | 201 | 212 | 211 | 207 | 213 | 231 |
| Dublin 15 | 387 | 366 | 379 | 332 | 352 | 353 | 334 | 387 | 360 |
| Dublin 16 | 207 | 208 | 209 | 183 | 193 | 182 | 197 | 213 | 174 |
| Dublin 17 | 61 | 59 | 57 | 49 | 51 | 50 | 48 | 53 | 52 |
| Dublin 18 | 165 | 161 | 171 | 150 | 157 | 158 | 150 | 176 | 162 |
| Dublin 20 | 43 | 42 | 43 | 39 | 37 | 36 | 39 | 45 | 39 |
| Dublin 22 | 146 | 149 | 143 | 128 | 117 | 131 | 128 | 145 | 134 |
| Dublin 24 | 250 | 253 | 244 | 203 | 219 | 219 | 214 | 258 | 211 |
| Total | 3,701 | 3,612 | 3,583 | 3,165 | 3,352 | 3,320 | 3,234 | 3,637 | 3,373 |
| Table 5A Networked Gas Median Consumption by Quarter for Residential Sector 2011-2019 | |||||
| Median kilowatt hours | |||||
| Year | Jan-Mar | Apr-Jun | Jul-Sep | Oct-Dec | Annual |
| 2011 | 5,762 | 2,029 | 681 | 1,946 | 11,461 |
| 2012 | 4,363 | 2,556 | 596 | 2,537 | 10,909 |
| 2013 | 4,647 | 2,925 | 427 | 1,914 | 10,898 |
| 2014 | 4,454 | 1,961 | 416 | 1,804 | 9,474 |
| 2015 | 4,522 | 2,151 | 557 | 1,861 | 9,920 |
| 2016 | 3,989 | 2,416 | 415 | 2,001 | 9,716 |
| 2017 | 3,992 | 1,989 | 483 | 2,036 | 9,431 |
| 2018 | 4,658 | 2,444 | 367 | 2,305 | 10,662 |
| 2019 | 3,773 | 2,301 | 501 | 2,358 | 9,716 |
| Table 5B Networked Gas Median Consumption by County1 for Residential Sector 2011-2019 | |||||||||
| Median kilowatt hours | |||||||||
| County | 2011 | 2012 | 2013 | 2014 | 2015 | 2016 | 2017 | 2018 | 2019 |
| Carlow | 9,931 | 10,376 | 9,806 | 8,753 | 9,098 | 9,353 | 9,286 | 10,129 | 9,538 |
| Cavan | 11,017 | 11,492 | 12,089 | 9,831 | 10,252 | 10,282 | 9,423 | 10,265 | 10,387 |
| Clare | 9,085 | 8,632 | 8,846 | 8,108 | 8,537 | 8,393 | 8,274 | 9,217 | 8,308 |
| Cork | 9,904 | 8,825 | 9,129 | 7,930 | 8,204 | 8,343 | 7,734 | 9,249 | 8,279 |
| Dublin County | 12,257 | 11,865 | 12,226 | 10,452 | 10,929 | 10,221 | 10,330 | 11,602 | 10,473 |
| Dublin Postal Districts | 12,135 | 11,777 | 11,593 | 10,037 | 10,547 | 10,376 | 10,006 | 11,192 | 10,154 |
| Galway | 9,672 | 9,004 | 9,454 | 7,931 | 8,585 | 8,507 | 8,112 | 9,454 | 8,665 |
| Kerry | _ | _ | _ | _ | _ | _ | _ | 2,628 | 8,391 |
| Kildare | 12,584 | 11,898 | 10,726 | 10,162 | 10,828 | 9,672 | 10,169 | 11,494 | 10,344 |
| Kilkenny | 9,939 | 9,549 | 9,465 | 8,169 | 8,737 | 8,710 | 8,405 | 8,998 | 9,150 |
| Laois | 10,906 | 10,068 | 10,066 | 8,700 | 9,349 | 9,035 | 9,364 | 10,133 | 9,547 |
| Limerick | 9,833 | 8,940 | 9,281 | 8,288 | 8,401 | 8,587 | 8,149 | 9,249 | 8,617 |
| Longford | _ | _ | _ | _ | _ | _ | _ | _ | 3,555 |
| Louth | 10,407 | 10,209 | 10,102 | 8,718 | 9,390 | 9,157 | 9,079 | 10,003 | 9,243 |
| Mayo | 6,042 | 6,328 | 6,405 | 5,003 | 6,276 | 6,665 | 6,548 | 7,671 | 7,302 |
| Meath | 12,170 | 11,962 | 11,921 | 10,470 | 10,847 | 10,909 | 9,825 | 11,355 | 10,572 |
| Monaghan | 8,515 | 9,874 | 12,464 | 9,128 | 9,795 | 8,745 | 7,438 | 10,022 | 8,884 |
| Offaly | 10,863 | 10,338 | 10,514 | 8,994 | 9,864 | 9,565 | 9,607 | 10,958 | 9,952 |
| Roscommon2 | 11,602 | 10,935 | 10,576 | 10,738 | 11,187 | 10,779 | 11,105 | 13,475 | 12,454 |
| Tipperary | 12,139 | 9,803 | 10,237 | 9,126 | 8,811 | 9,198 | 8,981 | 10,233 | 9,271 |
| Waterford | 9,725 | 8,793 | 8,394 | 7,489 | 7,546 | 7,684 | 7,616 | 8,455 | 7,891 |
| Westmeath | 10,350 | 9,623 | 9,679 | 8,383 | 8,897 | 8,783 | 8,806 | 9,982 | 9,118 |
| Wexford | _ | _ | _ | _ | _ | 4,315 | 5,194 | 7,996 | 9,360 |
| Wicklow | 11,002 | 10,487 | 10,595 | 9,087 | 9,649 | 9,584 | 9,069 | 10,515 | 9,644 |
| State | 11,461 | 10,909 | 10,898 | 9,474 | 9,920 | 9,716 | 9,431 | 10,662 | 9,716 |
| 1 Three counties (Donegal, Leitrim, and Sligo) are not connected to the gas network. | |||||||||
| 2 Meters in Roscommon are located only in the western part of Athlone | |||||||||
| – No consumption recorded | |||||||||
| Table 5C Networked Gas Median Consumption by Dublin Postal District for Residential Sector 2011-2019 | |||||||||
| Median kilowatt hours | |||||||||
| Dublin Postal District | 2011 | 2012 | 2013 | 2014 | 2015 | 2016 | 2017 | 2018 | 2019 |
| Dublin 01 | 8,418 | 6,455 | 7,467 | 6,346 | 6,581 | 6,273 | 6,364 | 6,876 | 6,536 |
| Dublin 02 | 6,826 | 5,683 | 7,327 | 6,345 | 6,502 | 6,232 | 5,967 | 7,004 | 6,366 |
| Dublin 03 | 12,042 | 11,366 | 12,101 | 10,434 | 10,985 | 10,717 | 10,270 | 11,705 | 10,557 |
| Dublin 04 | 11,377 | 11,008 | 11,558 | 9,917 | 10,320 | 10,336 | 9,974 | 9,630 | 9,901 |
| Dublin 05 | 14,533 | 13,776 | 13,903 | 11,641 | 12,339 | 12,188 | 11,338 | 12,961 | 11,880 |
| Dublin 06 | 13,187 | 11,780 | 12,414 | 11,217 | 11,916 | 11,992 | 11,181 | 13,180 | 11,839 |
| Dublin 06W | 13,536 | 14,380 | 10,447 | 11,963 | 12,783 | 12,283 | 11,902 | 13,770 | 12,248 |
| Dublin 07 | 12,566 | 10,893 | 11,360 | 9,616 | 10,133 | 10,103 | 9,259 | 10,697 | 9,906 |
| Dublin 08 | 8,553 | 8,549 | 7,471 | 7,316 | 7,540 | 7,476 | 7,453 | 8,415 | 7,663 |
| Dublin 09 | 11,615 | 11,893 | 12,298 | 10,425 | 11,058 | 10,774 | 10,344 | 11,736 | 10,740 |
| Dublin 10 | 11,857 | 11,764 | 10,864 | 9,679 | 9,749 | 8,718 | 9,451 | 10,248 | 9,263 |
| Dublin 11 | 12,392 | 11,566 | 11,411 | 9,803 | 10,347 | 10,167 | 9,707 | 10,653 | 10,015 |
| Dublin 12 | 12,205 | 12,568 | 10,928 | 9,003 | 10,830 | 10,337 | 10,127 | 11,404 | 10,201 |
| Dublin 13 | 13,349 | 12,832 | 13,122 | 11,016 | 11,806 | 11,610 | 10,645 | 11,655 | 11,459 |
| Dublin 14 | 14,469 | 14,564 | 14,397 | 12,325 | 13,076 | 12,819 | 12,333 | 12,648 | 13,048 |
| Dublin 15 | 12,390 | 11,583 | 11,988 | 10,278 | 10,850 | 10,738 | 10,015 | 11,371 | 10,373 |
| Dublin 16 | 13,537 | 13,388 | 13,362 | 11,549 | 11,926 | 10,789 | 11,736 | 12,729 | 9,748 |
| Dublin 17 | 12,852 | 12,651 | 12,153 | 10,289 | 10,741 | 10,394 | 9,942 | 10,930 | 10,604 |
| Dublin 18 | 11,209 | 10,950 | 11,423 | 9,913 | 10,310 | 10,216 | 9,542 | 10,933 | 9,741 |
| Dublin 20 | 12,619 | 12,789 | 12,240 | 10,522 | 9,683 | 9,509 | 10,343 | 11,830 | 10,488 |
| Dublin 22 | 10,870 | 11,060 | 10,718 | 9,501 | 8,635 | 9,761 | 9,368 | 10,459 | 9,682 |
| Dublin 24 | 11,620 | 11,798 | 11,299 | 9,336 | 10,000 | 9,840 | 9,497 | 11,139 | 9,143 |
| Dublin Postal Districts | 12,135 | 11,777 | 11,593 | 10,037 | 10,547 | 10,376 | 10,006 | 11,192 | 10,154 |
| Table 5D Quarterly Networked Gas Median Consumption by County1 for Residential Sector 2019 | |||||
| Median kilowatt hours | |||||
| County | Jan-Mar | Apr-Jun | Jul-Sep | Oct-Dec | Ratio Q1/Q3 |
| Carlow | 3,201 | 2,307 | 367 | 3,435 | 9 |
| Cavan | 5,006 | 2,060 | 824 | 1,769 | 6 |
| Clare | 2,726 | 1,952 | 422 | 2,787 | 7 |
| Cork | 3,425 | 1,893 | 369 | 1,866 | 9 |
| Dublin County | 4,140 | 2,668 | 623 | 2,248 | 7 |
| Dublin Postal Districts | 3,905 | 2,394 | 531 | 2,550 | 7 |
| Galway | 2,380 | 3,223 | 487 | 2,336 | 5 |
| Kerry | 1,796 | 3,002 | 562 | 2,518 | 3 |
| Kildare | 5,132 | 1,825 | 758 | 2,096 | 7 |
| Kilkenny | 3,903 | 2,133 | 364 | 2,059 | 11 |
| Laois | 3,394 | 2,232 | 411 | 2,859 | 8 |
| Limerick | 3,353 | 1,979 | 292 | 2,262 | 12 |
| Longford | 0 | 0 | 0 | 2,820 | _ |
| Louth | 3,133 | 2,418 | 413 | 2,872 | 8 |
| Mayo | 2,121 | 2,585 | 486 | 2,067 | 4 |
| Meath | 4,223 | 2,372 | 590 | 2,575 | 7 |
| Monaghan | 4,318 | 1,790 | 763 | 1,477 | 6 |
| Offaly | 3,429 | 3,093 | 425 | 2,843 | 8 |
| Roscommon2 | 4,008 | 4,122 | 579 | 3,627 | 7 |
| Tipperary | 3,700 | 2,009 | 484 | 2,230 | 8 |
| Waterford | 3,197 | 1,754 | 288 | 1,986 | 11 |
| Westmeath | 2,967 | 2,978 | 389 | 2,585 | 8 |
| Wexford | 3,259 | 3,303 | 574 | 3,708 | 6 |
| Wicklow | 3,100 | 3,140 | 494 | 2,416 | 6 |
| State | 3,773 | 2,301 | 501 | 2,358 | 8 |
| 1 Three counties (Donegal, Leitrim, and Sligo) are not connected to the gas network. | |||||
| 2 Meters in Roscommon are only located in the western part of Athlone | |||||
| – No consumption recorded | |||||
| Table 5E Quarterly Networked Gas Median Consumption by Dublin Postal District for Residential Sector 2019 | |||||
| Median kilowatt hours | |||||
| Dublin Postal District | Jan-Mar | Apr-Jun | Jul-Sep | Oct-Dec | Ratio Q1/Q3 |
| Dublin 01 | 2,897 | 1,107 | 524 | 1,622 | 6 |
| Dublin 02 | 2,827 | 1,150 | 503 | 1,350 | 6 |
| Dublin 03 | 4,510 | 2,192 | 428 | 2,535 | 11 |
| Dublin 04 | 4,445 | 2,098 | 913 | 1,629 | 5 |
| Dublin 05 | 3,861 | 3,556 | 267 | 3,980 | 15 |
| Dublin 06 | 4,891 | 2,629 | 682 | 2,556 | 7 |
| Dublin 06W | 6,859 | 1,992 | 891 | 2,330 | 8 |
| Dublin 07 | 3,346 | 2,894 | 379 | 2,904 | 9 |
| Dublin 08 | 3,860 | 1,332 | 669 | 1,496 | 6 |
| Dublin 09 | 3,713 | 2,661 | 411 | 3,073 | 9 |
| Dublin 10 | 4,360 | 1,645 | 618 | 1,930 | 7 |
| Dublin 11 | 3,268 | 2,818 | 404 | 3,178 | 8 |
| Dublin 12 | 5,336 | 1,835 | 682 | 1,907 | 8 |
| Dublin 13 | 3,678 | 3,321 | 267 | 3,887 | 14 |
| Dublin 14 | 4,857 | 2,943 | 840 | 4,046 | 6 |
| Dublin 15 | 3,357 | 3,317 | 456 | 3,019 | 7 |
| Dublin 16 | 3,749 | 2,865 | 616 | 1,800 | 6 |
| Dublin 17 | 3,611 | 2,560 | 482 | 3,588 | 8 |
| Dublin 18 | 3,223 | 3,233 | 601 | 2,509 | 5 |
| Dublin 20 | 5,497 | 2,014 | 813 | 1,542 | 7 |
| Dublin 22 | 4,503 | 1,939 | 624 | 1,969 | 7 |
| Dublin 24 | 3,917 | 1,859 | 692 | 1,891 | 6 |
| Dublin Postal Districts | 3,905 | 2,394 | 531 | 2,550 | 7 |
| Table 6A Number of Meters by County1 for Non-Residential Sector 2011-2019 | |||||||||
| Number of Meters | |||||||||
| County | 2011 | 2012 | 2013 | 2014 | 2015 | 2016 | 2017 | 2018 | 2019 |
| Carlow | 414 | 416 | 423 | 419 | 421 | 419 | 426 | 429 | 417 |
| Cavan | 94 | 96 | 98 | 104 | 111 | 114 | 121 | 127 | 125 |
| Clare | 233 | 247 | 259 | 277 | 288 | 293 | 311 | 321 | 327 |
| Cork | 3,303 | 3,356 | 3,394 | 3,435 | 3,475 | 3,500 | 3,553 | 3,570 | 3,475 |
| Dublin County | 2,427 | 2,483 | 2,530 | 2,557 | 2,574 | 2,611 | 2,635 | 2,633 | 2,636 |
| Dublin Postal Districts | 11,783 | 11,910 | 12,000 | 12,122 | 12,217 | 12,336 | 12,418 | 12,465 | 12,404 |
| Galway | 262 | 300 | 340 | 389 | 421 | 440 | 457 | 475 | 503 |
| Kerry | _ | _ | _ | _ | _ | _ | _ | 3 | 10 |
| Kildare | 1,242 | 1,262 | 1,284 | 1,325 | 1,364 | 1,373 | 1,328 | 1,335 | 1,352 |
| Kilkenny | 441 | 454 | 465 | 474 | 481 | 489 | 495 | 493 | 493 |
| Laois | 244 | 256 | 263 | 265 | 269 | 271 | 277 | 284 | 281 |
| Limerick | 1,385 | 1,405 | 1,414 | 1,417 | 1,429 | 1,448 | 1,482 | 1,474 | 1,424 |
| Longford | _ | _ | _ | _ | _ | _ | _ | 2 | 3 |
| Louth | 1,200 | 1,224 | 1,223 | 1,251 | 1,273 | 1,286 | 1,305 | 1,307 | 1,316 |
| Mayo | 121 | 157 | 176 | 202 | 221 | 240 | 261 | 286 | 300 |
| Meath | 847 | 870 | 889 | 910 | 923 | 946 | 955 | 967 | 967 |
| Monaghan | 88 | 90 | 89 | 92 | 92 | 95 | 95 | 98 | 101 |
| Offaly | 109 | 122 | 123 | 127 | 133 | 137 | 141 | 145 | 152 |
| Roscommon2 | 1 | 2 | 2 | 2 | 2 | 2 | 3 | 4 | 6 |
| Tipperary | 453 | 473 | 489 | 502 | 511 | 522 | 528 | 539 | 539 |
| Waterford | 875 | 906 | 917 | 928 | 935 | 948 | 946 | 939 | 944 |
| Westmeath | 154 | 173 | 182 | 193 | 211 | 219 | 223 | 225 | 230 |
| Wexford | _ | _ | _ | _ | _ | 5 | 13 | 27 | 37 |
| Wicklow | 847 | 860 | 878 | 883 | 892 | 907 | 920 | 933 | 886 |
| Total | 26,523 | 27,062 | 27,438 | 27,874 | 28,243 | 28,601 | 28,893 | 29,081 | 28,928 |
| 1 Three counties (Donegal, Leitrim, and Sligo) are not connected to the gas network | |||||||||
| 2 Meters in Roscommon are located only in the western part of Athlone | |||||||||
| – No consumption recorded | |||||||||
| Table 6B Number of Meters by County1 for Residential Sector 2011-2019 | |||||||||
| Number of Meters | |||||||||
| County | 2011 | 2012 | 2013 | 2014 | 2015 | 2016 | 2017 | 2018 | 2019 |
| Carlow | 6,610 | 6,643 | 6,680 | 6,727 | 6,796 | 6,903 | 6,929 | 6,949 | 6,891 |
| Cavan | 1,397 | 1,440 | 1,448 | 1,478 | 1,494 | 1,520 | 1,531 | 1,554 | 1,564 |
| Clare | 4,538 | 4,596 | 4,633 | 4,688 | 4,725 | 4,795 | 4,895 | 4,923 | 4,912 |
| Cork | 79,501 | 80,179 | 80,847 | 81,479 | 81,993 | 82,852 | 83,646 | 84,441 | 84,211 |
| Dublin County | 91,484 | 92,247 | 93,142 | 94,282 | 95,563 | 96,818 | 98,248 | 100,147 | 101,442 |
| Dublin Postal Districts | 279,554 | 280,680 | 282,275 | 283,610 | 285,538 | 287,863 | 291,162 | 294,059 | 294,951 |
| Galway | 6,482 | 6,509 | 6,556 | 6,611 | 6,693 | 6,795 | 6,906 | 7,009 | 7,101 |
| Kerry | _ | _ | _ | _ | _ | _ | _ | 26 | 42 |
| Kildare | 29,832 | 30,061 | 30,505 | 30,871 | 31,421 | 31,952 | 32,782 | 33,524 | 34,274 |
| Kilkenny | 6,675 | 6,742 | 6,843 | 6,880 | 6,908 | 6,961 | 7,004 | 7,059 | 7,086 |
| Laois | 7,546 | 7,661 | 7,718 | 7,736 | 7,781 | 7,855 | 7,900 | 7,987 | 7,955 |
| Limerick | 24,989 | 25,071 | 25,219 | 25,371 | 25,509 | 25,828 | 26,305 | 26,603 | 26,517 |
| Longford | _ | _ | _ | _ | _ | _ | _ | _ | 3 |
| Louth | 21,207 | 21,437 | 21,825 | 22,024 | 22,272 | 22,562 | 22,886 | 23,258 | 23,546 |
| Mayo | 395 | 442 | 521 | 595 | 664 | 712 | 777 | 855 | 939 |
| Meath | 22,208 | 22,335 | 22,512 | 22,705 | 22,849 | 23,285 | 24,040 | 25,005 | 25,830 |
| Monaghan | 1,023 | 1,055 | 1,075 | 1,090 | 1,106 | 1,128 | 1,169 | 1,204 | 1,267 |
| Offaly | 1,786 | 1,792 | 1,794 | 1,808 | 1,822 | 1,822 | 1,827 | 1,831 | 1,818 |
| Roscommon2 | 73 | 73 | 73 | 73 | 72 | 72 | 73 | 74 | 74 |
| Tipperary | 7,636 | 7,684 | 7,742 | 7,782 | 7,829 | 7,894 | 7,932 | 7,974 | 7,907 |
| Waterford | 16,761 | 16,875 | 17,036 | 17,148 | 17,193 | 17,417 | 17,520 | 17,624 | 17,452 |
| Westmeath | 3,531 | 3,548 | 3,575 | 3,616 | 3,644 | 3,691 | 3,727 | 3,790 | 3,811 |
| Wexford | _ | _ | _ | _ | _ | 3 | 9 | 16 | 19 |
| Wicklow | 19,707 | 19,863 | 20,102 | 20,325 | 20,676 | 20,941 | 21,258 | 21,653 | 21,800 |
| Total | 632,935 | 636,933 | 642,121 | 646,899 | 652,548 | 659,669 | 668,526 | 677,565 | 681,412 |
| 1 Three counties (Donegal, Leitrim, and Sligo) are not connected to the gas network. | |||||||||
| 2 Meters in Roscommon are located only in the western part of Athlone | |||||||||
| – No consumption recorded | |||||||||
| Table 6C Number of Meters by Dublin Postal District for Residential Sector 2011-2019 | |||||||||
| Number of Meters | |||||||||
| Dublin Postal District | 2011 | 2012 | 2013 | 2014 | 2015 | 2016 | 2017 | 2018 | 2019 |
| Dublin 01 | 4,145 | 4,119 | 4,076 | 4,251 | 4,242 | 4,273 | 4,265 | 4,240 | 4,191 |
| Dublin 02 | 3,646 | 3,635 | 3,642 | 3,576 | 3,652 | 3,660 | 3,738 | 3,679 | 3,641 |
| Dublin 03 | 11,511 | 11,581 | 11,629 | 11,657 | 11,717 | 11,790 | 11,858 | 11,964 | 11,916 |
| Dublin 04 | 12,966 | 13,011 | 13,066 | 13,108 | 13,180 | 13,272 | 13,329 | 13,332 | 13,346 |
| Dublin 05 | 16,057 | 16,123 | 16,220 | 16,270 | 16,331 | 16,423 | 16,491 | 16,591 | 16,582 |
| Dublin 06 | 10,679 | 10,731 | 10,791 | 10,891 | 10,986 | 11,041 | 11,103 | 11,153 | 11,074 |
| Dublin 06W | 7,505 | 7,580 | 7,643 | 7,714 | 7,793 | 7,865 | 7,966 | 8,066 | 8,068 |
| Dublin 07 | 15,318 | 15,346 | 15,383 | 15,376 | 15,418 | 15,526 | 15,529 | 15,600 | 15,501 |
| Dublin 08 | 14,333 | 14,327 | 14,421 | 14,413 | 14,388 | 14,479 | 14,542 | 14,604 | 14,557 |
| Dublin 09 | 17,115 | 17,293 | 17,386 | 17,450 | 17,536 | 17,656 | 17,752 | 17,934 | 17,969 |
| Dublin 10 | 6,403 | 6,393 | 6,403 | 6,394 | 6,393 | 6,393 | 6,499 | 6,627 | 6,598 |
| Dublin 11 | 18,505 | 18,633 | 18,805 | 18,898 | 19,045 | 19,179 | 19,309 | 19,425 | 19,450 |
| Dublin 12 | 18,543 | 18,582 | 18,629 | 18,709 | 18,776 | 18,838 | 19,064 | 19,179 | 19,217 |
| Dublin 13 | 11,944 | 11,991 | 12,058 | 12,129 | 12,243 | 12,357 | 12,815 | 13,096 | 13,289 |
| Dublin 14 | 14,238 | 14,344 | 14,441 | 14,540 | 14,633 | 14,803 | 14,964 | 15,170 | 15,224 |
| Dublin 15 | 29,264 | 29,440 | 29,604 | 29,845 | 30,166 | 30,646 | 31,168 | 31,711 | 32,198 |
| Dublin 16 | 14,599 | 14,731 | 14,890 | 14,978 | 15,315 | 15,478 | 15,706 | 15,850 | 15,970 |
| Dublin 17 | 4,665 | 4,570 | 4,601 | 4,599 | 4,575 | 4,629 | 4,693 | 4,693 | 4,665 |
| Dublin 18 | 11,493 | 11,537 | 11,634 | 11,741 | 11,841 | 11,987 | 12,281 | 12,605 | 12,756 |
| Dublin 20 | 3,318 | 3,330 | 3,350 | 3,483 | 3,492 | 3,493 | 3,578 | 3,585 | 3,593 |
| Dublin 22 | 12,716 | 12,747 | 12,833 | 12,837 | 12,839 | 12,871 | 13,025 | 13,142 | 13,154 |
| Dublin 24 | 20,591 | 20,636 | 20,770 | 20,751 | 20,977 | 21,204 | 21,487 | 21,813 | 21,992 |
| Total | 279,554 | 280,680 | 282,275 | 283,610 | 285,538 | 287,863 | 291,162 | 294,059 | 294,951 |
This release contains consumption data from Gas Networks Ireland on all connections to the mains gas network.
The data are gross calorific values expressed in kilowatt hours (kWh) or gigawatt hours (GWh). A kilowatt hour is a unit of energy equivalent to one kilowatt of power sustained over an hour. A gigawatt hour is equivalent to one million kWh. Kilowatt hours are used for presenting median figures and gigawatt hours for presenting aggregates.
The CSO extracted the county and Dublin postal district from the postal address provided by Gas Networks Ireland. Additional work was required to identify a county for the largest non-residential customers as these were provided in a separate monthly file that did not contain the customer's address.
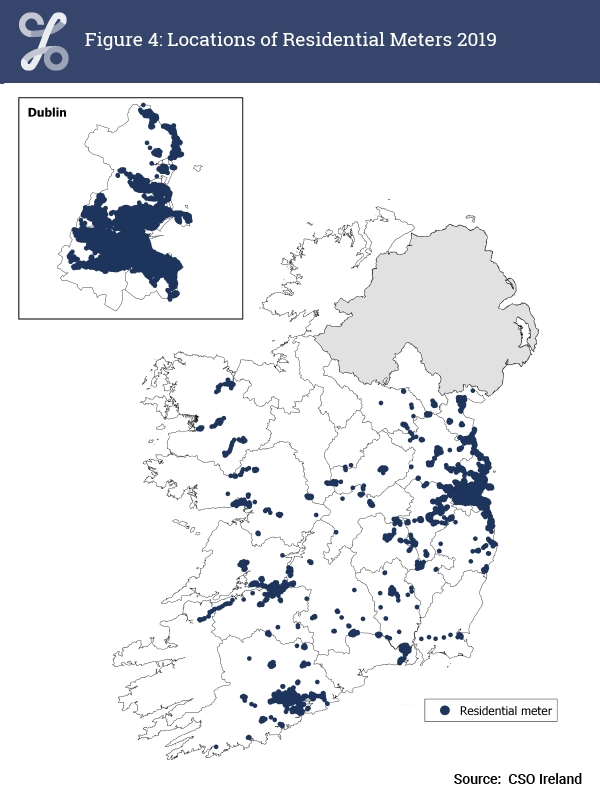
The data cover all consumers connected to the natural gas network. This includes power plants, non-residential, and residential customers. Three counties (Donegal, Leitrim, and Sligo) had no meter connections. The 2016 Census of Population showed that there were around two million households in Ireland of which 1.7 million were occupied. This release showed that there were 681,412 residential gas meters in 2019. The release contains a map showing the location of the residential meters using the coordinates provided by Gas Networks Ireland (see Figure 4).
The meter readings data were converted to monthly and quarterly consumption estimates by Gas Networks Ireland. Meter readings can be actual or estimated. In some cases an estimated reading that was too high resulted in a low or negative reading for a subsequent period, i.e. no attempt was made to adjust the earlier over or under estimate. The data file provided to the CSO did not provide information on whether the consumption in a period was based on an estimated reading. The results are broadly consistent with Gas Networks Ireland reports and with the Sustainable Energy Authority of Ireland energy balances.
Data for all years are subject to revision.
The CSO received the administrative microdata from Gas Networks Ireland under Section 30 of the Statistics Act, 1993. The microdata contain quarterly consumption data for residential and smaller non-residential customers and monthly data for larger users. The CSO received data for 2011-2019 for all customers and for 2006 for residential and smaller non-residential customers.
The median can be regarded as typical usage as it is not influenced by outliers in the same way that the mean or average is. The median for a year is calculated independently of the quarterly medians, e.g. in Table 5A.
This release is published on an annual basis.
The data have been classified into three sectors: power plants; non-residential; and residential. Gas Networks Ireland classified the data as residential or non-residential. Their classification is partly based on the consumption figure. The CSO made a small number of adjustments to recode some meters in a consistent way for all years. The CSO classified a small number of customers as power plants.
There are around 29,000 non-residential customers. The CSO will try to add NACE Rev. 2 codes to these records, as NACE would provide a more detailed analysis of the non-domestic customers.
 Hide Background Notes
Scan the QR code below to view this release online or go to
http://www.cso.ie/en/releasesandpublications/er/ngc/networkedgasconsumption2019/
 Show Table 1 Networked Gas Consumption by Sector 2011-2019
 Hide Table 1 Networked Gas Consumption by Sector 2011-2019