
| Table A: Domestic Material Consumption | |||||
| million tonnes | |||||
| Item | 2011 | 2012 | 2013 | 2014 | 2015 |
| Biomass | 37.6 | 37.7 | 39.2 | 39.0 | 38.8 |
| Metallic Minerals | 6.1 | 6.4 | 6.2 | 6.4 | 6.8 |
| Non-Metallic Minerals | 38.5 | 33.5 | 35.2 | 34.0 | 35.2 |
| Fossil Fuels | 16.8 | 13.3 | 19.6 | 16.6 | 16.3 |
| Other Products | 0.5 | 0.4 | 0.6 | 0.8 | 0.9 |
| Domestic Material Consumption | 99.5 | 91.4 | 100.9 | 96.8 | 97.9 |
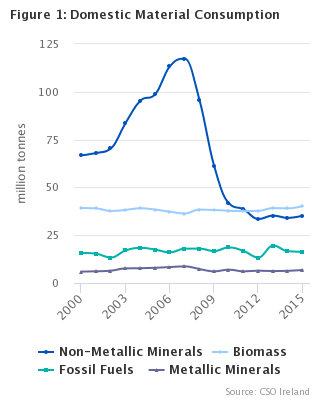
Domestic Material Consumption was estimated at 97.9 million tonnes in 2015 which was 1.1% or 1.1 million tonnes higher than in 2014 (see Table A). Underlying this change was an increase of 1.8 million tonnes in the extraction of Non-Metallic Minerals which was partially offset by an increase of 900,000 tonnes in exports of Non-Metallic Minerals (see Table 1).
Trade Imports was around double the level of Trade Exports during the 2000-2015 period (See Figure 2). Imports increased from 36.4 million tonnes in 2014 to 39.1 million tonnes in 2015. The largest category of imports in 2015 was Fossil Fuels at 16.1 million tonnes which was an increase of 1.4 million tonnes on 2014 (see Table 1).
Exports increased from 16.7 million tonnes in 2014 to 18.5 million tonnes in 2015. This was mainly due to the increase of 900,000 tonnes in Non-Metallic Minerals exports and an increase of 600,000 tonnes in Fossil Fuels exports (see Table 1).
| X-axis label | Domestic Material Consumption | Domestic Extraction | Imports | Exports |
|---|---|---|---|---|
| 2000 | 128.242695108055 | 109.802695108056 | 31.9204 | 13.4804 |
| 2001 | 129.561460663308 | 110.701260663308 | 31.7004 | 12.8402 |
| 2002 | 130.880892299465 | 110.177292299465 | 34.3277 | 13.6241 |
| 2003 | 148.176564464789 | 127.618964464789 | 33.0309 | 12.4733 |
| 2004 | 161.244506109841 | 138.716806109841 | 36.7097 | 14.182 |
| 2005 | 163.272732130926 | 139.912332130926 | 37.5448 | 14.1844 |
| 2006 | 175.85004907952 | 151.72814907952 | 38.7976 | 14.6757 |
| 2007 | 181.238865704557 | 153.617765704557 | 42.2968 | 14.6757 |
| 2008 | 160.799500327249 | 136.814300327249 | 38.8639 | 14.8787 |
| 2009 | 122.843823900038 | 102.613023900038 | 33.3893 | 13.1585 |
| 2010 | 105.56152128898 | 84.4112212889798 | 35.8107 | 14.6604 |
| 2011 | 99.4728911680862 | 80.2726911680862 | 34.9465 | 15.7463 |
| 2012 | 91.3522493053888 | 72.9773493053888 | 34.7507 | 16.3758 |
| 2013 | 100.89653759966 | 79.9450375996598 | 36.6238 | 15.6723 |
| 2014 | 96.8435777405025 | 77.1271777405024 | 36.4181 | 16.7017 |
| 2015 | 97.9 | 77.3 | 39.1472 | 18.5269 |
Table 2 and Figure 3 show the main components of Domestic Extraction. Limestone and Gypsum (including Crushed Rock) increased from 20 million tonnes in 2014 to 20.8 million tonnes in 2015. Domestic extraction of Sand and Gravel increased from 12.4 million tonnes in 2014 to 13.4 million tonnes in 2015. There was a small decrease of 100,000 tonnes in Grazed Biomass between 2014 and 2015. Domestic extraction of peat declined from 7.1 million tonnes in 2013 to 5 million tonnes in 2014 and to 3.9 million tonnes in 2015.
| Limestone and Gypsum (including Crushed Rock) | Sand and Gravel | Grazed Biomas | Fodder Crops | |
| 2000 | 42.577326 | 20.367997 | 19.252675 | 8.29778 |
| 2001 | 44.005296 | 20.775696 | 19.405975 | 8.4250515 |
| 2002 | 44.032918 | 23.732765 | 19.246075 | 7.644275 |
| 2003 | 52.663629 | 27.719212 | 19.234075 | 7.540748 |
| 2004 | 59.602709 | 31.468688 | 19.071375 | 7.563945 |
| 2005 | 61.92005 | 32.047765 | 18.538475 | 9.006678 |
| 2006 | 71.860399 | 35.259441 | 18.30785 | 9.364541 |
| 2007 | 72.808021 | 38.314371 | 18.67535 | 8.3106125 |
| 2008 | 60.17023 | 31.462947 | 20.33125 | 9.037001 |
| 2009 | 37.880065 | 20.57222 | 20.404425 | 8.906436 |
| 2010 | 25.84973 | 12.77533 | 20.576325 | 7.969715 |
| 2011 | 23.651539 | 11.78693 | 20.411125 | 7.9170415 |
| 2012 | 18.631247 | 12.570436 | 20.28315 | 7.8953415 |
| 2013 | 19.213289 | 13.756383 | 19.939475 | 8.0458286 |
| 2014 | 19.981597 | 12.399238 | 19.6899475 | 8.0594575 |
| 2015 | 20.823551 | 13.363008 | 19.5846495 | 7.749267 |
Table 3 shows the breakdown of trade imports and exports by stage of manufacturing. Raw Products comprised 47% of trade imports but only 16% of trade exports in 2015.
| X-axis label | Resource Productivity (Euro per kilogram) |
|---|---|
| 2000 | 1.0562940827613 |
| 2001 | 1.10621630279744 |
| 2002 | 1.16415771105361 |
| 2003 | 1.06034986414694 |
| 2004 | 1.0395144866878 |
| 2005 | 1.08826500102612 |
| 2006 | 1.06622091367864 |
| 2007 | 1.08840341299399 |
| 2008 | 1.1784675923392 |
| 2009 | 1.47121763440925 |
| 2010 | 1.74292675733925 |
| 2011 | 1.90482047696619 |
| 2012 | 2.07491333208824 |
| 2013 | 1.9094213199309 |
| 2014 | 2.15502158087574 |
| 2015 | 2.6759402613087 |
Domestic Material Consumption can be compared with GDP at constant prices to give a general indicator of resource productivity in the economy. This indicator increased from 1.1 euro per kilogram of Domestic Material Consumption in 2000 to 2.2 euro per kilogram in 2014 (see Figure 4). The main underlying factors were the large decreases since 2007 in the extraction of aggregates such as Sand and Gravel and Crushed Rock and an increase in GDP. The level shift in GDP in 2015 has had a significant impact on this indicator.
| Table 1: Net Material Accumulation | ||||||||||
| million tonnes | ||||||||||
| Description | 2006 | 2007 | 2008 | 2009 | 2010 | 2011 | 2012 | 2013 | 2014 | 2015 |
| Domestic Extraction | 151.7 | 153.6 | 136.8 | 102.6 | 84.4 | 80.3 | 73.0 | 79.9 | 77.1 | 77.3 |
| Biomass | 34.3 | 33.6 | 36.4 | 35.8 | 35.2 | 35.6 | 34.8 | 35.5 | 35.6 | 35.3 |
| Metallic Minerals | 4.9 | 4.6 | 4.4 | 4.2 | 4.3 | 4.2 | 4.2 | 3.8 | 3.7 | 3.4 |
| Non-Metallic Minerals | 107.9 | 111.9 | 92.0 | 59.1 | 39.3 | 36.1 | 31.9 | 33.5 | 32.8 | 34.6 |
| Fossil Fuels | 4.6 | 3.6 | 3.9 | 3.5 | 5.7 | 4.4 | 2.1 | 7.2 | 5.1 | 4.0 |
| + Trade Imports | 38.8 | 42.3 | 38.9 | 33.4 | 35.8 | 34.9 | 34.8 | 36.6 | 36.4 | 39.1 |
| Biomass | 8.6 | 8.6 | 7.5 | 7.8 | 8.3 | 8.0 | 8.9 | 9.8 | 9.8 | 10.2 |
| Metallic Minerals | 6.8 | 7.6 | 6.4 | 4.4 | 6.0 | 5.9 | 5.9 | 6.1 | 6.2 | 6.8 |
| Non-Metallic Minerals | 7.0 | 7.1 | 5.6 | 3.7 | 3.8 | 3.8 | 3.4 | 3.8 | 3.8 | 4.0 |
| Fossil Fuels | 14.4 | 17.0 | 17.0 | 15.9 | 16.0 | 15.7 | 15.0 | 15.3 | 14.7 | 16.1 |
| Other Products | 2.0 | 2.0 | 2.3 | 1.6 | 1.7 | 1.7 | 1.5 | 1.7 | 1.9 | 2.0 |
| - Trade Exports | 14.7 | 14.7 | 14.9 | 13.2 | 14.7 | 15.7 | 16.4 | 15.7 | 16.7 | 18.5 |
| Biomass | 5.6 | 5.8 | 5.6 | 5.5 | 5.7 | 6.0 | 5.9 | 6.1 | 6.3 | 6.7 |
| Metallic Minerals | 3.3 | 3.5 | 3.5 | 2.6 | 3.3 | 4.0 | 3.7 | 3.6 | 3.6 | 3.4 |
| Non-Metallic Minerals | 1.6 | 1.6 | 1.8 | 1.4 | 1.4 | 1.3 | 1.8 | 2.0 | 2.5 | 3.4 |
| Fossil Fuels | 3.0 | 2.6 | 2.9 | 2.6 | 3.1 | 3.3 | 3.8 | 2.9 | 3.2 | 3.8 |
| Other Products | 1.2 | 1.1 | 1.1 | 1.1 | 1.2 | 1.2 | 1.1 | 1.1 | 1.1 | 1.2 |
| = Domestic Material Consumption | 175.9 | 181.2 | 160.8 | 122.8 | 105.6 | 99.5 | 91.4 | 100.9 | 96.8 | 97.9 |
| Biomass | 37.3 | 36.3 | 38.4 | 38.2 | 37.8 | 37.6 | 37.7 | 39.2 | 39.0 | 38.8 |
| Metallic Minerals | 8.3 | 8.7 | 7.3 | 6.1 | 7.0 | 6.1 | 6.4 | 6.2 | 6.4 | 6.8 |
| Non-Metallic Minerals | 113.3 | 117.3 | 95.9 | 61.3 | 41.7 | 38.5 | 33.5 | 35.2 | 34.0 | 35.2 |
| Fossil Fuels | 16.0 | 17.9 | 18.0 | 16.7 | 18.6 | 16.8 | 13.3 | 19.6 | 16.6 | 16.3 |
| Other Products | 0.8 | 0.9 | 1.2 | 0.6 | 0.5 | 0.5 | 0.4 | 0.6 | 0.8 | 0.9 |
| - Domestic Processed Output | 60.9 | 60.8 | 60.4 | 55.0 | 55.2 | 51.3 | 51.5 | 51.3 | 51.1 | 52.8 |
| Emissions to Air | 49.7 | 49.8 | 49.5 | 44.4 | 44.0 | 40.4 | 40.7 | 39.8 | 39.6 | 41.3 |
| Emissions to Land | 0.3 | 0.2 | 0.1 | 0.1 | 0.3 | 0.3 | 0.2 | 0.1 | 0.1 | 0.1 |
| Emissions to Water | 0.5 | 0.5 | 0.5 | 0.4 | 0.4 | 0.4 | 0.4 | 0.4 | 0.5 | 0.5 |
| Dissipative Use of Products | 10.4 | 10.3 | 10.3 | 10.0 | 10.4 | 10.2 | 10.1 | 10.8 | 11.0 | 11.0 |
| + Balancing Items Input Side | 73.9 | 74.4 | 74.6 | 68.5 | 67.8 | 63.7 | 64.2 | 63.2 | 62.7 | 65.1 |
| - Balancing Items Output Side | 69.9 | 69.4 | 70.6 | 68.5 | 66.7 | 64.8 | 66.6 | 66.8 | 66.3 | 67.5 |
| = Net Material Accumulation | 119.0 | 125.6 | 104.3 | 67.8 | 51.4 | 47.0 | 37.4 | 46.1 | 42.1 | 42.7 |
| Table 2: Domestic Extraction | ||||||||||
| million tonnes | ||||||||||
| Description | 2006 | 2007 | 2008 | 2009 | 2010 | 2011 | 2012 | 2013 | 2014 | 2015 |
| Domestic Extraction | 151.7 | 153.6 | 136.8 | 102.6 | 84.4 | 80.3 | 73.0 | 79.9 | 77.1 | 77.3 |
| Biomass | 34.3 | 33.6 | 36.4 | 35.8 | 35.2 | 35.6 | 34.8 | 35.5 | 35.6 | 35.3 |
| Crops | 2.8 | 2.8 | 3.2 | 2.8 | 2.8 | 3.2 | 2.7 | 3.2 | 3.3 | 3.4 |
| Cereals | 2.1 | 2.0 | 2.5 | 2.1 | 2.0 | 2.5 | 2.1 | 2.4 | 2.6 | 2.6 |
| Roots/Tubers | 0.4 | 0.4 | 0.3 | 0.3 | 0.4 | 0.4 | 0.2 | 0.4 | 0.4 | 0.4 |
| Sugar Crops | 0.0 | 0.0 | 0.0 | 0.0 | 0.0 | 0.0 | 0.0 | 0.0 | 0.0 | 0.0 |
| Vegetables | 0.3 | 0.3 | 0.2 | 0.2 | 0.2 | 0.2 | 0.2 | 0.2 | 0.2 | 0.2 |
| Other Crops | 0.1 | 0.1 | 0.1 | 0.1 | 0.2 | 0.2 | 0.2 | 0.2 | 0.2 | 0.2 |
| Used Crop Residues | 2.1 | 2.1 | 2.5 | 2.3 | 2.2 | 2.5 | 2.2 | 2.6 | 2.7 | 2.7 |
| Straw | 1.6 | 1.6 | 1.9 | 1.6 | 1.6 | 2.0 | 1.7 | 1.9 | 2.1 | 2.1 |
| Other Crop Residues | 0.5 | 0.5 | 0.5 | 0.6 | 0.6 | 0.5 | 0.5 | 0.6 | 0.6 | 0.6 |
| Fodder Crops | 9.4 | 8.3 | 9.0 | 8.9 | 8.0 | 7.9 | 7.9 | 8.0 | 8.1 | 7.7 |
| Grazed Biomass | 18.3 | 18.7 | 20.3 | 20.4 | 20.6 | 20.4 | 20.3 | 19.9 | 19.7 | 19.6 |
| Wood | 1.5 | 1.5 | 1.2 | 1.3 | 1.4 | 1.3 | 1.4 | 1.4 | 1.5 | 1.5 |
| Wild Fish Catch, Aquatic Plants and Animals | 0.3 | 0.2 | 0.2 | 0.2 | 0.3 | 0.2 | 0.3 | 0.3 | 0.3 | 0.3 |
| Metallic Minerals | 4.9 | 4.6 | 4.4 | 4.2 | 4.3 | 4.2 | 4.2 | 3.8 | 3.7 | 3.4 |
| Lead Gross Ore | 0.7 | 0.6 | 0.6 | 0.5 | 0.6 | 0.6 | 0.6 | 0.5 | 0.5 | 0.5 |
| Zinc Gross Ore | 4.2 | 4.0 | 3.9 | 3.7 | 3.7 | 3.6 | 3.6 | 3.3 | 3.1 | 2.9 |
| Non-Metallic Minerals | 107.9 | 111.9 | 92.0 | 59.1 | 39.3 | 36.1 | 31.9 | 33.5 | 32.8 | 34.6 |
| Marble, Granite, Sandstone | 0.7 | 0.6 | 0.3 | 0.5 | 0.5 | 0.5 | 0.5 | 0.3 | 0.3 | 0.3 |
| Limestone and Gypsum (including Crushed Rock) | 71.9 | 72.8 | 60.2 | 37.9 | 25.8 | 23.7 | 18.6 | 19.2 | 20.0 | 20.8 |
| Sand and Gravel | 35.3 | 38.3 | 31.5 | 20.6 | 12.8 | 11.8 | 12.6 | 13.8 | 12.4 | 13.4 |
| Other Non-Metallic Minerals | 0.1 | 0.1 | 0.1 | 0.1 | 0.2 | 0.2 | 0.2 | 0.2 | 0.1 | 0.1 |
| Fossil Fuels | 4.6 | 3.6 | 3.9 | 3.5 | 5.7 | 4.4 | 2.1 | 7.2 | 5.1 | 4.0 |
| Peat | 4.2 | 3.3 | 3.6 | 3.3 | 5.5 | 4.2 | 2.0 | 7.1 | 5.0 | 3.9 |
| Natural Gas | 0.4 | 0.3 | 0.3 | 0.2 | 0.2 | 0.2 | 0.2 | 0.1 | 0.1 | 0.1 |
| Table 3: Trade by Stage of Manufacturing | ||||||||||
| million tonnes | ||||||||||
| Description | 2006 | 2007 | 2008 | 2009 | 2010 | 2011 | 2012 | 2013 | 2014 | 2015 |
| Trade Imports | 38.8 | 42.3 | 38.9 | 33.4 | 35.8 | 34.9 | 34.8 | 36.6 | 36.4 | 39.1 |
| Raw Products | 14.7 | 17.7 | 16.8 | 14.7 | 16.5 | 16.4 | 16.6 | 17.7 | 16.8 | 18.5 |
| Semi-Manufactured Products | 7.2 | 7.3 | 6.1 | 4.4 | 4.7 | 4.5 | 4.4 | 5.2 | 5.1 | 5.5 |
| Finished Products | 16.8 | 17.3 | 16.0 | 14.3 | 14.6 | 14.0 | 13.7 | 13.6 | 14.5 | 15.2 |
| Trade Exports | 14.7 | 14.7 | 14.9 | 13.2 | 14.7 | 15.7 | 16.4 | 15.7 | 16.7 | 18.5 |
| Raw Products | 3.0 | 2.3 | 2.1 | 2.0 | 2.1 | 2.5 | 2.4 | 2.4 | 2.4 | 3.0 |
| Semi-Manufactured Products | 5.0 | 5.4 | 5.4 | 4.4 | 5.1 | 5.5 | 5.7 | 5.9 | 6.5 | 7.0 |
| Finished Products | 6.7 | 7.0 | 7.3 | 6.8 | 7.4 | 7.8 | 8.2 | 7.3 | 7.8 | 8.5 |
The general purpose of economy-wide material flow accounts (MFA) is to describe the interaction of the domestic economy with the natural environment and the rest of the world economy in terms of flows of materials. Only flows crossing the system boundary, as inputs from the environment into the economy or as outputs from the economy into the environment, are counted. Material flows within the economy are not taken into account.
Material inputs to the economy cover extractions of materials (excluding water) from the natural environment and imports of goods. Material outputs are disposals of materials to the natural environment and exports of goods.
Material inputs from the natural environment to the economy are called domestic extraction. There are four types of domestic extraction:
• Biomass;
• Metallic minerals;
• Non-metallic minerals; and
• Fossil fuels.
Materials that are extracted from the environment without the intention of using them are not included. Examples of unused extraction are soil and rock excavated during construction, overburden from mining, the unused parts of felling in forestry, unused catch in fishing, unused parts of the straw harvest in agriculture, and natural gas flared or vented.
1.1 Biomass
Biomass in general comprises organic non-fossil material of biological origin. The flow from the environment to the economy is recognised at the point of harvest. The classification of material flows for domestic extraction of biomass has six main sections:
• Crops;
• Used crop residues;
• Fodder crops;
• Grazed biomass;
• Wood from cultivated and non-cultivated forests; and
• Wild fish catch, aquatic plants/animals, hunting and gathering.
A characteristic feature of all types of biomass is its considerable moisture content, which may account for more than 95% in the case of fresh living plant biomass. The moisture content is very variable across plant parts and species and vegetation periods. Fodder crops, grazed biomass and wood have to be converted to a standardised moisture content. Other biomass is accounted for at its weight at the time of harvest.
Crops: include primary harvest of all crops from arable land and permanent cultures. This includes major staple foods such as cereals, roots and tubers, pulses, vegetables as well as commercial feed crops, industrial crops and all fruits and nuts from permanent cultures. It also includes flowers, Christmas trees, seeds, and short rotation wood such as Miscanthus and Willow. Own account production of agricultural goods is regarded as domestic extraction.
Used Crop Residues: In most cases, primary crop harvest is only a fraction of total plant biomass of the respective cultivar. The residual biomass, such as straw, may be put to further economic use such as for bedding material in livestock husbandry, as animal feed, for energy production, and as industrial raw material. Crop residues are regarded as domestic extraction irrespective of whether they are sold or used for intra-unit consumption. Residues which are ploughed into the soil or burned in the field are not accounted for as used extraction. A significant amount of fodder is consumed by animals feeding directly from pastures (grazed biomass). Grazed biomass is regarded as domestic extraction. Grass type fodder crops have been reported in dry weight (15 % moisture).
Straw Crop Residue figures are generated by multiplying cereal crop tonnage by Eurostat Harvest and Recovery Rates.
Other Crop Residues are obtained by multiplying the tonnage figures of Oil Seed Rape, Sugar Beet, Fodder Beet and Potato residues by their respective Harvest and Recovery Rates.
Fodder Crop figures are generated by taking Grass Silage, Hay, Arable Silage, Green Maize, Fodder Rape and Kale and Turnip figures and multiplying the area under cultivation by national yield factors. Fodder Crops are reported in dry weight.
Grazed Biomass: Two main estimation methods are possible for the calculation of Grazed Biomass: a supply-side approach or a demand-side approach. The supply-side approach multiplies the areas under grass silage, hay, pasture and rough grazing by national yield factors.
The demand-side approach takes the annual fodder requirement of the existing livestock and subtracts it from the Overall Roughage Requirement of livestock. The total Roughage Requirements for ruminant animals is calculated using average roughage intakes per animal multiplied by the number of animals in each category.
The supply side approach to the calculation of Grazed Biomass has been the one adopted in the production of statistics for this release.
Wood from cultivated and non-cultivated forests: Only harvested timber is regarded as domestic extraction and not the total growth of trees. Increments to the stock of standing timber are regarded as positive from an environmental viewpoint and are not considered part of domestic extraction until it is harvested.
Wood output is usually reported in solid cubic metres: this has to be converted into tonnes. The density factors which are reported by the Intergovernmental Panel on Climate Change refer to oven dry mass of wood. Therefore the original density factors of the IPCC publication were transformed by factors which converted solid cubic metres into tonnes at 15 % moisture content.
Bark accounts for approximately 10% of stem wood weight. A significant fraction of the bark is of economic use (e.g. energy production). The part of the bark which is used has to be regarded as domestic extraction. All biomass which remains in the forest, and is not used (branches, root-stock etc.), is not counted as domestic extraction. It should be assumed that all harvested wood over bark is used economically.
Wild Fish catch, aquatic animals/plants, hunting and gathering: This category comprises the extraction of all wild (non-cultivated) aquatic biomass including seaweed as well as fish caught in sea and inland waters. Cultivated aquatic resources (aquaculture) are not regarded as domestic extraction.
1.2 Metallic Minerals
In Material Flow Accounts extraction of metal ores is measured as gross ore. Accounting for domestic extraction of metals and non-metallic minerals refers to the run-of-mine production (the total amount of extracted crude mineral that is submitted to the first processing step). Material extracted but not used as an input for subsequent processing is not counted as domestic extraction.
If two or more metals are obtained from the same crude ore then the total amount of ore has to be allocated to the different metals. This occurs in Ireland where lead and zinc are mined together. The total amount of gross ore is calculated by dividing the metal content of the main metal by the ore grade of that metal. The allocation of gross ore to lead and zinc was done using metal prices. A small amount of silver is also mined.
The figures for lead, zinc, and silver extraction were obtained from the Department of Communications, Climate Action and Environment.
1.3 Non-Metallic Minerals
Non-metallic minerals cover the following categories:
• Marble, granite, sandstone, porphyry, basalt, other ornamental or building stone;
• Chalk and dolomite;
• Slate;
• Chemical and fertiliser minerals;
• Salt;
• Limestone and gypsum (including crushed rock);
• Clays and kaolin;
• Sand and gravel; and
• Other.
The CSO PRODCOM survey was the main data source used to compile these figures. Adjustments were made in some years for non-response and below threshold returns. The Limestone and Gypsum category includes figures for crushed rock. These crushed rock statistics were supplemented using the CSO Road Freight Survey for data not reported in PRODCOM. The basis for this under-reporting assumption is that PRODCOM data relate to sales by enterprises with 3 or more employees and hence may exclude aggregates extracted for own use as well as below threshold activity.
1.4 Fossil Fuels
The Sustainable Energy Authority of Ireland’s energy balance is the main data source for the domestic extraction of fossil fuels. Peat and natural gas are the two main material products that are extracted. The energy balances exclude peat used for non-energy purposes such as horticulture. Data on natural gas were converted from cubic metres into tonnes using conversion factors supplied by the SEAI.
The demarcation of trade flows follows the methodology used in external trade statistics (goods are measured as they physically cross the national frontier), rather than follow the residence principle as applied in National Accounts.
Eurostat has provided a key for classifying goods according to their level of manufacturing (see below). This is useful as imports of semi-manufactured and finished goods are recorded using their imported weight rather than by their raw material equivalent weight, and gives an insight into the relative composition of Ireland’s imports.
• Raw materials are products produced by primary industries such as agriculture, forestry, fishing, and mining;
• Semi-manufactured products are further processed raw products that do not yet constitute finished products;
• Finished products are not subject to further processing.
Some traded products are measured in units other than net mass e.g. number of aircraft. The net mass has been estimated using the monetary value or the supplementary unit value.
Domestic Processed Output indicates the total weight of materials which are released back to the environment after being used in the domestic economy. Exported and imported materials are not included in DPO. There are five main categories:
• Emissions to air;
• Waste landfilled (uncontrolled);
• Emissions to water;
• Dissipative use of products; and
• Dissipative losses
3.1 Emissions to Air
Emissions to air are gaseous or particulate materials released to the atmosphere from production or consumption processes in the economy. Air emissions include emissions from controlled landfills because such landfills are considered to be part of the economy. N2O emissions from product use and NMVOC emissions by solvents are accounted for as dissipative use of products. Emissions to air from fertiliser application, such as N2O and NH3 are not accounted for in Domestic Processed Output. The related primary output is fertiliser spread on agricultural soil. The inclusion of these emissions thus would represent double counting. The basic data for emissions to air come from the National Inventory Reports compiled by the Environmental Protection Agency.
Oxygen is drawn from the atmosphere during fossil fuel combustion and other industrial processes. In Material Flow Accounts, this atmospheric oxygen is not included in the totals on the input side (Domestic Extraction etc.) but it is included in the totals on the output side (Domestic Processed Output). The reason is that oxygen is a constituent part of the pollutants and greenhouse gases, and that these emissions are usually reported and analysed with their oxygen content. To arrive at a full mass balance, the missing oxygen on the input side is reported as input balancing items.
Carbon Dioxide (CO2) from Biomass Combustion: This sub-category includes:
• Biofuels like biodiesel and bioethanol;
• Biogas (which may be used both as a biofuel and as a fuel for producing electricity and heat);
• Biomass for electricity and heat, mainly wood and agricultural harvest residuals; and
• Biomass from fire wood, wastes from agriculture and forestry, etc.
It does not include CO2 emissions from land use and land use changes which are considered as flows within the environment. CO2 emissions from human or animal respiration are classified as output balancing items.
Carbon Dioxide (CO2) Excluding Biomass Combustion: This category includes CO2 emissions from the decomposition of waste in controlled landfills, animal digestion, decomposition of animal wastes, production and distribution of natural gas and oil, coal production, and incomplete fossil-fuel combustion.
Methane emissions from uncontrolled landfills are not included as Emissions to air as such landfills are classified as part of the environment rather than as part of the economy - wastes deposited in controlled landfills are accounted for as an addition to stock.
Ammonia emissions from agriculture are not included in Emissions to air.
3.2 Waste Landfilled (Uncontrolled)
Wastes are commonly reported in wet weight which have been converted to dry matter value. The figures for this category were obtained from the EPA and they refer to the deposit of municipal waste only.
3.3 Emissions to Water
Emissions to water are materials which cross the boundary from the economy back into the Environment. Only data on flows of pollutants into the water bodies were reported and not data on pollutant concentration in the water bodies. The figures for this category were obtained from the EPA.
It is assumed that 5% of organic fertiliser (manure) produced is lost as an emission to water.
3.4 Dissipative Use of Products
Examples of dissipative use are inorganic and organic fertilisers such as manure, compost, or sewage sludge. Manure spread on agricultural land is reported in dry weight.
The fertiliser figures mainly concerns four major plant nutrients - nitrogen, phosphorus, potassium and lime - in plant-available forms. These were reported in total weights.
Sewage sludge refers to any solid, semi-solid, or liquid residue removed during the treatment of municipal waste water or domestic sewage. Sewage sludge is reported in dry weight by the Environmental Protection Agency.
Compost is used as a fertiliser. It is reported in dry weight.
Pesticides have been reported as active ingredients rather than total mass.
3.5 Dissipative Losses
Dissipative losses are unintentional outputs of materials to the environment resulting from abrasion, corrosion, and erosion at mobile and stationary sources, and from leakages or from accidents during the transport of goods. No data for dissipative losses have been calculated for this release.
These data comprise items required on the input side to balance a given output which is already accounted for, or items which must be considered on the output side to balance a given input.
Input Balancing Items: consist of oxygen used in combustion processes; oxygen used in respiration by humans and livestock; and nitrogen used in the Haber-Bosch process to produce ammonia. The calculation of these input items relies on the use of coefficients in the Eurostat Material Flow Accounts Compilation Guidelines.
Output Balancing Items: consist of water vapour released by the combustion of fuels and water vapour and carbon dioxide produced by the respiration of humans and livestock. The calculation of these output items relies on the use of conversion coefficients in the Eurostat Material Flow Accounts Compilation Guidelines.
Direct Material Input measures the input of materials directly used by the economy, which are all materials that form part of products or are used in production and consumption activities. DMI equals used extraction (including that which is used or contained in exports) plus imports.
Physical Trade Balance measures the difference between the total mass of imports and the total mass of exports (imports minus exports) in tonnes.
Domestic Material Consumption measures the total amount of material directly consumed by the economy. It is the sum of domestic extraction and imports less exports.
Net Material Accumulation is the difference between inputs from the environment and the Rest of the World into the economy and the outputs from the economy into the environment and the Rest of the World.
Resource Productivity measures the amount of GDP at constant prices compared with Domestic Material Consumption. It is a measure of how efficiently resources are used in the economy.
 Hide Background Notes
Scan the QR code below to view this release online or go to
http://www.cso.ie/en/releasesandpublications/er/mfa/materialflowaccounts2015/
 Show Table 1 Net Material Accumulation
 Hide Table 1 Net Material Accumulation