Back to Top
Statistics Database
cso.ie as Gaeilge
Skip navigation
Show Menu
Home
Statistics
Explore Statistics
People and Society
Population
Education
Births, Deaths & Marriages
Crime and Justice
Social Conditions
Health
Information Society
Housing and Households
Labour Market and Earnings
Labour Market
Earnings
Business Sectors
Agriculture
Building and Construction
Digital Economy
Enterprise Statistics
Industry
International Enterprises
People in Business
Retail and Services
Small and Medium Enterprises
Technology and Innovation
Tourism and Travel
Transport
Economy
International Accounts
Prices
National Accounts
Government Accounts
External Trade
Key Economic Indicators
IMF Summary Data Page
Environment
Agri-Environment
Climate
Ecosystem Accounts
Energy
Environment Accounts
Fishery
Forestry
Indicators
Social
Water and Waste Water
General Statistical Publications
A-Z of Releases and Publications
Hubs & Dashboards
close
Databases
Methods
Surveys
About Us
Census
Trust & Transparency
You are here:
Home
/
Statistics
/
Environment Accounts
/
Material Flow Accounts
Material Flow Accounts
Releases
Material Flow Accounts 2023
Material Flow Accounts 2022
Material Flow Accounts 2021
Material Flow Accounts 2024
PxStat tables
all releases
Related content
Methodology
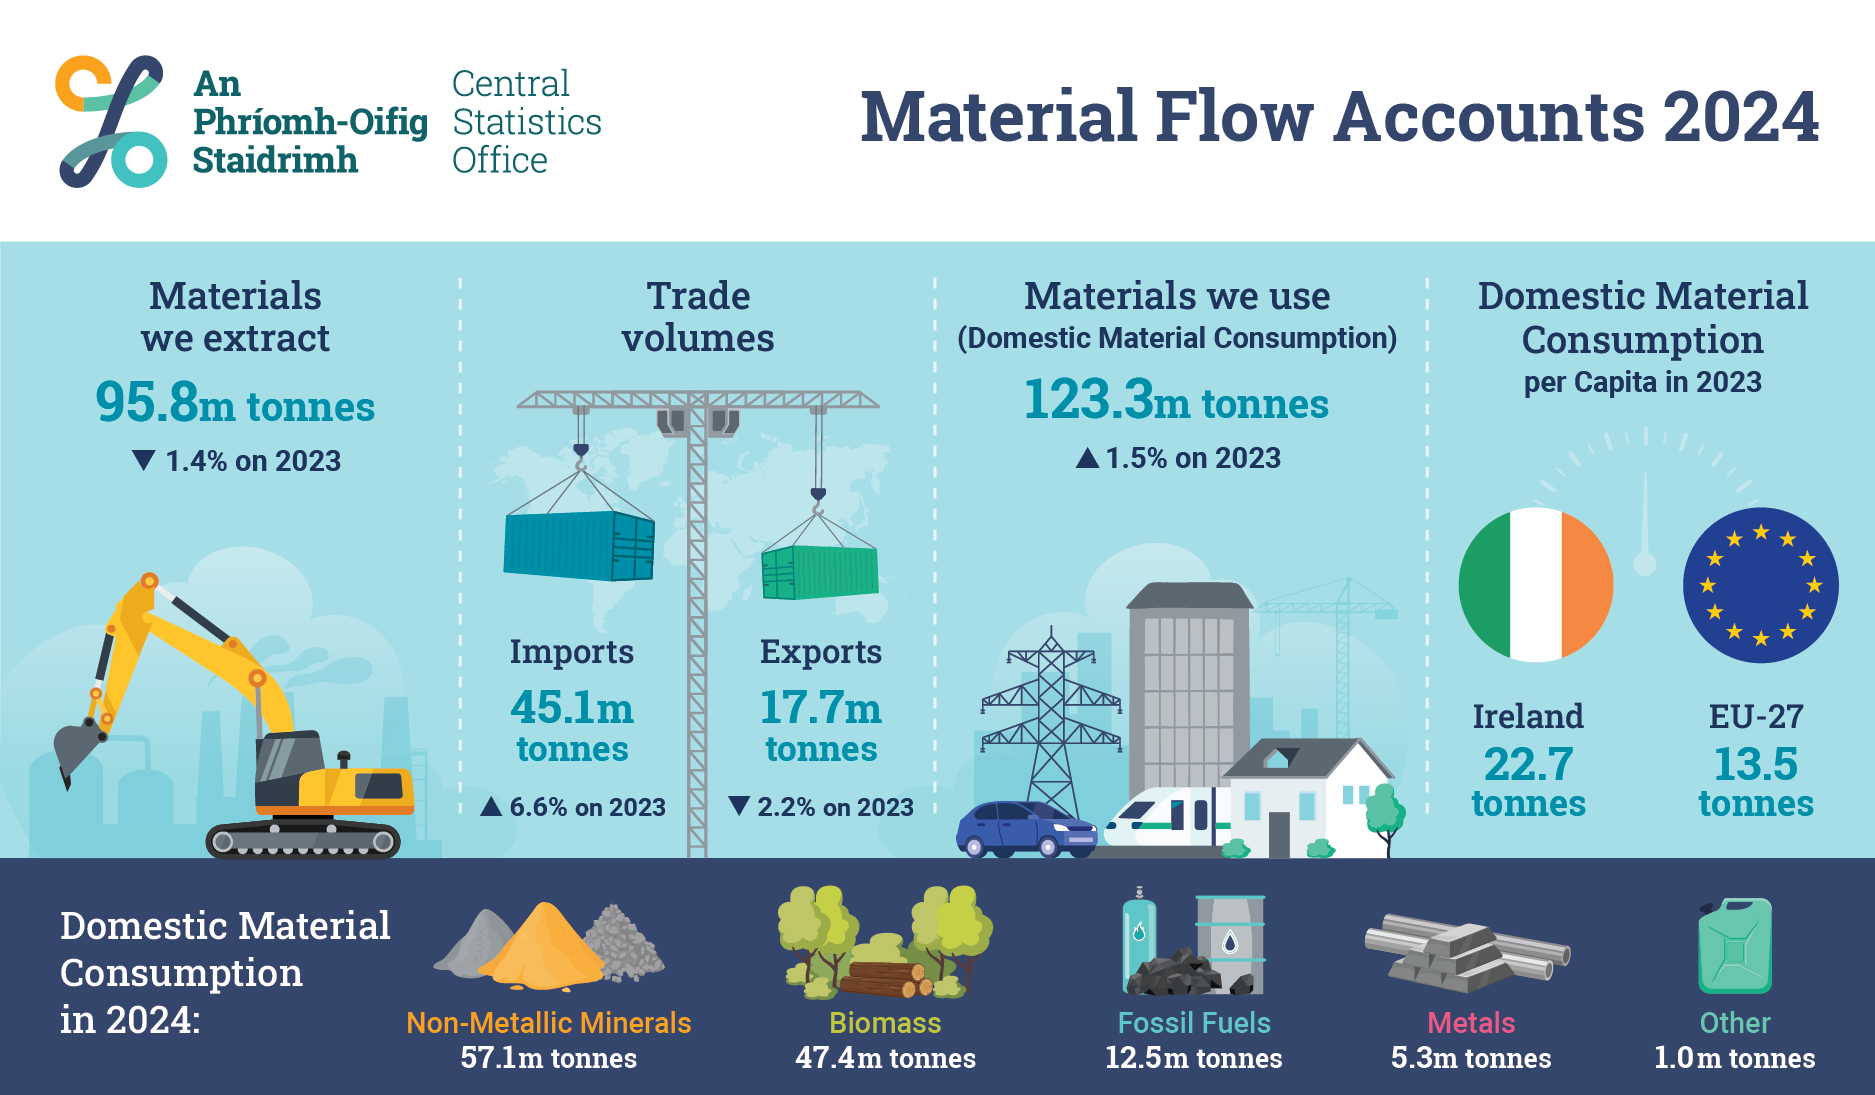
Material Flow Accounts Infographics
go to full release