
| Livestock Numbers | |||
| Cattle | Sheep | Pigs | |
| '000 | |||
| 2013 | 6,309.1 | 3,324.1 | 1,468.5 |
| 2014 | 6,243.1 | 3,324.9 | 1,505.0 |
| % change | -1.0 | 0.0 | +2.5 |
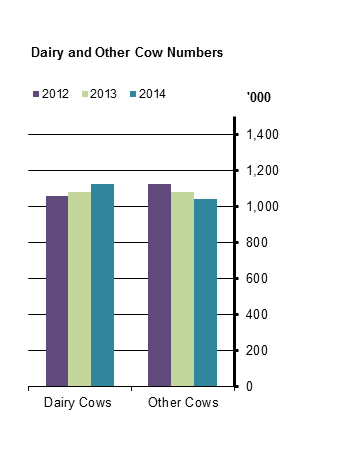
The results of the December 2014 Livestock Survey show that the number of dairy cows increased by 45,300 (+4.2%) while other cows decreased by 43,900 (-4.0%).Total cattle numbers decreased by 66,000 (-1.0%) to 6,243,100. See Table 1.
Further comparisons with the December 2013 results indicate that:
| Table 1 Number of Cattle | |||||
| Description | December 2012 | December 2013 | December 2014 | Change 2013 - 2014 | |
| ' 000 | ' 000 | % | |||
| Total cattle | 6,253.2 | 6,309.1 | 6,243.1 | -66.0 | -1.0 |
| Dairy cows1 | 1,060.3 | 1,082.5 | 1,127.7 | 45.3 | 4.2 |
| Other cows | 1,127.9 | 1,085.1 | 1,041.2 | -43.9 | -4.0 |
| Bulls2 | 38.8 | 37.3 | 35.9 | -1.4 | -3.7 |
| Cattle male: 2 years and over | 160.2 | 207.6 | 199.4 | -8.2 | -3.9 |
| Cattle female: 2 years and over | 262.6 | 289.1 | 304.5 | 15.4 | 5.3 |
| Cattle male: 1-2 years | 736.9 | 803.8 | 755.9 | -47.9 | -6.0 |
| Cattle female: 1-2 years | 880.0 | 910.4 | 892.7 | -17.7 | -1.9 |
| Cattle male: under 1 year | 987.6 | 914.2 | 901.1 | -13.1 | -1.4 |
| Cattle female: under 1 year | 999.0 | 979.1 | 984.6 | 5.5 | 0.6 |
| Total cattle male | 1,923.4 | 1,962.9 | 1,892.3 | -70.6 | -3.6 |
| Total cattle female | 4,329.9 | 4,346.2 | 4,350.7 | 4.6 | 0.1 |
| 1 Dairy cows are those kept principally to produce milk for human consumption. | |||||
| 2 Bulls used for breeding purposes only. | |||||
| Table 2 Number of Sheep | |||||
| Description | December 2012 | December 2013 | December 2014 | Change 2013 - 2014 | |
| ' 000 | ' 000 | % | |||
| Total sheep | 3,430.3 | 3,324.1 | 3,324.9 | 0.8 | 0.0 |
| Breeding sheep | 2,576.3 | 2,546.3 | 2,503.6 | -42.6 | -1.7 |
| Ewes: 2 years and over | 1,989.1 | 1,998.8 | 1,980.1 | -18.8 | -0.9 |
| Ewes: under 2 years | 511.8 | 474.0 | 450.1 | -23.9 | -5.0 |
| Rams | 75.4 | 73.4 | 73.4 | 0.0 | 0.0 |
| Other sheep | 854.0 | 777.8 | 821.3 | 43.4 | 5.6 |
| Table 3 Number of Pigs | |||||
| Description | December 2012 | December 2013 | December 2014 | Change 2013 - 2014 | |
| ' 000 | ' 000 | % | |||
| Total pigs | 1,493.0 | 1,468.5 | 1,505.0 | 36.5 | 2.5 |
| Breeding pigs | 145.1 | 145.2 | 146.4 | 1.2 | 0.8 |
| Gilts in pig | 20.7 | 19.1 | 19.5 | 0.5 | 2.5 |
| Sows in pig | 82.6 | 79.4 | 82.5 | 3.1 | 3.9 |
| Other Sows for breeding | 25.7 | 29.8 | 28.3 | -1.5 | -5.1 |
| Gilts not yet served1 | 15.2 | 16.0 | 15.2 | -0.8 | -5.2 |
| Boars | 0.9 | 0.9 | 0.8 | 0.0 | -3.7 |
| Other pigs | 1,347.9 | 1,323.3 | 1,358.6 | 35.3 | 2.7 |
| Pigs 80kg and over | 228.8 | 242.0 | 238.2 | -3.8 | -1.6 |
| Pigs 50kg and under 80kg | 298.7 | 273.4 | 296.8 | 23.4 | 8.6 |
| Pigs 20kg and under 50kg | 412.6 | 380.6 | 384.5 | 3.9 | 1.0 |
| Less than 20kg | 407.7 | 427.2 | 439.0 | 11.8 | 2.8 |
| 1 Gilts of at least 50kg liveweight intended for breeding but not yet served. | |||||
Coverage Farms where the agricultural area used was at least one hectare (2.47 acres) are included in the December Livestock Sample Survey. Farms with less than one hectare may also be included if they were engaged in intensive production.
Definition A farm is defined in accordance with the definition adopted for the EU surveys as
a single unit, both technically and economically, which has a single management
and which provides agricultural products.
Sources
Cattle: The results for cattle are obtained from Department of Agriculture Food and the Marine (DAFM) Animal Identification and Movement (AIM) system. This system was introduced at the beginning of 2000 and involves electronically recording data on animal movements.
Sheep: The December 2014 results for sheep are based on the trends obtained by comparing the returns from the December 2014 sample with the 2013 returns for the same 8,100 farms and applying these trends to the December 2013 figures.
Pigs: A specialist pig survey was conducted by the CSO due to the intensive nature of this activity.
Rounding As the figures in the text have been rounded to the nearest 100 units there may be slight discrepancies between the sum (or difference) of the constituent items and the total shown.
 Hide Background Notes
Scan the QR code below to view this release online or go to
http://www.cso.ie/en/releasesandpublications/er/lsd/livestocksurveydecember2014/
 Show Table 1 Number of Cattle
 Hide Table 1 Number of Cattle