
| € million | |||||||
| Exports | Imports | Net | Exports | Imports | Net | ||
| 2019 | 2020 | ||||||
| Total | 230,153 | 335,716 | -105,563 | 244,071 | 305,968 | -61,897 | |
| of which: | |||||||
| USA | 35,836 | 58,217 | -22,381 | 33,007 | 107,062 | -74,055 | |
| UK | 35,346 | 21,296 | 14,050 | 35,119 | 20,251 | 14,868 | |
| Germany | 16,517 | 5,247 | 11,270 | 17,424 | 5,951 | 11,473 | |
| Netherlands | 7,342 | 30,284 | -22,942 | 10,667 | 9,253 | 1,414 | |
Total service exports increased by €13.9bn from €230.2bn in 2019 to €244.1bn in 2020. Total service imports decreased by €29.7bn from €335.7bn in 2019 to €306bn in 2020. The increase in service exports was principally due to increased computer service exports (+€15.7bn) while the decrease in service imports was predominantly due to decreased R&D service imports related to Intellectual Property (IP) (-€36.6bn). As a result, the service deficit moved from €105.6bn in 2019 to €61.9bn in 2020. US, UK, Germany and the Netherlands remain Ireland’s most significant trading partners.
Computer services exports at €134.2bn remains the largest export category and accounted for 55 per cent of total service exports in 2020. R&D service imports, at €104.2bn, along with Royalties/Licences imports at €84.4bn, were the largest import categories. When combined, these two import categories accounted for 61.6 per cent of total service imports in 2020 (see Table 1).
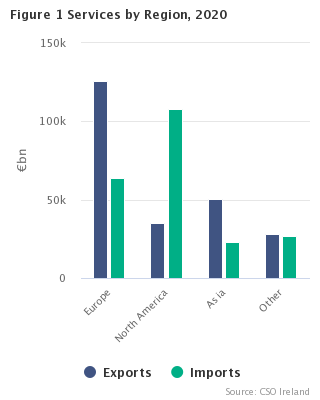
Service exports to Europe (€126bn) increased by €10bn between 2019 and 2020 due mainly to increased Computer service exports (+€11.8bn). The increased Computer service exports were predominantly to the UK (+€2.3bn), Germany (+€1.6bn), Italy (+€0.5bn) and France (+€0.5bn). (see Tables 2a & 2b).
Service exports to the US (€33bn) decreased by €2.8bn in the same period, mainly in Other Business services (-€2.3bn). Service exports to Japan (€10.1bn) increased by €1.7bn.
Services imports from Europe (€63.8bn) decreased by €27.2bn between 2019 and 2020 mainly due to decreased Royalties/Licences imports (-€22.5bn) and Tourism and Travel imports (-€3.6bn). Service imports from Netherlands, Switzerland, Spain and UK decreased by €21bn, €1.4bn, €1.1bn. and €1bn respectively.
In the same period, service imports from Offshore centres (€96.1bn) decrease by €50bn mainly due to decreased R&D imports (-€32.9bn) and decreased Royalty imports (-€18.4bn) while imports from the US (€107.6bn) increased by €48.2bn due to increased Royalty imports.
| 2020 | |
| Luxembourg | 309.9 |
| Malta | 217.8 |
| Ireland | 147.6 |
| Belgium | 46.2 |
| Denmark | 41.6 |
| Netherlands | 37.5 |
| Switzerland | 30.7 |
| Austria | 27.9 |
| Hungary | 25.6 |
| European Union - 27 | 24.7 |
| Portugal | 17.7 |
| France | 16.5 |
| Germany | 16.1 |
| Spain | 11.8 |
| Italy | 9.5 |
| Table 1 Exports and Imports of Services by Category, 20191 and 2020 | € million | ||||||
| 2019 1 | 2020 | ||||||
| Item | Exports | Imports | Net | Exports | Imports | Net | |
| Services | 230,153 | 335,716 | -105,564 | 244,069 | 305,968 | -61,899 | |
| Repairs & Processing | 2,049 | 6,261 | -4,211 | 2,707 | 7,377 | -4,669 | |
| Transport | 8,040 | 4,236 | 3,804 | 2,534 | 3,913 | -1,379 | |
| Tourism and travel | 5,787 | 7,375 | -1,588 | 1,645 | 2,071 | -427 | |
| Insurance | 10,270 | 8,362 | 1,908 | 11,284 | 9,282 | 2,002 | |
| Financial services | 17,620 | 15,687 | 1,933 | 19,128 | 16,943 | 2,185 | |
| Royalties/Licences | 10,481 | 85,850 | -75,369 | 13,084 | 84,421 | -71,337 | |
| Communications | 484 | 568 | -84 | 258 | 442 | -183 | |
| Computer services | 118,459 | 6,161 | 112,298 | 134,181 | 6,306 | 127,874 | |
| Total other business services | 48,106 | 199,717 | -151,611 | 48,215 | 173,741 | -125,526 | |
| Research and development | 5,487 | 137,007 | -131,520 | 9,197 | 104,183 | -94,985 | |
| Operational leasing | 19,425 | 1,186 | 18,239 | 18,121 | 1,183 | 16,938 | |
| Legal, accounting and other professional services | 1,193 | 4,140 | -2,948 | 848 | 3,095 | -2,248 | |
| Advertising and market research | 1,352 | 6,005 | -4,652 | 1,200 | 7,449 | -6,249 | |
| Trade related services | 2,779 | 22,200 | -19,422 | 2,028 | 22,431 | -20,403 | |
| Architectural engineering and other technical services | 332 | 65 | 267 | 291 | 311 | -21 | |
| Other | 17,539 | 29,115 | -11,576 | 16,531 | 35,089 | -18,558 | |
| Other services n.e.s. | 8,853 | 1,500 | 7,353 | 11,034 | 1,471 | 9,563 | |
| 1Revised | |||||||
| Table 2a Exports and Imports of Services Classified by Geographic Location, 2020 | € million | |||||||||||||||||||||||||||||||
| Region/Country | Total Services | Repairs & Processing | Transport | Tourism and Travel1 | Insurance | Financial services | Royalties/Licences | Communications | Computer services2 | Other services n.e.s. | Total other business services | |||||||||||||||||||||
| Exports | Imports | Exports | Imports | Exports | Imports | Exports | Imports | Exports | Imports | Exports | Imports | Exports | Imports | Exports | Imports | Exports | Imports | Exports | Imports | Exports | Imports | |||||||||||
| Europe | 125,989 | 63,785 | 1,072 | 1,547 | 2,133 | 1,655 | 703 | 1,361 | 8,638 | 6,132 | 13,308 | 7,770 | 5,123 | 10,763 | 108 | 114 | 71,948 | 1,113 | 5,592 | 1,175 | 17,365 | 32,154 | ||||||||||
| of which: | ||||||||||||||||||||||||||||||||
| Belgium | 4,064 | 4,203 | 6 | 66 | 61 | 63 | 15 | 15 | 241 | 41 | 239 | 13 | 21 | * | 2 | 0 | 1,860 | 15 | 289 | * | 1,330 | 3,887 | ||||||||||
| France | 9,720 | 3,703 | * | * | 156 | 110 | 61 | 110 | 1,064 | 587 | 363 | 197 | 56 | 47 | * | * | 5,529 | 37 | 1,031 | 11 | 1,422 | 2,204 | ||||||||||
| Germany | 17,424 | 5,951 | 6 | 145 | 268 | 171 | 93 | 62 | 1,478 | 1,594 | 494 | 34 | 242 | 33 | 9 | 1 | 11,793 | 40 | 2,018 | 36 | 1,024 | 3,835 | ||||||||||
| Italy | 7,985 | 3,354 | * | 464 | 128 | 50 | 38 | 76 | 2,413 | 938 | 550 | * | * | * | 3 | 1 | 3,383 | 33 | 629 | 0 | 697 | 1,220 | ||||||||||
| Luxembourg | -1,059 | 2,040 | 69 | 0 | 3 | 2 | 4 | 0 | 42 | 84 | 2,017 | 108 | * | 679 | 0 | * | 2,114 | 5 | * | * | 471 | 1,137 | ||||||||||
| Netherlands | 10,667 | 9,253 | * | 40 | 54 | 213 | 33 | 50 | 147 | 66 | 1,124 | 19 | * | 5,292 | 5 | 13 | 4,524 | 50 | 286 | 94 | 961 | 3,414 | ||||||||||
| Spain | 4,089 | 1,714 | 5 | * | 132 | 41 | 51 | 308 | 217 | 146 | 240 | 50 | 37 | * | 4 | * | 2,100 | 13 | 502 | 6 | 799 | 725 | ||||||||||
| Sweden | 4,746 | 943 | * | * | 66 | 49 | 8 | 8 | 227 | 45 | 181 | 28 | * | * | 2 | * | 2,776 | * | 474 | 47 | 699 | 469 | ||||||||||
| Switzerland | 6,837 | 5,902 | * | 70 | 39 | 66 | 0 | 0 | 160 | 136 | 265 | * | 149 | * | 3 | 6 | 3,738 | 7 | * | 1 | 1,537 | 1,778 | ||||||||||
| United Kingdom | 35,119 | 20,251 | 666 | 73 | 911 | 648 | 286 | 528 | 1,944 | 1,675 | 6,993 | 6,519 | 395 | 316 | 67 | 74 | 14,661 | 241 | 4,562 | 867 | 4,634 | 9,310 | ||||||||||
| EMU 193 | 60,689 | 32,407 | * | 1,375 | 916 | 707 | 357 | 752 | 5,833 | 3,549 | 5,396 | 1,008 | * | 6,426 | 34 | 29 | 36,849 | 199 | -728 | 215 | 7,760 | 18,147 | ||||||||||
| EU 274 | 74,714 | 35,790 | 143 | 1,401 | 1,106 | 899 | 412 | 826 | 6,333 | 3,869 | 5,667 | 1,033 | 4,556 | 6,485 | 37 | 33 | 47,609 | 860 | -283 | 304 | 9,133 | 20,081 | ||||||||||
| North America | 35,216 | 107,572 | * | * | 283 | 840 | 449 | 336 | 1,121 | 980 | 2,049 | 6,428 | * | * | 18 | 17 | 8,608 | 3,737 | 8,929 | 47 | 7,848 | 40,902 | ||||||||||
| of which: | ||||||||||||||||||||||||||||||||
| Canada | 2,208 | 510 | * | * | 10 | 33 | 86 | 47 | 13 | 12 | 106 | 17 | * | * | * | 0 | 325 | 20 | 880 | 0 | 630 | 236 | ||||||||||
| United States | 33,007 | 107,062 | * | * | 273 | 807 | 362 | 289 | 1,109 | 968 | 1,943 | 6,411 | * | * | * | 17 | 8,283 | 3,716 | 8,048 | 44 | 7,218 | 40,666 | ||||||||||
| Central America | 4,308 | 84,752 | * | * | 0 | 21 | 1 | 0 | 239 | 933 | * | * | * | * | 3 | 38 | 1,122 | 37 | -23 | 4 | 1,295 | 71,354 | ||||||||||
| of which: | ||||||||||||||||||||||||||||||||
| Bermuda | 1,432 | * | * | 1 | 0 | 0 | 0 | 0 | 151 | 799 | 102 | * | * | * | 3 | 38 | 27 | 0 | 0 | 0 | 126 | * | ||||||||||
| South America | 2,324 | 450 | 0 | 2 | 7 | 62 | 9 | 0 | 52 | 25 | * | * | * | * | 0 | 0 | 1,124 | 13 | 58 | 1 | 988 | 300 | ||||||||||
| of which: | ||||||||||||||||||||||||||||||||
| Brazil | 777 | 229 | 0 | 1 | 0 | 20 | 9 | 0 | 24 | 16 | * | * | * | 0 | 0 | 0 | 114 | * | 98 | 1 | 496 | 158 | ||||||||||
| Asia | 50,602 | 22,826 | 50 | * | 7 | 605 | 308 | 9 | 308 | 965 | 1,036 | 9 | 659 | 340 | 1,050 | * | 56 | 32 | 35,906 | 263 | -343 | 82 | 11,944 | 8,898 | ||||||||
| of which: | ||||||||||||||||||||||||||||||||
| China | 6,988 | 5,010 | 0 | * | 0 | 241 | 87 | 0 | 87 | 285 | * | 0 | 24 | * | 34 | 13 | * | 15 | * | 47 | * | 3 | 2,015 | 786 | ||||||||
| Japan | 10,122 | 1,764 | 0 | * | 2 | 77 | 4 | 9 | 4 | 40 | 49 | 9 | 169 | 94 | * | 460 | 2 | 4 | 5,724 | 39 | 981 | * | * | 985 | ||||||||
| Korea, Republic of (South Korea) | 2,909 | 232 | 0 | * | 0 | 58 | 1 | 0 | 1 | * | * | 0 | 27 | * | 32 | 0 | 10 | 1 | * | 6 | 730 | 0 | 639 | 80 | ||||||||
| Taiwan | 1,354 | 547 | 0 | * | 0 | 30 | 0 | 0 | 0 | 3 | * | 0 | 57 | 6 | * | 0 | 1 | 0 | * | 1 | 140 | 0 | 290 | 110 | ||||||||
| Africa | 4,124 | 614 | 1 | * | 0 | 22 | 8 | 0 | 61 | 52 | 248 | * | * | * | 5 | 0 | * | 16 | 146 | 1 | 717 | 468 | ||||||||||
| of which: | ||||||||||||||||||||||||||||||||
| South Africa | 2,245 | 341 | 1 | 0 | 0 | 6 | 2 | 0 | 29 | 35 | 157 | 20 | * | 0 | 1 | 0 | * | 14 | 165 | 0 | 150 | 266 | ||||||||||
| Oceania and Polar regions | 6,811 | 1,251 | 1 | 6 | 1 | 11 | 5 | 20 | 102 | 66 | 80 | 5 | 156 | 3 | 5 | 1 | * | 30 | * | * | 861 | * | ||||||||||
| of which: | ||||||||||||||||||||||||||||||||
| Australia | 6,276 | 1,194 | 1 | 6 | 1 | 7 | 5 | 19 | 95 | 63 | 60 | 4 | 147 | 3 | 5 | 1 | * | 30 | * | * | 764 | * | ||||||||||
| Not geographically allocated5 | 14,652 | * | * | * | 103 | 697 | 163 | 344 | * | * | 2,282 | 2,210 | 1,133 | 1,264 | 63 | 241 | 7,787 | 1,098 | -4,168 | 162 | 7,193 | 18,557 | ||||||||||
| International Organisations | 46 | * | 0 | 0 | 0 | 0 | 0 | 0 | * | * | 0 | 0 | 0 | 0 | 0 | 0 | 1 | 0 | * | * | 4 | * | ||||||||||
| Total | 244,071 | 305,968 | 2,707 | 7,377 | 2,534 | 3,913 | 1,645 | 2,071 | 11,284 | 9,282 | 19,128 | 16,943 | 13,084 | 84,421 | 258 | 442 | 134,181 | 6,306 | 11,034 | 1,471 | 48,215 | 173,741 | ||||||||||
| of which: | ||||||||||||||||||||||||||||||||
| All offshore centres6 | 13,208 | 96,117 | * | * | 0 | 64 | 62 | 0 | 427 | 1,373 | 873 | * | 856 | 18,961 | 16 | 40 | * | 78 | * | 4 | 2,240 | 74,814 | ||||||||||
| Table 2a Exports and Imports of Services Classified by Geographic Location, 2020 - continued | € million | |||||||||||||||||||||||||||||||
| Region/Country | Research and development | Operational Leasing | Legal, accounting and other professional services | Advertising and market research | Trade related services | Architectural engineering and other technical services | Other | Total other business services | ||||||||||||||||||||||||
| Exports | Imports | Exports | Imports | Exports | Imports | Exports | Imports | Exports | Imports | Exports | Imports | Exports | Imports | Exports | Imports | |||||||||||||||||
| Europe | 727 | 4,506 | 5,886 | 546 | 485 | 621 | 383 | 811 | 1,159 | 13,662 | 194 | 29 | 8,532 | 11,980 | 17,365 | 32,154 | ||||||||||||||||
| of which: | ||||||||||||||||||||||||||||||||
| Belgium | 34 | * | 38 | 0 | 27 | 54 | * | * | 56 | 1,268 | * | 0 | * | 1,265 | 1,330 | 3,887 | ||||||||||||||||
| France | 13 | 84 | 771 | * | * | 78 | * | * | 117 | 1,304 | * | * | 438 | 608 | 1,422 | 2,204 | ||||||||||||||||
| Germany | 34 | 190 | 378 | 5 | * | 93 | * | 132 | 135 | 1,866 | * | 1 | 297 | 1,548 | 1,024 | 3,835 | ||||||||||||||||
| Italy | 4 | 52 | 293 | * | 16 | 28 | 4 | 28 | * | 320 | * | * | 262 | 778 | 697 | 1,220 | ||||||||||||||||
| Luxembourg | * | * | * | * | 4 | 3 | * | * | -1 | 34 | * | * | 426 | 354 | 471 | 1,137 | ||||||||||||||||
| Netherlands | * | * | 193 | * | 50 | * | * | * | 55 | * | 3 | 16 | 460 | 728 | 961 | 3,414 | ||||||||||||||||
| Spain | 3 | 38 | 402 | 20 | * | 40 | * | * | * | 372 | * | * | 231 | 232 | 799 | 725 | ||||||||||||||||
| Sweden | * | * | 209 | * | 11 | 5 | * | * | 27 | 238 | * | * | 312 | 184 | 699 | 469 | ||||||||||||||||
| Switzerland | * | 94 | 67 | 0 | 32 | 9 | 4 | * | 49 | 749 | * | * | 1,234 | 915 | 1,537 | 1,778 | ||||||||||||||||
| United Kingdom | 95 | 417 | 827 | * | * | 171 | * | 376 | 353 | 3,899 | 20 | * | 3,008 | 4,294 | 4,634 | 9,310 | ||||||||||||||||
| EMU 193 | 463 | 3,711 | 2,566 | * | * | 389 | * | 384 | 665 | 7,656 | * | * | 3,581 | 5,892 | 7,760 | 18,147 | ||||||||||||||||
| EU 274 | 603 | 3,920 | 3,220 | * | * | 436 | * | 421 | 745 | 8,605 | * | * | 4,051 | 6,566 | 9,133 | 20,081 | ||||||||||||||||
| North America | 3,199 | 19,264 | 1,479 | 16 | * | 1,094 | * | 4,143 | * | * | 5 | * | 2,120 | 16,052 | 7,848 | 40,902 | ||||||||||||||||
| of which: | ||||||||||||||||||||||||||||||||
| Canada | * | 42 | 356 | 0 | * | 9 | * | 49 | * | * | 1 | * | 186 | 118 | 630 | 236 | ||||||||||||||||
| United States7 | * | 19,223 | 1,123 | 16 | 124 | 1,084 | * | 4,094 | * | * | 4 | * | 1,934 | 15,934 | 7,218 | 40,666 | ||||||||||||||||
| Central America | * | 71,162 | 795 | * | * | * | * | * | 44 | * | 3 | * | 222 | 4 | 1,295 | 71,354 | ||||||||||||||||
| of which: | ||||||||||||||||||||||||||||||||
| Bermuda | 2 | * | * | * | 17 | 0 | 3 | 0 | 43 | * | * | 0 | * | * | 126 | * | ||||||||||||||||
| South America | * | 23 | 932 | * | * | * | 0 | * | * | * | 0 | 0 | 53 | 111 | 988 | 300 | ||||||||||||||||
| of which: | ||||||||||||||||||||||||||||||||
| Brazil | * | 11 | 463 | 0 | * | * | 0 | * | 0 | * | * | * | * | 49 | 496 | 158 | ||||||||||||||||
| Asia | 215 | 1,547 | 7,798 | 261 | * | 136 | * | 420 | 67 | 3,971 | * | 0 | 3,747 | 2,562 | 11,944 | 8,898 | ||||||||||||||||
| of which: | ||||||||||||||||||||||||||||||||
| China | 1 | * | 1,956 | * | 6 | 9 | 1 | * | 12 | * | 1 | * | 38 | 288 | 2,015 | 786 | ||||||||||||||||
| Japan | 5 | 92 | 160 | 84 | * | * | * | * | 18 | * | 1 | * | * | 207 | * | 985 | ||||||||||||||||
| Korea, Republic of (South Korea) | * | * | 551 | * | * | 2 | 0 | * | * | * | 0 | 0 | 76 | 49 | 639 | 80 | ||||||||||||||||
| Taiwan | 0 | * | 273 | * | 0 | 1 | 0 | * | 0 | * | 0 | 0 | 16 | 17 | 290 | 110 | ||||||||||||||||
| Africa | 1 | * | 622 | 0 | 6 | 9 | * | * | 19 | 333 | * | 0 | * | 114 | 717 | 468 | ||||||||||||||||
| of which: | ||||||||||||||||||||||||||||||||
| South Africa | 0 | * | 90 | 0 | 2 | 1 | 1 | * | 8 | 180 | 0 | 0 | 49 | 79 | 150 | 266 | ||||||||||||||||
| Oceania and Polar regions | * | * | 183 | * | * | 9 | 2 | 20 | 22 | * | * | 0 | * | 130 | 861 | * | ||||||||||||||||
| of which: | ||||||||||||||||||||||||||||||||
| Australia | * | 63 | 137 | 1 | * | 9 | 1 | 20 | 20 | * | * | 0 | * | 126 | 764 | * | ||||||||||||||||
| Not geographically allocated5 | 4,828 | 7,606 | 426 | 281 | 94 | * | 80 | * | 508 | 3,112 | 66 | * | 1,191 | 4,137 | 7,193 | 18,557 | ||||||||||||||||
| International Organisations | * | * | 0 | * | 1 | * | * | * | 2 | * | * | * | 1 | 0 | 4 | * | ||||||||||||||||
| Total | 9,197 | 104,183 | 18,121 | 1,183 | 848 | 3,095 | 1,200 | 7,449 | 2,028 | 22,431 | 291 | 311 | 16,531 | 35,089 | 48,215 | 173,741 | ||||||||||||||||
| of which: | ||||||||||||||||||||||||||||||||
| All offshore centres6 | 218 | 71,205 | 905 | 105 | 66 | 80 | * | * | 58 | * | * | * | 973 | 1,559 | 2,240 | 74,814 | ||||||||||||||||
| 1Passenger fare receipts of resident carriers from foreign visitors are excluded from tourism and travel exports; such receipts are included under transport exports - see Background Notes. | ||||||||||||||||||||||||||||||||
| 2Covers exports and imports of software that was not incorporated as part of computer hardware or physical media but separately transmitted by electronic means.The value of sales and purchases of additional software licences is also included. | ||||||||||||||||||||||||||||||||
| 3The relevant EMU countries are: Austria, Belgium, Cyprus, Estonia, Finland, France, Germany, Greece, Italy, Latvia, Lithuania, Luxembourg, Malta, Netherlands, Portugal, Slovakia, Slovenia and Spain. | ||||||||||||||||||||||||||||||||
| 4For analytical purposes, additional details are given of transactions between residents of Ireland and residents of the EU27 area, which excludes the United Kingdom following their withdrawal from the European Union on 1 February 2020. | ||||||||||||||||||||||||||||||||
| 5This category covers data supplied by respondents without a geographical breakdown. | ||||||||||||||||||||||||||||||||
| 6This category overlaps with the regions referred to above and covers Andorra, Anguilla, Antigua and Barbuda, Aruba, Bahamas, Bahrain, Barbados, Belize, Bermuda, British Virgin Islands, Cayman Islands, Cook Islands, Curacao, Dominica, Gibraltar, Grenada, Guernsey, Hong Kong, Isle of Man, Jersey, Lebanon, Liberia,Liechtenstein, Marshall Islands, Mauritius, Montserrat, Nauru, Niue, Panama, Philippines, Saint Lucia, Saint Vincent and the Grenadines, Samoa, Seychelles, Singapore, St Kitts and Nevis, St Maarten, Turks and Caicos Islands, US Virgin Islands, Vanuatu. | ||||||||||||||||||||||||||||||||
| 7United States includes Peurto Rico | ||||||||||||||||||||||||||||||||
| *Suppressed for confidentiality reasons but included in the higher level aggregates. | ||||||||||||||||||||||||||||||||
| Table 2b Exports and Imports of Services Classified by Geographic Location, 20191 | € million | |||||||||||||||||||||||||||||||
| Region/Country | Total Services | Repairs & Processing | Transport | Tourism and Travel2 | Insurance | Financial services | Royalties/Licences | Communications | Computer services3 | Other services n.e.s. | Total other business services | |||||||||||||||||||||
| Exports | Imports | Exports | Imports | Exports | Imports | Exports | Imports | Exports | Imports | Exports | Imports | Exports | Imports | Exports | Imports | Exports | Imports | Exports | Imports | Exports | Imports | |||||||||||
| Europe | 115,979 | 90,991 | 858 | 1,451 | 6,713 | 1,726 | 2,879 | 4,980 | 7,772 | 6,154 | 12,664 | 7,490 | 1,784 | 33,267 | 175 | 193 | 60,132 | 917 | 5,312 | 1,173 | 17,688 | 33,640 | ||||||||||
| of which: | ||||||||||||||||||||||||||||||||
| Belgium | 3,696 | 5,042 | * | * | 195 | 60 | 62 | 70 | 71 | 38 | 221 | 8 | * | * | * | 0 | 1,453 | * | 312 | 15 | 1,331 | 4,607 | ||||||||||
| France | 9,262 | 4,619 | 11 | * | 547 | 145 | 301 | 440 | 614 | 545 | 314 | 168 | 122 | 106 | 35 | 1 | 5,017 | 41 | 976 | * | 1,325 | 2,612 | ||||||||||
| Germany | 16,517 | 5,247 | 6 | 97 | 945 | 183 | 470 | 255 | 1,378 | 1,604 | 418 | 41 | 252 | 28 | 9 | 1 | 10,155 | 36 | 1,765 | 32 | 1,119 | 2,968 | ||||||||||
| Italy | 7,932 | 3,659 | * | * | 463 | 45 | 192 | 366 | 2,335 | 862 | 515 | * | * | 23 | 3 | 1 | 2,839 | 34 | * | * | 945 | 1,417 | ||||||||||
| Luxembourg | -126 | 2,221 | 61 | 0 | 10 | 2 | 20 | 3 | 40 | 81 | 2,032 | 66 | * | * | 0 | * | * | 5 | * | 11 | 479 | 383 | ||||||||||
| Netherlands | 7,342 | 30,284 | 2 | * | 191 | 212 | 144 | 153 | 154 | 77 | 968 | 24 | 90 | * | 5 | 13 | 4,597 | 16 | 307 | 71 | 885 | 3,322 | ||||||||||
| Spain | 4,631 | 2,809 | * | * | 465 | 43 | 236 | 1,346 | 211 | 156 | 207 | 38 | 54 | * | * | * | 1,859 | 11 | 438 | 7 | 1,152 | 887 | ||||||||||
| Sweden | 4,555 | 988 | * | * | 235 | 59 | 38 | 20 | 183 | 35 | 147 | 24 | * | 3 | 2 | * | 2,775 | * | 378 | 35 | 675 | 465 | ||||||||||
| Switzerland | 5,553 | 7,319 | 132 | * | 109 | 50 | 1 | 2 | 126 | 140 | 268 | * | 156 | * | 3 | 26 | 3,346 | 10 | 591 | 1 | 821 | * | ||||||||||
| United Kingdom | 35,346 | 21,296 | 608 | 50 | 2,488 | 678 | 1,055 | 1,403 | 1,950 | 1,898 | 6,746 | 6,338 | 465 | 299 | 106 | 90 | 12,325 | 231 | 4,483 | 900 | 5,119 | 9,409 | ||||||||||
| EMU 194 | 54,661 | 56,628 | 114 | 1,348 | 3,210 | 752 | 1,660 | 3,233 | 5,028 | 3,486 | 5,014 | 902 | 841 | 28,515 | 62 | * | 31,166 | 163 | -787 | * | 8,353 | 17,992 | ||||||||||
| EU 275 | 66,986 | 59,973 | 119 | 1,351 | 3,894 | 951 | 1,803 | 3,519 | 5,446 | 3,732 | 5,258 | 948 | 1,126 | 28,590 | 65 | * | 39,873 | 672 | -314 | * | 9,718 | 19,866 | ||||||||||
| North America | 38,263 | 58,807 | 63 | * | 1,048 | 1,096 | 1,916 | 1,214 | * | 908 | 1,612 | 5,806 | * | * | 28 | 13 | 9,392 | 3,005 | 7,780 | 48 | 10,104 | 32,608 | ||||||||||
| of which: | ||||||||||||||||||||||||||||||||
| Canada | 2,426 | 589 | 0 | * | 42 | 46 | 309 | 139 | * | 10 | 89 | 6 | * | * | 1 | 0 | 302 | 16 | 900 | 1 | 573 | 244 | ||||||||||
| United States | 35,836 | 58,217 | 67 | * | 1,006 | 1,051 | 1,606 | 1,075 | * | 898 | 1,523 | 5,800 | * | * | 27 | 13 | 9,091 | 2,990 | 6,880 | 48 | 9,531 | 32,364 | ||||||||||
| Central America | 4,784 | 137,049 | * | * | 0 | 30 | 3 | 0 | 232 | 572 | 487 | * | * | 31,921 | 3 | 38 | 672 | 34 | -170 | * | 1,212 | 104,347 | ||||||||||
| of which: | ||||||||||||||||||||||||||||||||
| Bermuda | 2,169 | 64,094 | * | 0 | 0 | 10 | 0 | 0 | 130 | 473 | 97 | * | * | 5,848 | 3 | 38 | 27 | 0 | * | * | 147 | 57,725 | ||||||||||
| South America | 1,364 | 441 | * | 0 | 22 | 65 | 6 | 0 | * | 30 | 20 | * | * | * | 0 | 0 | 148 | 5 | 27 | * | 1,053 | 332 | ||||||||||
| of which: | ||||||||||||||||||||||||||||||||
| Brazil | 666 | 253 | 0 | 0 | 0 | 311 | 6 | 0 | 26 | * | 7 | * | 0 | 0 | 0 | 0 | 92 | 0 | 24 | 4 | 511 | 200 | ||||||||||
| Asia | 44,165 | 17,993 | * | 3,796 | 7 | 547 | 494 | 50 | 882 | 641 | 592 | 269 | 853 | * | * | * | 28,324 | 241 | 437 | 93 | 12,383 | 7,011 | ||||||||||
| of which: | ||||||||||||||||||||||||||||||||
| China | 6,478 | 4,073 | 0 | * | 0 | 185 | 134 | 0 | * | * | 9 | * | 29 | 13 | 1 | 19 | * | 35 | 292 | 4 | 2,203 | 650 | ||||||||||
| Japan | 8,407 | 1,752 | 0 | * | 2 | 71 | 10 | 48 | 49 | * | 162 | 77 | * | 462 | 72 | 10 | * | 40 | 836 | 1 | 2,579 | 953 | ||||||||||
| South Korea | 2,164 | 219 | 0 | * | 0 | 48 | 3 | 0 | * | * | 24 | * | 38 | 0 | 10 | 1 | * | 8 | 655 | 1 | 585 | 90 | ||||||||||
| Taiwan | 1,054 | 514 | 0 | * | 0 | 23 | 0 | 0 | 6 | 3 | 50 | * | * | 0 | 1 | 0 | * | 1 | 129 | 0 | 348 | 80 | ||||||||||
| Africa | 3,326 | 648 | * | * | 0 | 23 | 11 | 0 | 84 | 44 | 206 | 23 | * | * | 13 | 0 | 2,117 | 15 | 186 | 5 | 678 | 530 | ||||||||||
| of which: | ||||||||||||||||||||||||||||||||
| South Africa | 1,855 | 357 | 1 | 0 | 0 | 8 | 4 | 0 | * | 31 | 172 | 21 | * | 0 | 9 | 0 | 1,285 | 14 | 155 | 0 | 168 | 283 | ||||||||||
| Oceania and Polar regions | 5,491 | 1,212 | 1 | 2 | 6 | 9 | 9 | 57 | 39 | 23 | * | 6 | 136 | * | 20 | 1 | * | * | 681 | 1 | 796 | * | ||||||||||
| of which: | ||||||||||||||||||||||||||||||||
| Australia | 5,190 | 1,149 | 1 | 2 | 6 | 6 | 9 | 53 | 31 | 19 | * | * | 129 | * | 13 | 1 | * | 28 | 610 | 1 | 725 | * | ||||||||||
| Not geographically allocated6 | 16,751 | * | * | * | 244 | 739 | 469 | 1,074 | * | -11 | 1,956 | 2,010 | 1,097 | 2,175 | * | * | * | * | -5,409 | 176 | 4,186 | * | ||||||||||
| International Organisations | 30 | * | 0 | 0 | 0 | 0 | 0 | 0 | * | 0 | * | 0 | * | 0 | 0 | 0 | 1 | 0 | 9 | 0 | 4 | * | ||||||||||
| Total | 230,153 | 335,716 | 2,049 | 6,261 | 8,040 | 4,236 | 5,787 | 7,375 | 10,270 | 8,362 | 17,620 | 15,687 | 10,481 | 85,850 | 484 | 568 | 118,459 | 6,161 | 8,852 | 1,500 | 48,106 | 199,717 | ||||||||||
| of which: | ||||||||||||||||||||||||||||||||
| All offshore centres7 | 12,155 | 146,146 | * | 407 | 0 | 63 | 96 | 2 | 399 | 936 | 947 | 261 | 1,677 | 37,380 | * | 40 | 7,045 | 71 | -1,284 | 4 | 2,381 | 106,983 | ||||||||||
| Table 2b Exports and Imports of Services Classified by Geographic Location, 20191 - continued | € million | |||||||||||||||||||||||||||||||
| Region/Country | Research and development | Operational Leasing | Legal, accounting and other professional services | Advertising and market research | Trade related services | Architectural engineering and other technical services | Other | Total other business services | ||||||||||||||||||||||||
| Exports | Imports | Exports | Imports | Exports | Imports | Exports | Imports | Exports | Imports | Exports | Imports | Exports | Imports | Exports | Imports | |||||||||||||||||
| Europe | 749 | 5,937 | 6,137 | 544 | 647 | 825 | * | 768 | * | 12,723 | * | 40 | 7,262 | 12,802 | 17,688 | 33,640 | ||||||||||||||||
| of which: | ||||||||||||||||||||||||||||||||
| Belgium | 34 | * | 60 | 0 | 30 | 36 | 2 | * | * | 995 | 2 | 0 | * | 2,337 | 1,331 | 4,607 | ||||||||||||||||
| France | 12 | 69 | 838 | * | 39 | 118 | 54 | 77 | 151 | 1,277 | 14 | * | 212 | 996 | 1,325 | 2,612 | ||||||||||||||||
| Germany | 43 | 115 | 389 | 3 | * | 99 | * | 114 | 198 | 1,647 | 7 | 0 | * | 990 | 1,119 | 2,968 | ||||||||||||||||
| Italy | 4 | * | 268 | * | 19 | 33 | 4 | * | * | 397 | * | * | * | 851 | 945 | 1,417 | ||||||||||||||||
| Luxembourg | * | * | 29 | * | 7 | * | * | 1 | * | 44 | 0 | * | 433 | 327 | 479 | 383 | ||||||||||||||||
| Netherlands | * | * | 182 | 8 | 65 | 61 | * | * | 66 | * | 3 | * | 367 | 704 | 885 | 3,322 | ||||||||||||||||
| Spain | 6 | 43 | 465 | 27 | * | 61 | * | 30 | * | 367 | * | 0 | 255 | 359 | 1,152 | 887 | ||||||||||||||||
| Sweden | * | * | 198 | * | * | 4 | * | * | 37 | 260 | 1 | * | 272 | 179 | 675 | 465 | ||||||||||||||||
| Switzerland | 23 | * | 89 | 0 | 39 | 8 | * | 7 | 48 | 402 | * | 0 | 467 | 181 | 821 | * | ||||||||||||||||
| United Kingdom | 109 | 229 | 905 | * | 290 | * | 193 | 345 | 574 | 3,804 | 20 | * | 3,029 | 4,598 | 5,119 | 9,409 | ||||||||||||||||
| EMU 194 | 459 | 2,818 | 2,639 | 116 | * | 482 | 291 | 372 | * | 7,135 | * | 26 | 3,274 | 7,044 | 8,353 | 17,992 | ||||||||||||||||
| EU 275 | 610 | 3,009 | 3,312 | 130 | * | 536 | 295 | 407 | * | 8,085 | * | 27 | 3,632 | 7,672 | 9,718 | 19,866 | ||||||||||||||||
| North America | 3,404 | 16,385 | 1,479 | 9 | * | 1,844 | * | * | * | * | * | 22 | 4,047 | 11,366 | 10,104 | 32,608 | ||||||||||||||||
| of which: | ||||||||||||||||||||||||||||||||
| Canada | * | 36 | 312 | 0 | * | 4 | * | * | * | * | 1 | * | 86 | 141 | 573 | 244 | ||||||||||||||||
| United States | * | 16,349 | 1,166 | 9 | 211 | 1,840 | * | 2,269 | * | * | * | * | 3,961 | 11,225 | 9,531 | 32,364 | ||||||||||||||||
| Central America | * | * | 806 | * | 37 | * | * | * | 43 | * | 3 | 0 | 220 | 90 | 1,212 | 104,347 | ||||||||||||||||
| of which: | ||||||||||||||||||||||||||||||||
| Bermuda | 2 | * | 18 | * | 17 | * | 3 | 0 | 43 | * | 3 | 0 | 61 | 7 | 147 | 57,725 | ||||||||||||||||
| South America | * | * | 1,080 | * | * | * | 0 | * | * | * | * | 1 | -31 | 94 | 1,053 | 332 | ||||||||||||||||
| of which: | ||||||||||||||||||||||||||||||||
| Brazil | * | 17 | 511 | 0 | * | * | 0 | 69 | * | * | 0 | * | -3 | 44 | 511 | 200 | ||||||||||||||||
| Asia | 102 | 747 | 8,736 | 267 | 149 | 175 | * | 383 | 66 | 3,879 | * | 0 | 3,257 | 1,561 | 12,383 | 7,011 | ||||||||||||||||
| of which: | ||||||||||||||||||||||||||||||||
| China | 1 | * | 2,119 | * | 8 | 10 | 3 | * | 12 | 88 | 1 | * | 60 | 200 | 2,203 | 650 | ||||||||||||||||
| Japan | * | 38 | 166 | 88 | * | * | 36 | * | 18 | * | 1 | * | * | 211 | 2,579 | 953 | ||||||||||||||||
| Korea, Republic of (South Korea) | * | * | 581 | 12 | * | * | 0 | * | * | * | 0 | * | -9 | 35 | 585 | 90 | ||||||||||||||||
| Taiwan | 0 | * | 335 | * | 0 | * | 0 | * | 0 | * | 0 | 0 | 13 | 27 | 348 | 80 | ||||||||||||||||
| Africa | * | * | 546 | 0 | * | 10 | 1 | * | * | 359 | * | 0 | * | 114 | 678 | 530 | ||||||||||||||||
| of which: | ||||||||||||||||||||||||||||||||
| South Africa | 0 | * | 103 | 0 | * | * | * | * | * | 195 | 0 | 0 | 50 | 82 | 168 | 283 | ||||||||||||||||
| Oceania and Polar regions | * | * | 216 | * | * | 23 | * | 27 | 22 | * | * | 0 | * | 80 | 796 | * | ||||||||||||||||
| of which: | ||||||||||||||||||||||||||||||||
| Australia | * | 65 | 170 | 2 | 36 | 23 | * | 27 | 20 | * | * | 0 | * | 69 | 725 | * | ||||||||||||||||
| Not geographically allocated6 | 1,112 | 9,793 | 425 | 275 | 88 | 1,253 | 57 | 2,358 | 206 | * | 88 | 0 | 2,209 | 3,008 | 4,186 | * | ||||||||||||||||
| International Organisations | 0 | * | 0 | * | 1 | 0 | 0 | * | 2 | * | 0 | 0 | 1 | 0 | 4 | * | ||||||||||||||||
| Total | 5,487 | 137,007 | 19,425 | 1,186 | 1,193 | 4,140 | 1,352 | 6,005 | 2,779 | 22,200 | 332 | 65 | 17,539 | 29,115 | 48,106 | 199,717 | ||||||||||||||||
| of which: | ||||||||||||||||||||||||||||||||
| All offshore centres7 | 186 | 104,079 | 1,041 | 115 | 114 | 103 | * | 42 | 56 | 1,907 | * | 0 | 963 | 737 | 2,381 | 106,983 | ||||||||||||||||
| 1Revised | ||||||||||||||||||||||||||||||||
| 2Passenger fare receipts of resident carriers from foreign visitors are excluded from tourism and travel exports; such receipts are included under transport exports - see Background Notes. | ||||||||||||||||||||||||||||||||
| 3Covers exports and imports of software that was not incorporated as part of computer hardware or physical media but separately transmitted by electronic means. The value of sales and purchases of additional software licences is also included. | ||||||||||||||||||||||||||||||||
| 4The relevant EMU countries are: Austria, Belgium, Cyprus, Estonia, Finland, France, Germany, Greece, Italy, Latvia, Lithuania, Luxembourg, Malta, Netherlands, Portugal, Slovakia, Slovenia and Spain. | ||||||||||||||||||||||||||||||||
| 5For analytical purposes, additional details are given of transactions between residents of Ireland and residents of the EU27 area. which excludes the United Kingdom following their withdrawal from the European Union on 1 February 2020. | ||||||||||||||||||||||||||||||||
| 6This category covers data supplied by respondents without a geographical breakdown. | ||||||||||||||||||||||||||||||||
| 7This category overlaps with the regions referred to above and covers Andorra, Anguilla, Antigua and Barbuda, Aruba, Bahamas, Bahrain, Barbados, Belize, Bermuda, British Virgin Islands, Cayman Islands, Cook Islands,Curacao, Dominica, Gibraltar, Grenada, Guernsey, Hong Kong, Isle of Man, Jersey, Lebanon, Liberia, Liechtenstein, Marshall Islands, Mauritius, Montserrat, Nauru, Niue, Panama, Philippines, Saint Lucia, Saint Vincent and the Grenadines, Samoa, Seychelles, Singapore, St. Kitts and Nevis, St Maarten, Turks and Caicos Islands, US Virgin Islands, Vanuatu. | ||||||||||||||||||||||||||||||||
| *Suppressed for confidentiality reasons but included in the higher level aggregates. | ||||||||||||||||||||||||||||||||
| Table 3 Exports and Imports of Services classified by country, 2019 and 2020 | € million | ||||||
| Region/Country | 2019 1 | 2020 | |||||
| Exports | Imports | Net | Exports | Imports | Net | ||
| Algeria | * | 3 | * | * | 3 | * | |
| Angola | * | 0 | * | * | * | * | |
| Argentina | 67 | 123 | -55 | 287 | 116 | 171 | |
| Australia | 5,190 | 1,149 | 4,041 | 6,276 | 1,194 | 5,081 | |
| Austria | 1,345 | 531 | 814 | 1,795 | 447 | 1,348 | |
| Bahamas | 21 | * | * | 15 | * | * | |
| Bahrain | 121 | * | * | 127 | * | * | |
| Barbados | 102 | * | * | 22 | * | * | |
| Belarus | 76 | 4 | 72 | 192 | 4 | 188 | |
| Belgium | 3,696 | 5,042 | -1,346 | 4,064 | 4,203 | -139 | |
| Bermuda | 2,169 | 64,094 | -61,925 | 1,432 | * | * | |
| Bosnia and Herzegovina | * | 1 | * | * | 1 | * | |
| Brazil | 666 | 253 | 412 | 777 | 229 | 548 | |
| Virgin Islands, British | 69 | * | * | * | * | * | |
| Bulgaria | 124 | 32 | 91 | 127 | 23 | 104 | |
| Canada | 2,426 | 589 | 1,837 | 2,208 | 510 | 1,698 | |
| Cayman Islands | 653 | * | * | 570 | * | * | |
| Chile | 375 | 18 | 356 | 496 | 50 | 447 | |
| China | 6,478 | 4,073 | 2,405 | 6,988 | 5,010 | 1,978 | |
| Colombia | 183 | 26 | 156 | 340 | 35 | 306 | |
| Costa Rica | * | 71 | * | 65 | 102 | -37 | |
| Croatia | 108 | 99 | 9 | 207 | 32 | 175 | |
| Curacao | 2 | * | * | 2 | 0 | 2 | |
| Cyprus | -366 | 43 | -409 | 573 | 46 | 526 | |
| Czech Republic | 574 | 367 | 207 | 726 | 366 | 361 | |
| Denmark | 2,361 | 673 | 1,688 | 2,430 | 893 | 1,537 | |
| Dominican Republic | 3 | 1 | 2 | 7 | 1 | 6 | |
| Ecuador | 12 | 4 | 7 | * | 4 | * | |
| Egypt | 317 | 93 | 224 | 699 | 116 | 583 | |
| El Salvador | 6 | 0 | 6 | 1 | 1 | 1 | |
| Estonia | 90 | 37 | 52 | 146 | 26 | 120 | |
| Ethiopia | 247 | * | * | 239 | * | * | |
| Finland | 1,516 | 775 | 741 | 1,750 | 761 | 990 | |
| France | 9,262 | 4,619 | 4,643 | 9,720 | 3,703 | 6,017 | |
| Georgia | * | 1 | * | * | * | 12 | |
| Germany | 16,517 | 5,247 | 11,270 | 17,424 | 5,951 | 11,473 | |
| Gibraltar | 112 | * | * | 182 | * | * | |
| Greece | 559 | 260 | 299 | 727 | 151 | 576 | |
| Guernsey | 96 | 14 | 81 | 77 | 14 | 63 | |
| Hong Kong | 5,535 | 913 | 4,622 | * | 829 | * | |
| Hungary | 2,501 | 145 | 2,356 | 3,112 | 97 | 3,015 | |
| Iceland | 118 | 4 | 114 | 103 | 4 | 99 | |
| India | 3,065 | 1,212 | 1,852 | 2,687 | 1,474 | 1,213 | |
| Indonesia | 1,039 | 66 | 973 | 1,007 | 77 | 930 | |
| Isle of Man | 61 | 57 | 4 | 109 | 77 | 32 | |
| Israel | 2,580 | 365 | 2,215 | 3,279 | 836 | 2,444 | |
| Italy | 7,932 | 3,659 | 4,272 | 7,985 | 3,354 | 4,631 | |
| Jamaica | 4 | 3 | 2 | 3 | * | * | |
| Japan | 8,407 | 1,752 | 6,655 | 10,122 | 1,764 | 8,358 | |
| Jersey | 122 | * | * | 104 | * | * | |
| Jordan | 140 | * | * | 194 | 26 | 168 | |
| Kazakhstan | 207 | 11 | 196 | 296 | 9 | 287 | |
| Kenya | 151 | 19 | 131 | 194 | 24 | 171 | |
| South Korea | 2,164 | 219 | 1,946 | 2,909 | 232 | 2,677 | |
| Kuwait | 278 | * | * | 368 | 25 | 342 | |
| Latvia | 160 | 28 | 132 | 231 | 16 | 215 | |
| Lebanon | * | * | 38 | * | 38 | * | |
| Libya | * | * | * | 35 | * | * | |
| Liechtenstein | 43 | 116 | -74 | 49 | 186 | -136 | |
| Lithuania | 164 | 37 | 127 | 226 | 24 | 202 | |
| Luxembourg | -126 | 2,221 | -2,347 | -1,059 | 2,040 | -3,100 | |
| Macao | 29 | 0 | 29 | 22 | * | * | |
| Malaysia | * | 187 | * | * | * | 864 | |
| Malta | 140 | 68 | 73 | 268 | 66 | 202 | |
| Marshall Islands | 1 | * | * | * | * | * | |
| Mauritius | * | 1 | * | * | 1 | * | |
| Mexico | 1,639 | 202 | 1,437 | 1,695 | 235 | 1,460 | |
| Montenegro | 11 | * | * | * | * | * | |
| Morocco | 97 | * | * | * | * | 54 | |
| Netherlands | 7,342 | 30,284 | -22,941 | 10,667 | 9,253 | 1,414 | |
| New Zealand | 262 | 56 | 207 | 490 | 52 | 438 | |
| Nigeria | * | 79 | * | * | 61 | * | |
| Norway | 2,696 | 522 | 2,174 | 2,894 | 590 | 2,305 | |
| Oman | 201 | 1 | 200 | 209 | 7 | 202 | |
| Pakistan | 103 | 13 | 90 | 179 | 9 | 171 | |
| Panama | 141 | * | * | 207 | * | * | |
| Peru | 23 | 8 | 15 | * | 7 | * | |
| Philippines | 51 | 355 | -304 | 199 | 438 | -239 | |
| Poland | 1,818 | 787 | 1,031 | 2,184 | 777 | 1,406 | |
| Portugal | 1,118 | 566 | 552 | 1,275 | 311 | 964 | |
| Qatar | 1,243 | 17 | 1,226 | 915 | 14 | 901 | |
| Romania | 250 | 253 | -3 | 467 | 252 | 214 | |
| Russian Federation | 2,713 | 515 | 2,198 | 3,242 | 360 | 2,882 | |
| Rwanda | * | * | * | 1 | 0 | 1 | |
| Saudi Arabia | 1,158 | 377 | 781 | 1,423 | 365 | 1,058 | |
| Serbia | * | * | 65 | * | * | 106 | |
| Singapore | 2,671 | 6,966 | -4,295 | 3,267 | 9,723 | -6,456 | |
| Slovakia | 84 | 143 | -59 | 85 | 85 | 0 | |
| Slovenia | 129 | 32 | 97 | 255 | 27 | 228 | |
| South Africa | 1,855 | 357 | 1,498 | 2,245 | 341 | 1,904 | |
| Spain | 4,631 | 2,809 | 1,822 | 4,089 | 1,714 | 2,375 | |
| Sri Lanka | 108 | 7 | 101 | 57 | 6 | 52 | |
| Sweden | 4,555 | 988 | 3,567 | 4,746 | 943 | 3,803 | |
| Switzerland | 5,553 | 7,319 | -1,766 | 6,837 | 5,902 | 935 | |
| Taiwan | 1,054 | 514 | 540 | 1,354 | 547 | 807 | |
| Thailand | 1,631 | 122 | 1,510 | 1,847 | 141 | 1,706 | |
| Trinidad and Tobago | 14 | 3 | 11 | 15 | 1 | 14 | |
| Tunisia | 39 | 5 | 34 | 41 | 10 | 30 | |
| Turkey | 1,387 | 255 | 1,132 | 1,501 | 204 | 1,297 | |
| Ukraine | 521 | 30 | 491 | 647 | 49 | 597 | |
| United Arab Emirates | * | 557 | * | * | 828 | * | |
| United Kingdom | 35,346 | 21,296 | 14,050 | 35,119 | 20,251 | 14,868 | |
| United States | 35,836 | 58,217 | -22,381 | 33,007 | 107,062 | -74,055 | |
| Uruguay | 12 | 4 | 9 | * | 3 | * | |
| Venezuela | 14 | 0 | 14 | * | * | 0 | |
| Viet Nam | 1,976 | 45 | 1,931 | 2,317 | 54 | 2,263 | |
| Virgin Islands, US | 0 | 0 | 0 | * | 0 | * | |
| International Organisations | 30 | * | * | 46 | * | * | |
| Not geographically allocated2 | 17,221 | * | * | 15,120 | * | * | |
| Marginal trade3 | 566 | 167 | 399 | 727 | 85 | 642 | |
| World total | 230,153 | 335,716 | -105,563 | 244,071 | 305,968 | -61,897 | |
| 1Revised | |||||||
| 2This category covers data supplied by respondents without a geographical breakdown. | |||||||
| 3Subtotal for countries for which exports and imports are less than €10m. | |||||||
| *Suppressed for confidentiality reasons but included in world total. | |||||||
The International Trade in Services provides, on an annual basis, greater analysis of the service components and significantly more geographical detail, including a cross-classification of service components according to counterpart country/region. The data are collected and compiled within the BOP framework and as such are designed to comply in so far as possible with the stipulated international methodological standards. They also conform closely with international presentation formats taking materiality and relevance into account as well as data confidentiality constraints. The results published in this release are generally compatible with the information supplied to and published by Eurostat and the European Central Bank (ECB) concerning the economic activities of EU and EMU residents with non-residents of these areas. The figures are also compatible with those supplied to other international organisations such as IMF and OECD.
For more detailed methodological information see International Trade in Services - Background Notes ( updated October 2017) (PDF 130KB)
 Hide Background Notes
Scan the QR code below to view this release online or go to
http://www.cso.ie/en/releasesandpublications/er/its/internationaltradeinservices2020/
 Show Table 1 Exports and Imports of Services by Category, 2019-2020
 Hide Table 1 Exports and Imports of Services by Category, 2019-2020