
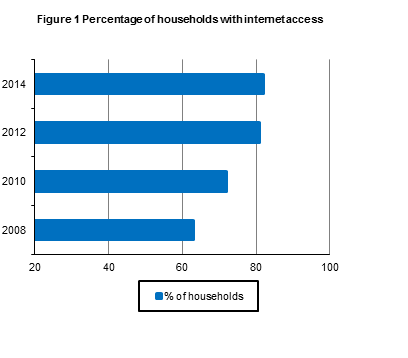
| Households with access to the internet | ||||||
| % of households | ||||||
| 2008 | 2009 | 2010 | 2011 | 2012 | 2013 | 2014 |
| 63 | 67 | 72 | 78 | 81 | 82 | 82 |
Summary of main findings:
______________________________________________________________________________________
Data for 2014 indicates that portable computers (including netbooks and tablets) were the most popular types of devices used to access the internet in the household (88% compared with 62% access using mobile phones or other mobile devices). See table 1b and figure 2
| Type of Device | % of households |
|---|---|
| Portable computer | 87.8 |
| Other mobile devices | 62.1 |
| Desktop computer | 23.4 |
| Games console | 10.3 |
| TV connected (Smart TV) | 9.1 |
In 2014, an estimated 80% of individuals used the internet in the 3 months prior to the interview. Of the 16-29 age category 86% accessed the internet every day, compared with just 26% of the 60-74 age category. 74% of individuals in the Dublin region accessed the internet every day, compared to 55% of individuals in the Border region. See tables 2a and 2b and figure 3.
| Used within last 3 months | Used but not in the last 3 months | Never used the internet | |
| 2012 | 76.9 | 5.1 | 17.9 |
| 2013 | 78.3 | 4.1 | 17.6 |
| 2014 | 79.7 | 4 | 16.3 |
The most popular activities of individuals who accessed the internet in the last three months were, Email (85%), Social networking (63%), Internet banking (60%) and Using services related to travel or travel related accommodation (54%). Of the 16-29 age category, 89% of individuals access the internet for social networking purposes compared with just 25% of the 60-74 age category. See table 3 and figure 4
| Internet Activity | Male | Female | Total |
|---|---|---|---|
| 83.6 | 85.4 | 84.5 | |
| Video / Voice calls over the internet | 36.2 | 35.5 | 35.9 |
| Social networking | 59.4 | 66.9 | 63.2 |
| Reading or downloading news | 48.4 | 43.6 | 45.9 |
| Services related to travel | 54.5 | 54.4 | 54.4 |
| Selling of goods or services | 17.7 | 10.7 | 14.1 |
| Internet banking | 60.7 | 60 | 60.3 |
Half of indviduals (50%) aged 16 - 74 indicated they purchased goods or services over the internet in the twelve months prior to the interview. The most popular types of internet purchases made by individuals were Other travel arrangements (31% of individuals), Tickets for events (30%), and Holiday accommodation (29%). See table 4 and figure 5.
| Online Purchases | % of individuals |
|---|---|
| Food and Groceries | 4.9 |
| Household goods | 13.1 |
| Clothes or sports goods | 27.7 |
| Electronic equipment | 14.6 |
| Share purchases | 8 |
| Films/music | 16.1 |
| Books magazines newspapers | 18.5 |
| Computer hardware | 3.9 |
| Telecommunication services | 9.9 |
| Holiday accommodation | 29 |
| Other travel arrangements | 30.7 |
| Tickets for events | 29.6 |
| Medicine | 1.6 |
| E learning material | 4.1 |
| Other | 7.6 |
Data for 2014 indicates that 35% of internet users use storage space on the internet to save files (documents, pictures, music, videos). 12% of individuals who indicated they used storage space on the internet also indicated they paid for such storage space. Just over 41% of internet users used social media as a method of sharing files electronically. See tables 5a, 5b, 5c and figure 6
| Age group | Age group |
|---|---|
| 16-29 | 41.9 |
| 30-44 | 38.9 |
| 45-59 | 27.1 |
| 60-74 | 14.9 |
| Table 1(a) Households with internet access, 2008 to 2014 | |||||||||||||||
| % of households | |||||||||||||||
| 2008 | 2009 | 2010 | 2011 | 2012 | 2013 | 2014 | |||||||||
| Unweighted | Unweighted | Unweighted | Unweighted | Unweighted | Unweighted | Unweighted | |||||||||
| Desktop/portable computer permanently in the home | % | actual sample | % | actual sample | % | actual sample | % | actual sample | % | actual sample | % | actual sample | % | actual sample | |
| State | 63 | 9,003 | 67 | 8,287 | 72 | 7,826 | 78 | 6,365 | 81 | 10,018 | 82 | 10,283 | 82 | 9,629 | |
| Household Composition | |||||||||||||||
| 1 adult, no dependent children | 32 | 1,469 | 35 | 1,456 | 42 | 1,478 | 51 | 1,169 | 55 | 1,714 | 55 | 1,810 | 56 | 1,731 | |
| 2 adults no dependent children | 54 | 2,468 | 59 | 2,246 | 66 | 2,139 | 72 | 1,727 | 74 | 2,771 | 78 | 2,686 | 76 | 2,879 | |
| 3 or more adults no dependent children | 75 | 1,646 | 80 | 1,481 | 85 | 1,214 | 88 | 1,033 | 90 | 1,576 | 92 | 1,534 | 94 | 1,624 | |
| 1 adult with dependent children | 51 | 335 | 52 | 339 | 61 | 404 | 76 | 336 | 78 | 500 | 82 | 532 | 86 | 404 | |
| 2 adults with dependent children | 79 | 2,169 | 82 | 1,977 | 87 | 1,945 | 93 | 1,592 | 95 | 2,551 | 95 | 2,775 | 96 | 2,205 | |
| 3 or more adults with dependent children | 79 | 916 | 86 | 788 | 90 | 646 | 95 | 508 | 96 | 906 | 95 | 946 | 95 | 786 | |
| Number of persons at work in the household | |||||||||||||||
| 0 | 31 | 1,937 | 36 | 2,058 | 44 | 2,211 | 56 | 1,906 | 58 | 2,960 | 61 | 3,036 | 61 | 2,823 | |
| 1 | 61 | 2,930 | 67 | 2,797 | 75 | 2,705 | 82 | 2,220 | 85 | 3,506 | 87 | 3,484 | 85 | 3,230 | |
| 2 | 78 | 3,207 | 84 | 2,734 | 89 | 2,427 | 93 | 1,871 | 96 | 2,984 | 95 | 3,158 | 96 | 2,984 | |
| 3+ | 81 | 929 | 88 | 698 | 93 | 483 | 97 | 368 | 98 | 568 | 98 | 605 | 98 | 592 | |
| Internet Type | |||||||||||||||
| Broadband | 100 | 3,656 | 100 | 4,423 | 100 | 4,757 | 100 | 4,116 | 100 | 6,686 | 100 | 7,072 | 100 | 7,602 | |
| Narrowband | 100 | 1,783 | 100 | 980 | 100 | 658 | 100 | 715 | 100 | 1,137 | 100 | 1,163 | 100 | 179 | |
| No internet | 0 | 3,429 | 0 | 2,776 | 0 | 2,256 | 0 | 1,421 | 0 | 1,967 | 0 | 1,840 | 0 | 1,727 | |
| Unknown internet | 100 | 135 | 100 | 108 | 100 | 155 | 100 | 113 | 100 | 228 | 100 | 208 | 13 | 121 | |
| Population | |||||||||||||||
| Densely populated | 70 | 2,687 | 74 | 2,856 | 77 | 2,352 | 83 | 2,174 | 85 | 3,056 | 86 | 3,301 | 87 | 3,417 | |
| Intermediate populated | 60 | 2,213 | 63 | 1,787 | 73 | 1,836 | 79 | 1,534 | 81 | 2,596 | 83 | 2,444 | 83 | 2,009 | |
| Thinly populated | 59 | 4,103 | 63 | 3,644 | 67 | 3,638 | 74 | 2,657 | 78 | 4,366 | 80 | 4,538 | 78 | 4,203 | |
| Region | |||||||||||||||
| Border | 53 | 1,037 | 56 | 952 | 60 | 874 | 66 | 602 | 75 | 1,205 | 75 | 1,154 | 75 | 1,090 | |
| Midlands | 54 | 603 | 63 | 422 | 66 | 448 | 79 | 321 | 74 | 593 | 82 | 626 | 80 | 622 | |
| West | 55 | 786 | 63 | 637 | 70 | 890 | 79 | 670 | 82 | 896 | 81 | 970 | 78 | 877 | |
| Dublin | 71 | 1,781 | 75 | 2,126 | 78 | 1,642 | 84 | 1,486 | 86 | 2,132 | 87 | 2,390 | 88 | 2,642 | |
| Mid-East | 72 | 831 | 71 | 822 | 81 | 843 | 87 | 545 | 87 | 776 | 86 | 1,062 | 86 | 1,008 | |
| Mid-West | 60 | 966 | 62 | 841 | 73 | 874 | 77 | 759 | 79 | 1,085 | 80 | 1,025 | 80 | 762 | |
| South-East | 59 | 1,285 | 64 | 955 | 65 | 1,087 | 71 | 902 | 79 | 1,424 | 81 | 1,301 | 79 | 1,069 | |
| South-West | 62 | 1,714 | 65 | 1,532 | 70 | 1,168 | 76 | 1,080 | 78 | 1,907 | 81 | 1,755 | 80 | 1,559 | |
| Note 1: Data are subject to sampling and other survey errors, which are relatively greater in respect of smaller values. | |||||||||||||||
| Note 2: Households represent all private households with at least one occupant aged 16-74. | |||||||||||||||
| Table 1(b) Households with internet access classified by type of device used to access the internet, 2014 | ||||||||||||||
| % of households | ||||||||||||||
| Desktop computer | Portable computer (laptop, netbook, tablet) | Other mobile devices (mobile phone,media or games player, e-book reader) | TV connected to the internet (Smart TV) | Games console | Unweighted sample | |||||||||
| State | 23 | 88 | 62 | 9 | 10 | 7,902 | ||||||||
| Household Composition | ||||||||||||||
| 1 adult, no dependent children | 16 | 82 | 52 | 5 | 3 | 971 | ||||||||
| 2 adults no dependent children | 24 | 87 | 51 | 7 | 6 | 2,195 | ||||||||
| 3 or more adults no dependent children | 27 | 90 | 65 | 10 | 12 | 1,519 | ||||||||
| 1 adult with dependent children | 10 | 79 | 70 | 8 | 14 | 348 | ||||||||
| 2 adults with dependent children | 23 | 90 | 72 | 11 | 13 | 2,120 | ||||||||
| 3 or more adults with dependent children | 35 | 89 | 70 | 13 | 20 | 749 | ||||||||
| Number of persons at work in the household | ||||||||||||||
| 0 | 19 | 80 | 43 | 4 | 5 | 1,708 | ||||||||
| 1 | 23 | 87 | 62 | 9 | 10 | 2,738 | ||||||||
| 2 | 26 | 92 | 72 | 12 | 13 | 2,874 | ||||||||
| 3+ | 28 | 93 | 73 | 13 | 15 | 582 | ||||||||
| Population | ||||||||||||||
| Densely populated | 23 | 90 | 67 | 14 | 14 | 2,970 | ||||||||
| Intermediate populated | 22 | 88 | 66 | 8 | 8 | 1,661 | ||||||||
| Thinly populated | 25 | 86 | 56 | 5 | 8 | 3,271 | ||||||||
| Region | ||||||||||||||
| Border | 23 | 87 | 65 | 8 | 10 | 820 | ||||||||
| Midlands | 23 | 90 | 67 | 9 | 11 | 497 | ||||||||
| West | 27 | 88 | 51 | 5 | 8 | 681 | ||||||||
| Dublin | 24 | 90 | 73 | 16 | 16 | 2,334 | ||||||||
| Mid-East | 24 | 87 | 72 | 10 | 12 | 862 | ||||||||
| Mid-West | 26 | 82 | 50 | 6 | 6 | 609 | ||||||||
| South-East | 22 | 86 | 54 | 3 | 7 | 846 | ||||||||
| South-West | 20 | 87 | 48 | 5 | 4 | 1,253 | ||||||||
| Note 1: Data are subject to sampling and other survey errors, which are relatively greater in respect of smaller values. | ||||||||||||||
| Note 2: Households represent all private households with at least one occupant aged 16-74. | ||||||||||||||
| Note 3: More than one type of device may be indicated by respondents. | ||||||||||||||
| Table 1(c ) Households without internet access classified by reasons for not having household internet access, 2014 | |||||||||||
| % of households without internet access | |||||||||||
| Access elsewhere | Do not need internet | Equipment costs too high | Access costs too high | Lack of skills | Privacy / security concerns | Not available in the area | Other | Unweighted sample | |||
| State | 11 | 42 | 13 | 12 | 39 | 3 | 4 | 9 | 1,715 | ||
| Household Composition | |||||||||||
| 1 adult, no dependent children | 11 | 44 | 10 | 9 | 40 | 3 | 2 | 9 | 758 | ||
| 2 adults no dependent children | 7 | 47 | 9 | 9 | 45 | 3 | 4 | 8 | 681 | ||
| 3 or more adults no dependent children | 15 | 42 | 22 | 23 | 28 | 1 | 2 | 11 | 100 | ||
| 1 adult with dependent children | 37 | 15 | 29 | 26 | 20 | . | 2 | 11 | 55 | ||
| 2 adults with dependent children | 23 | 13 | 37 | 34 | 17 | 5 | 15 | 5 | 84 | ||
| 3 or more adults with dependent children | [11] | [24] | [43] | [32] | [24] | [3] | [11] | [11] | 37 | ||
| Number of persons at work in the household | |||||||||||
| 0 | 7 | 46 | 13 | 13 | 43 | 4 | 2 | 9 | 1,114 | ||
| 1 | 17 | 38 | 14 | 12 | 35 | 2 | 5 | 8 | 483 | ||
| 2 | 25 | 30 | 12 | 6 | 23 | . | 14 | 9 | 108 | ||
| 3+ | * | * | * | * | * | * | * | * | 10 | ||
| Population | |||||||||||
| Densely populated | 16 | 38 | 17 | 17 | 34 | 3 | 0 | 10 | 443 | ||
| Intermediate populated | 10 | 41 | 14 | 14 | 44 | 4 | 1 | 8 | 346 | ||
| Thinly populated | 9 | 45 | 10 | 9 | 40 | 2 | 6 | 8 | 926 | ||
| Region | |||||||||||
| Border | 9 | 46 | 15 | 18 | 45 | 2 | 2 | 14 | 267 | ||
| Midlands | 5 | 44 | 4 | 5 | 32 | 1 | 10 | 7 | 125 | ||
| West | 10 | 60 | 15 | 11 | 37 | 2 | 6 | 3 | 194 | ||
| Dublin | 18 | 41 | 17 | 17 | 29 | 1 | 0 | 10 | 304 | ||
| Mid-East | 11 | 45 | 12 | 9 | 34 | 2 | 6 | 6 | 146 | ||
| Mid-West | 7 | 40 | 9 | 9 | 39 | 1 | 3 | 7 | 153 | ||
| South-East | 14 | 35 | 12 | 9 | 45 | 3 | 1 | 5 | 221 | ||
| South-West | 8 | 32 | 12 | 12 | 48 | 9 | 4 | 13 | 305 | ||
| Note 1: More than one reason may have been given by respondents. | |||||||||||
| Note 2: Households represent all private households with at least one occupant aged 16-74. | |||||||||||
| Note 3: * Sample occurrence too small for estimation. | |||||||||||
| Note 4: Figures in parentheses [ ] indicate percentages based on small numbers, and are, therefore, subject to a wide margin of error. | |||||||||||
| Table 2 (a ) Individuals' use of the internet classified by frequency of use, 2009 to 2014 | |||||||||||||||||||||||
| % of individuals | |||||||||||||||||||||||
| Used within last 3 months | Used but not in the last 3 months | Never used the internet | |||||||||||||||||||||
| 2009 | 2010 | 2011 | 2012 | 2013 | 2014 | 2009 | 2010 | 2011 | 2012 | 2013 | 2014 | 2008 | 2009 | 2010 | 2011 | 2012 | 2013 | 2014 | |||||
| State | 65 | 67 | 75 | 77 | 78 | 80 | 5 | 5 | 4 | 5 | 4 | 4 | 32 | 30 | 27 | 21 | 18 | 18 | 16 | ||||
| Sex | |||||||||||||||||||||||
| Male | 64 | 66 | 73 | 77 | 78 | 78 | 4 | 5 | 3 | 5 | 4 | 4 | 34 | 32 | 29 | 23 | 18 | 18 | 18 | ||||
| Female | 66 | 69 | 76 | 77 | 79 | 81 | 5 | 5 | 4 | 5 | 4 | 4 | 30 | 29 | 26 | 19 | 18 | 17 | 15 | ||||
| Age Group | |||||||||||||||||||||||
| 16-29 | 85 | 87 | 93 | 92 | 93 | 96 | 5 | 4 | 4 | 4 | 3 | 2 | 14 | 10 | 9 | 3 | 3 | 5 | 2 | ||||
| 30-44 | 74 | 79 | 87 | 89 | 90 | 92 | 5 | 6 | 3 | 4 | 4 | 3 | 22 | 21 | 15 | 10 | 7 | 6 | 5 | ||||
| 45-59 | 53 | 56 | 65 | 70 | 76 | 74 | 5 | 6 | 4 | 6 | 5 | 6 | 44 | 42 | 39 | 31 | 24 | 19 | 20 | ||||
| 60-74 | 25 | 27 | 38 | 40 | 46 | 43 | 3 | 5 | 5 | 7 | 5 | 6 | 72 | 72 | 67 | 58 | 53 | 49 | 51 | ||||
| Principal Economic Status | |||||||||||||||||||||||
| At work | 75 | 77 | 84 | 88 | 88 | 88 | 4 | 5 | 3 | 3 | 3 | 3 | 23 | 21 | 19 | 14 | 9 | 9 | 10 | ||||
| Unemployed | 60 | 63 | 74 | 73 | 76 | 76 | 8 | 8 | 5 | 8 | 6 | 8 | 46 | 32 | 30 | 21 | 19 | 18 | 16 | ||||
| Student | 95 | 97 | 97 | 94 | 98 | 99 | 3 | 1 | 1 | 3 | 1 | 1 | 7 | 2 | 2 | 1 | 4 | 2 | 0 | ||||
| Home duties | 41 | 47 | 57 | 63 | 66 | 64 | 7 | 7 | 6 | 8 | 5 | 7 | 49 | 52 | 46 | 37 | 30 | 29 | 29 | ||||
| Retired | 30 | 35 | 43 | 50 | 49 | 52 | 4 | 7 | 6 | 7 | 7 | 6 | 63 | 65 | 58 | 51 | 43 | 44 | 42 | ||||
| Other | 33 | 33 | 51 | 50 | 51 | 50 | 6 | 9 | 7 | 8 | 8 | 9 | 60 | 62 | 59 | 43 | 42 | 41 | 41 | ||||
| Region | |||||||||||||||||||||||
| Border | 48 | 56 | 64 | 72 | 70 | 73 | 8 | 9 | 7 | 6 | 6 | 5 | 39 | 44 | 36 | 28 | 22 | 24 | 22 | ||||
| Midland | 61 | 60 | 74 | 69 | 76 | 77 | 2 | 4 | 2 | 5 | 5 | 3 | 36 | 37 | 35 | 25 | 27 | 19 | 19 | ||||
| West | 59 | 69 | 74 | 75 | 75 | 75 | 6 | 4 | 3 | 5 | 4 | 5 | 39 | 35 | 27 | 23 | 20 | 21 | 20 | ||||
| Dublin | 76 | 75 | 81 | 82 | 85 | 87 | 4 | 5 | 4 | 6 | 4 | 3 | 23 | 20 | 20 | 15 | 13 | 11 | 10 | ||||
| Mid-East | 70 | 73 | 81 | 84 | 80 | 83 | 4 | 3 | 2 | 3 | 3 | 2 | 30 | 27 | 24 | 17 | 13 | 17 | 15 | ||||
| Mid-West | 63 | 65 | 72 | 74 | 76 | 79 | 7 | 8 | 3 | 6 | 4 | 5 | 34 | 30 | 27 | 25 | 20 | 21 | 16 | ||||
| South-East | 58 | 61 | 69 | 73 | 75 | 75 | 5 | 7 | 4 | 5 | 4 | 6 | 39 | 37 | 32 | 28 | 22 | 22 | 20 | ||||
| South-West | 63 | 66 | 73 | 75 | 78 | 76 | 4 | 4 | 4 | 6 | 4 | 5 | 33 | 33 | 30 | 23 | 20 | 19 | 20 | ||||
| 'Type of Internet connection | |||||||||||||||||||||||
| broadband | 87 | 86 | 89 | 90 | 91 | 91 | 2 | 3 | 2 | 3 | 2 | 3 | 10 | 11 | 11 | 9 | 8 | 7 | 7 | ||||
| narrowband | 74 | 78 | 85 | 85 | 86 | 85 | 5 | 5 | 4 | 5 | 4 | 6 | 20 | 21 | 16 | 12 | 11 | 10 | 10 | ||||
| No internet | 22 | 20 | 20 | 18 | 19 | 19 | 9 | 11 | 11 | 16 | 13 | 11 | 67 | 69 | 69 | 69 | 67 | 69 | 70 | ||||
| Unknown internet | 26 | 39 | 39 | 51 | 40 | 45 | 6 | 4 | 2 | 6 | 7 | 7 | 49 | 68 | 57 | 58 | 44 | 53 | 49 | ||||
| Household Composition | |||||||||||||||||||||||
| 1 adult, no dependent children | 50 | 51 | 59 | 62 | 60 | 65 | 4 | 8 | 5 | 6 | 7 | 6 | 48 | 46 | 41 | 36 | 32 | 34 | 29 | ||||
| 2 adults no dependent children | 60 | 62 | 68 | 70 | 74 | 74 | 4 | 5 | 4 | 5 | 3 | 4 | 38 | 36 | 34 | 28 | 25 | 24 | 22 | ||||
| 3 or more adults no dependent children | 67 | 71 | 77 | 78 | 79 | 80 | 4 | 3 | 2 | 4 | 4 | 4 | 27 | 28 | 26 | 21 | 18 | 17 | 16 | ||||
| 1 adult with dependent children | 66 | 69 | 81 | 81 | 84 | 89 | 6 | 9 | 11 | 12 | 8 | 5 | 31 | 28 | 22 | 8 | 7 | 8 | 6 | ||||
| 2 adults with dependent children | 75 | 79 | 87 | 89 | 90 | 92 | 6 | 5 | 3 | 4 | 4 | 3 | 22 | 19 | 16 | 10 | 7 | 6 | 5 | ||||
| 3 or more adults with dependent children | 71 | 75 | 80 | 83 | 82 | 85 | 5 | 5 | 3 | 5 | 5 | 3 | 28 | 25 | 21 | 17 | 13 | 13 | 12 | ||||
| Number of persons at work in the household | |||||||||||||||||||||||
| 0 | 39 | 46 | 57 | 56 | 58 | 62 | 6 | 7 | 6 | 8 | 7 | 6 | 60 | 54 | 47 | 36 | 36 | 35 | 32 | ||||
| 1 | 64 | 70 | 75 | 79 | 81 | 81 | 5 | 6 | 4 | 5 | 4 | 4 | 34 | 31 | 25 | 21 | 16 | 15 | 15 | ||||
| 2 | 78 | 80 | 87 | 89 | 90 | 91 | 4 | 4 | 2 | 3 | 3 | 2 | 21 | 19 | 16 | 10 | 8 | 8 | 7 | ||||
| 3+ | 77 | 79 | 87 | 88 | 88 | 87 | 4 | 3 | 2 | 3 | 2 | 3 | 22 | 18 | 18 | 11 | 9 | 10 | 11 | ||||
| Note 1: Data are subject to sampling and other survey errors, which are relatively greater in respect of smaller values. | |||||||||||||||||||||||
| Note 2: Individuals represent all individuals aged 16-74. | |||||||||||||||||||||||
| Table 2(b) Individuals who recently used the internet (in the last 3 months) classified by detailed frequency of use, 2011 to 2014 | |||||||||||||||||||||
| % of individuals | |||||||||||||||||||||
| At least once a week | At least once a month | Didn't use in | |||||||||||||||||||
| Every day | (but not every day) | (but not every week) | last 3 months | ||||||||||||||||||
| 2011 | 2012 | 2013 | 2014 | 2011 | 2012 | 2013 | 2014 | 2011 | 2012 | 2013 | 2014 | 2011 | 2012 | 2013 | 2014 | ||||||
| State | 55 | 58 | 61 | 65 | 16 | 15 | 14 | 12 | 3 | 3 | 3 | 3 | 25 | 23 | 22 | 21 | |||||
| Sex | |||||||||||||||||||||
| Male | 55 | 59 | 61 | 64 | 15 | 14 | 13 | 12 | 2 | 2 | 4 | 3 | 27 | 23 | 22 | 21 | |||||
| Female | 55 | 57 | 62 | 66 | 18 | 17 | 14 | 12 | 3 | 3 | 3 | 4 | 24 | 23 | 21 | 19 | |||||
| Age Group | |||||||||||||||||||||
| 16-29 | 77 | 78 | 79 | 86 | 14 | 12 | 12 | 7 | 1 | 2 | 2 | 2 | 7 | 8 | 8 | 4 | |||||
| 30-44 | 64 | 70 | 74 | 77 | 19 | 16 | 14 | 12 | 3 | 2 | 3 | 3 | 13 | 11 | 10 | 8 | |||||
| 45-59 | 43 | 48 | 57 | 54 | 17 | 19 | 14 | 15 | 4 | 3 | 5 | 5 | 35 | 30 | 24 | 26 | |||||
| 60-74 | 21 | 21 | 28 | 26 | 13 | 15 | 14 | 12 | 2 | 3 | 4 | 4 | 62 | 60 | 54 | 57 | |||||
| Principal Economic Status | |||||||||||||||||||||
| At work | 65 | 70 | 72 | 74 | 16 | 15 | 13 | 11 | 3 | 2 | 3 | 3 | 16 | 13 | 12 | 12 | |||||
| Unemployed | 49 | 51 | 56 | 56 | 20 | 18 | 16 | 16 | 4 | 3 | 4 | 5 | 26 | 27 | 24 | 24 | |||||
| Student | 92 | 86 | 91 | 94 | 5 | 8 | 6 | 4 | 0 | 0 | 1 | 1 | 3 | 7 | 2 | 1 | |||||
| Home duties | 30 | 40 | 46 | 45 | 22 | 18 | 17 | 15 | 4 | 3 | 3 | 5 | 43 | 37 | 34 | 36 | |||||
| Retired | 25 | 29 | 29 | 34 | 16 | 17 | 16 | 15 | 2 | 4 | 4 | 4 | 57 | 50 | 51 | 48 | |||||
| Other | 30 | 32 | 33 | 31 | 16 | 13 | 13 | 13 | 3 | 4 | 5 | 7 | 49 | 50 | 49 | 50 | |||||
| Region | |||||||||||||||||||||
| Border | 40 | 50 | 51 | 55 | 21 | 19 | 15 | 13 | 3 | 3 | 5 | 6 | 36 | 28 | 30 | 27 | |||||
| Midland | 54 | 53 | 60 | 64 | 14 | 11 | 13 | 10 | 3 | 4 | 3 | 4 | 26 | 32 | 24 | 23 | |||||
| West | 54 | 56 | 57 | 60 | 15 | 16 | 14 | 13 | 3 | 2 | 4 | 2 | 26 | 26 | 25 | 25 | |||||
| Dublin | 66 | 67 | 71 | 74 | 13 | 12 | 12 | 10 | 3 | 2 | 2 | 3 | 19 | 18 | 15 | 13 | |||||
| Mid-East | 57 | 63 | 63 | 65 | 21 | 18 | 14 | 14 | 2 | 2 | 3 | 4 | 19 | 16 | 20 | 17 | |||||
| Mid-West | 54 | 56 | 58 | 61 | 14 | 15 | 13 | 13 | 4 | 3 | 4 | 5 | 28 | 26 | 24 | 21 | |||||
| South-East | 46 | 51 | 54 | 61 | 18 | 18 | 16 | 11 | 4 | 4 | 5 | 3 | 31 | 27 | 26 | 25 | |||||
| South-West | 54 | 55 | 61 | 62 | 17 | 16 | 14 | 11 | 2 | 3 | 3 | 3 | 27 | 25 | 22 | 24 | |||||
| Type of Internet connection | |||||||||||||||||||||
| Broadband | 68 | 70 | 73 | 75 | 18 | 17 | 15 | 13 | 3 | 2 | 3 | 3 | 11 | 10 | 9 | 9 | |||||
| Narrowband | 62 | 62 | 63 | 67 | 19 | 18 | 18 | 16 | 3 | 4 | 6 | 2 | 15 | 15 | 14 | 15 | |||||
| No internet | 7 | 7 | 10 | 9 | 8 | 7 | 6 | 6 | 3 | 3 | 3 | 5 | 80 | 83 | 81 | 81 | |||||
| Unknown internet | 18 | 28 | 22 | 26 | 16 | 17 | 14 | 14 | 3 | 5 | 4 | 5 | 61 | 50 | 60 | 55 | |||||
| Household composition | |||||||||||||||||||||
| 1 adult, no dependent children | 42 | 44 | 44 | 50 | 14 | 16 | 12 | 11 | 2 | 2 | 4 | 4 | 41 | 38 | 40 | 35 | |||||
| 2 adults no dependent children | 51 | 53 | 58 | 59 | 13 | 14 | 12 | 12 | 3 | 3 | 4 | 3 | 32 | 30 | 26 | 26 | |||||
| 3 or more adults no dependent children | 60 | 62 | 64 | 69 | 14 | 13 | 12 | 8 | 3 | 3 | 4 | 3 | 23 | 22 | 21 | 20 | |||||
| 1 adult with dependent children | 54 | 57 | 62 | 74 | 21 | 19 | 18 | 13 | 5 | 3 | 4 | 5 | 19 | 20 | 16 | 11 | |||||
| 2 adults with dependent children | 62 | 68 | 72 | 74 | 21 | 18 | 16 | 14 | 3 | 3 | 3 | 3 | 13 | 11 | 10 | 8 | |||||
| 3 or more adults with dependent children | 60 | 63 | 64 | 70 | 17 | 17 | 15 | 12 | 3 | 2 | 4 | 4 | 20 | 18 | 18 | 15 | |||||
| Number of persons at work in the household | |||||||||||||||||||||
| 0 | 38 | 37 | 39 | 44 | 16 | 16 | 15 | 13 | 3 | 3 | 4 | 5 | 43 | 44 | 42 | 38 | |||||
| 1 | 53 | 59 | 63 | 65 | 18 | 17 | 15 | 13 | 3 | 3 | 3 | 3 | 25 | 21 | 19 | 19 | |||||
| 2 | 68 | 72 | 75 | 79 | 16 | 15 | 11 | 10 | 3 | 2 | 3 | 2 | 13 | 11 | 10 | 9 | |||||
| 3+ | 73 | 74 | 73 | 75 | 12 | 12 | 12 | 9 | 2 | 3 | 3 | 3 | 13 | 12 | 12 | 13 | |||||
| Note 1: Data are subject to sampling and other survey errors, which are relatively greater in respect of smaller values. | |||||||||||||||||||||
| Note 2: Individuals represent all individuals aged 16-74. | |||||||||||||||||||||
| Table 3 Individuals who recently used the internet (in the last 3 months) classified by types of internet activity, 2014 | |||||||||||||||
| % of individuals | |||||||||||||||
| Video / Voice calls over the internet | Social networking | Reading or downloading news | Services related to travel | Selling of goods or services | Internet banking | Unweighted Sample | |||||||||
| State | 85 | 36 | 63 | 46 | 54 | 14 | 60 | 7,075 | |||||||
| Sex | |||||||||||||||
| Male | 84 | 36 | 59 | 48 | 55 | 18 | 61 | 2,789 | |||||||
| Female | 85 | 36 | 67 | 44 | 54 | 11 | 60 | 4,286 | |||||||
| Age Group | |||||||||||||||
| 16-29 | 84 | 40 | 89 | 43 | 48 | 13 | 52 | 1,057 | |||||||
| 30-44 | 88 | 40 | 68 | 51 | 59 | 17 | 71 | 2,858 | |||||||
| 45-59 | 82 | 28 | 41 | 43 | 56 | 14 | 58 | 2,155 | |||||||
| 60-74 | 80 | 28 | 25 | 40 | 51 | 7 | 48 | 1,005 | |||||||
| Principal Economic Status | |||||||||||||||
| At work | 88 | 40 | 62 | 51 | 63 | 17 | 72 | 4,188 | |||||||
| Unemployed | 72 | 25 | 65 | 37 | 35 | 10 | 38 | 632 | |||||||
| Student | 87 | 41 | 92 | 43 | 43 | 12 | 43 | 424 | |||||||
| Home duties | 76 | 27 | 60 | 35 | 46 | 10 | 49 | 985 | |||||||
| Retired | 83 | 29 | 24 | 43 | 58 | 7 | 53 | 608 | |||||||
| Other | 74 | 26 | 50 | 33 | 32 | 9 | 42 | 238 | |||||||
| Region | |||||||||||||||
| Border | 79 | 25 | 64 | 38 | 42 | 10 | 51 | 688 | |||||||
| Midland | 75 | 30 | 64 | 39 | 44 | 15 | 59 | 442 | |||||||
| West | 88 | 35 | 64 | 43 | 56 | 12 | 57 | 590 | |||||||
| Dublin | 91 | 47 | 62 | 60 | 64 | 17 | 68 | 2,200 | |||||||
| Mid-East | 79 | 31 | 64 | 40 | 49 | 11 | 58 | 788 | |||||||
| Mid-West | 83 | 33 | 64 | 46 | 54 | 18 | 55 | 536 | |||||||
| South-East | 82 | 29 | 63 | 31 | 50 | 13 | 57 | 738 | |||||||
| South-West | 84 | 33 | 63 | 41 | 55 | 14 | 60 | 1,093 | |||||||
| Type of Internet connection | |||||||||||||||
| broadband | 86 | 37 | 64 | 47 | 56 | 15 | 62 | 6,659 | |||||||
| narrowband | 82 | 39 | 60 | 47 | 50 | 14 | 62 | 147 | |||||||
| No internet | 55 | 8 | 42 | 22 | 29 | 3 | 29 | 221 | |||||||
| Unknown internet | 70 | 31 | 39 | 30 | 25 | 8 | 38 | 48 | |||||||
| Household Composition | |||||||||||||||
| 1 adult, no dependent children | 84 | 31 | 55 | 47 | 52 | 11 | 59 | 1,003 | |||||||
| 2 adults no dependent children | 86 | 39 | 61 | 50 | 61 | 14 | 63 | 1,900 | |||||||
| 3 or more adults no dependent children | 84 | 37 | 69 | 46 | 53 | 12 | 54 | 1,158 | |||||||
| 1 adult with dependent children | 74 | 29 | 80 | 37 | 42 | 12 | 55 | 358 | |||||||
| 2 adults with dependent children | 86 | 37 | 63 | 45 | 57 | 18 | 68 | 2,024 | |||||||
| 3 or more adults with dependent children | 82 | 31 | 63 | 42 | 44 | 14 | 47 | 632 | |||||||
| Number of persons at work in the household | |||||||||||||||
| 0 | 75 | 28 | 61 | 40 | 41 | 9 | 41 | 1,480 | |||||||
| 1 | 85 | 35 | 62 | 45 | 54 | 13 | 59 | 2,452 | |||||||
| 2 | 89 | 39 | 66 | 50 | 62 | 18 | 71 | 2656 | |||||||
| 3+ | 87 | 42 | 65 | 53 | 56 | 16 | 64 | 487 | |||||||
| Note 1: Data are subject to sampling and other survey errors, which are relatively greater in respect of smaller values. | |||||||||||||||
| Note 2: Individuals represent all individuals aged 16-74. | |||||||||||||||
| Note 3: More than type of activity may be given by respondents | |||||||||||||||
| Table 4 Individuals classified by types of purchases made online during the last 12 months, 2014 | |||||||||
| % of individuals | |||||||||
| Food and Groceries | Household goods | Clothes or sports goods | Electronic equipment | Share purchases/financial services / insurance | Films/music | Books magazines newspapers e-learning material | Computer hardware | ||
| State | 5 | 13 | 28 | 15 | 8 | 16 | 19 | 4 | |
| Sex | |||||||||
| Male | 4 | 12 | 23 | 19 | 9 | 17 | 18 | 6 | |
| Female | 5 | 15 | 33 | 11 | 7 | 15 | 19 | 2 | |
| Age Group | |||||||||
| 16-29 | 5 | 10 | 38 | 19 | 5 | 22 | 18 | 4 | |
| 30-44 | 9 | 22 | 37 | 20 | 13 | 22 | 25 | 6 | |
| 45-59 | 3 | 10 | 21 | 11 | 7 | 12 | 17 | 3 | |
| 60-74 | 1 | 4 | 5 | 4 | 3 | 3 | 8 | 1 | |
| Principal Economic Status | |||||||||
| At work | 7 | 18 | 35 | 19 | 12 | 21 | 24 | 5 | |
| Unemployed | 2 | 8 | 17 | 9 | 3 | 9 | 10 | 3 | |
| Student | 5 | 6 | 36 | 19 | 3 | 21 | 20 | 6 | |
| Home duties | 5 | 14 | 21 | 6 | 4 | 9 | 12 | 1 | |
| Retired | 1 | 6 | 7 | 5 | 5 | 4 | 12 | 2 | |
| Other | 2 | 5 | 11 | 8 | 4 | 7 | 7 | 0 | |
| Region | |||||||||
| Border | 3 | 10 | 19 | 11 | 4 | 11 | 11 | 3 | |
| Midland | 4 | 13 | 34 | 13 | 9 | 19 | 15 | 2 | |
| West | 3 | 12 | 24 | 11 | 8 | 13 | 16 | 3 | |
| Dublin | 8 | 17 | 33 | 21 | 13 | 24 | 27 | 6 | |
| Mid-East | 5 | 16 | 26 | 13 | 7 | 14 | 17 | 5 | |
| Mid-West | 5 | 10 | 28 | 12 | 3 | 17 | 16 | 3 | |
| South-East | 2 | 10 | 26 | 12 | 7 | 10 | 15 | 2 | |
| South-West | 4 | 10 | 25 | 13 | 6 | 12 | 15 | 3 | |
| Type of Internet connection | |||||||||
| broadband | 6 | 15 | 32 | 17 | 9 | 19 | 22 | 5 | |
| narrowband | 7 | 14 | 29 | 17 | 9 | 14 | 19 | 4 | |
| No internet | 0 | 1 | 1.6 | 0.2 | 0 | 1 | 1 | 0 | |
| Unknown internet | 4 | 4 | 8 | 2 | 3 | 5 | 6 | 0 | |
| Household Composition | |||||||||
| 1 adult, no dependent children | 2 | 7 | 16 | 9 | 6 | 13 | 16 | 3 | |
| 2 adults no dependent children | 4 | 10 | 25 | 15 | 8 | 17 | 19 | 4 | |
| 3 or more adults no dependent children | 4 | 6 | 27 | 16 | 5 | 15 | 17 | 4 | |
| 1 adult with dependent children | 6 | 17 | 32 | 7 | 5 | 11 | 14 | 2 | |
| 2 adults with dependent children | 9 | 27 | 38 | 19 | 12 | 20 | 23 | 5 | |
| 3 or more adults with dependent children | 5 | 11 | 29 | 12 | 8 | 13 | 16 | 3 | |
| Number of persons at work in the household | |||||||||
| 0 | 2 | 6 | 13 | 7 | 3 | 8 | 10 | 2 | |
| 1 | 5 | 13 | 28 | 14 | 7 | 17 | 19 | 4 | |
| 2 | 7 | 20 | 37 | 20 | 13 | 22 | 24 | 6 | |
| 3+ | 5 | 10 | 35 | 18 | 8 | 17 | 21 | 3 | |
| Table 4 contd. Individuals classified by types of purchases made online during the last 12 months, 2014 | |||||||||
| % of individuals | |||||||||
| Telecommunication services | Holiday accommodation | Other travel arrangements | Tickets for events | Medicine | E learning material | Other | |||
| State | 10 | 29 | 31 | 30 | 2 | 4 | 8 | ||
| Sex | |||||||||
| Male | 11 | 28 | 31 | 29 | 2 | 5 | 8 | ||
| Female | 9 | 30 | 31 | 31 | 2 | 4 | 7 | ||
| Age Group | |||||||||
| 16-29 | 12 | 27 | 30 | 37 | 2 | 5 | 11 | ||
| 30-44 | 14 | 40 | 42 | 38 | 2 | 6 | 9 | ||
| 45-59 | 8 | 28 | 29 | 26 | 1 | 3 | 7 | ||
| 60-74 | 2 | 13 | 12 | 9 | 1 | 0 | 3 | ||
| Principal Economic Status | |||||||||
| At work | 13 | 41 | 42 | 40 | 2 | 6 | 9 | ||
| Unemployed | 6 | 15 | 17 | 15 | 1 | 2 | 6 | ||
| Student | 13 | 21 | 24 | 34 | 2 | 6 | 14 | ||
| Home duties | 5 | 17 | 18 | 17 | 1 | 2 | 4 | ||
| Retired | 4 | 18 | 18 | 14 | 1 | 1 | 3 | ||
| Other | 2 | 7 | 10 | 7 | 1 | 1 | 4 | ||
| Region | |||||||||
| Border | 9 | 19 | 20 | 20 | 1 | 3 | 13 | ||
| Midland | 11 | 26 | 27 | 27 | 2 | 3 | 9 | ||
| West | 10 | 23 | 24 | 26 | 2 | 3 | 7 | ||
| Dublin | 14 | 43 | 47 | 40 | 3 | 6 | 9 | ||
| Mid-East | 9 | 26 | 29 | 30 | 1 | 3 | 4 | ||
| Mid-West | 9 | 27 | 25 | 26 | 1 | 2 | 7 | ||
| South-East | 7 | 22 | 22 | 25 | 1 | 3 | 4 | ||
| South-West | 6 | 25 | 25 | 25 | 1 | 5 | 7 | ||
| Type of Internet connection | |||||||||
| broadband | 12 | 34 | 36 | 35 | 2 | 5 | 9 | ||
| narrowband | 12 | 29 | 32 | 28 | 1 | 3 | 8 | ||
| No internet | 0.1 | 1.7 | 1.3 | 5.4 | 0 | 0 | 1 | ||
| Unknown internet | 2 | 5 | 7 | 2 | 0 | 1 | 1 | ||
| Household Composition | |||||||||
| 1 adult, no dependent children | 8 | 22 | 23 | 21 | 1 | 3 | 7 | ||
| 2 adults no dependent children | 10 | 31 | 32 | 30 | 2 | 4 | 7 | ||
| 3 or more adults no dependent children | 10 | 26 | 27 | 30 | 2 | 4 | 9 | ||
| 1 adult with dependent children | 7 | 17 | 20 | 23 | 0 | 4 | 7 | ||
| 2 adults with dependent children | 21 | 39 | 40 | 37 | 2 | 5 | 8 | ||
| 3 or more adults with dependent children | 9 | 23 | 28 | 29 | 1 | 3 | 8 | ||
| Number of persons at work in the household | |||||||||
| 0 | 4 | 12 | 14 | 13 | 1 | 2 | 5 | ||
| 1 | 10 | 29 | 31 | 29 | 1 | 4 | 6 | ||
| 2 | 14 | 42 | 43 | 41 | 2 | 5 | 11 | ||
| 3+ | 11 | 35 | 36 | 38 | 1 | 4 | 9 | ||
| Note 1: Data are subject to sampling and other survey errors, which are relatively greater in respect of smaller values. | |||||||||
| Note 2: Individuals represent all individuals aged 16-74. | |||||||||
| Note 3: More than one type of purchase may be given by respondents | |||||||||
| Table 5 (a) Individuals who recently used the internet (in the last 3 months) classified by whether | ||||||
| or not they have used the internet to store files, 2014 | ||||||
| % of individuals | ||||||
| Yes | No | Unweighted Sample | ||||
| State | 35 | 65 | 7,075 | |||
| Sex | ||||||
| Male | 37 | 63 | 2,789 | |||
| Female | 32 | 68 | 4,286 | |||
| Age Group | ||||||
| 16-29 | 42 | 58 | 1,057 | |||
| 30-44 | 39 | 61 | 2,858 | |||
| 45-59 | 27 | 73 | 2,155 | |||
| 60-74 | 15 | 85 | 1,005 | |||
| Principal Economic Status | ||||||
| At work | 39 | 61 | 4,188 | |||
| Unemployed | 27 | 74 | 632 | |||
| Student | 46 | 54 | 424 | |||
| Home duties | 20 | 80 | 985 | |||
| Retired | 16 | 84 | 608 | |||
| Other | 20 | 80 | 238 | |||
| Region | ||||||
| Border | 23 | 77 | 688 | |||
| Midland | 29 | 71 | 442 | |||
| West | 32 | 68 | 590 | |||
| Dublin | 43 | 57 | 2,200 | |||
| Mid-East | 30 | 70 | 788 | |||
| Mid-West | 31 | 69 | 536 | |||
| South-East | 35 | 65 | 738 | |||
| South-West | 34 | 66 | 1,093 | |||
| 'Type of Internet connection | ||||||
| broadband | 36 | 64 | 6,659 | |||
| narrowband | 31 | 69 | 147 | |||
| No internet | 8.3 | 91.7 | 221 | |||
| Unknown internet | 16 | 84 | 48 | |||
| Household Composition | ||||||
| 1 adult, no dependent children | 29 | 72 | 1,003 | |||
| 2 adults no dependent children | 37 | 63 | 1900 | |||
| 3 or more adults no dependent children | 40 | 60 | 1,158 | |||
| 1 adult with dependent children | 28 | 72 | 358 | |||
| 2 adults with dependent children | 36 | 65 | 2,024 | |||
| 3 or more adults with dependent children | 29 | 72 | 631 | |||
| Number of persons at work in the household | ||||||
| 0 | 26 | 75 | 1,480 | |||
| 1 | 33 | 67 | 2452 | |||
| 2 | 40 | 60 | 2,656 | |||
| 3+ | 41 | 59 | 487 | |||
| Note 1: Data are subject to sampling and other survey errors, which are relatively greater in respect of smaller values. | ||||||
| Note 2: Individuals represent all individuals aged 16-74. | ||||||
| Note 3: Files includes documents, pictures,music, video or other files | ||||||
| Table 5(b) Individuals who used storage space on the internet classified by whether or not they paid for | ||||||
| storage space | ||||||
| % of individuals | ||||||
| Yes | No | Not stated | Unweighted Sample | |||
| State | 12 | 84 | 4 | 2,263 | ||
| Sex | ||||||
| Male | 14 | 83 | 3 | 988 | ||
| Female | 10 | 86 | 4 | 1,275 | ||
| Age Group | ||||||
| 16-29 | 10 | 88 | 3 | 475 | ||
| 30-44 | 13 | 83 | 4 | 1,080 | ||
| 45-59 | 15 | 81 | 4 | 564 | ||
| 60-74 | 14 | 83 | 4 | 144 | ||
| Principal Economic Status | ||||||
| At work | 13 | 84 | 3 | 1,539 | ||
| Unemployed | 10 | 83 | 7 | 166 | ||
| Student | 9 | 89 | 3 | 225 | ||
| Home duties | 13 | 84 | 3 | 191 | ||
| Retired | 15 | 84 | 3 | 98 | ||
| Other | [12] | [79] | [10] | 44 | ||
| Region | ||||||
| Border | 14 | 79 | 9 | 158 | ||
| Midland | 15 | 84 | 1 | 126 | ||
| West | 7 | 89 | 3 | 165 | ||
| Dublin | 15 | 82 | 3 | 884 | ||
| Mid-East | 13 | 83 | 4 | 227 | ||
| Mid-West | 6 | 90 | 5 | 150 | ||
| South-East | 7 | 92 | 2 | 230 | ||
| South-West | 14 | 81 | 6 | 323 | ||
| 'Type of Internet connection | ||||||
| broadband | 12 | 84 | 3 | 2,195 | ||
| narrowband | 27 | 69 | 6 | 40 | ||
| No internet | * | * | * | 20 | ||
| Unknown internet | * | * | * | 8 | ||
| Household Composition | ||||||
| 1 adult, no dependent children | 16 | 79 | 5 | 274 | ||
| 2 adults no dependent children | 13 | 84 | 2 | 615 | ||
| 3 or more adults no dependent children | 11 | 86 | 3 | 401 | ||
| 1 adult with dependent children | 10 | 83 | 7 | 100 | ||
| 2 adults with dependent children | 12 | 85 | 3 | 690 | ||
| 3 or more adults with dependent children | 10 | 87 | 3 | 183 | ||
| Number of persons at work in the household | ||||||
| 0 | 10 | 85 | 4 | 320 | ||
| 1 | 14 | 83 | 4 | 744 | ||
| 2 | 13 | 84 | 3 | 1,023 | ||
| 3+ | 7 | 90 | 4 | 176 | ||
| Note 1: Data are subject to sampling and other survey errors, which are relatively greater in respect of smaller values. | ||||||
| Note 2: Individuals represent all individuals aged 16-74. | ||||||
| Note 3: * Sample occurrence too small for estimation. | ||||||
| Note 4: Figures in parentheses [ ] indicate percentages based on small numbers, and are, therefore, subject to a wide margin of error. | ||||||
| Table 5(c) Individuals who recently used the internet (in the last 3 months) classified by methods of electronic file sharing, 2014 | ||||||||
| % of individuals | ||||||||
| E-mails with attached files | Personal websites (social networking sites) | Storage space on the internet | Other means not using internet (e.g. USB) | Do not share files | Unweighted Sample | |||
| State | 54 | 41 | 24 | 28 | 30 | 7,075 | ||
| Sex | ||||||||
| Male | 57 | 38 | 28 | 31 | 30 | 2,789 | ||
| Female | 52 | 43 | 21 | 26 | 30 | 4,286 | ||
| Age Group | ||||||||
| 16-29 | 58 | 61 | 30 | 34 | 20 | 1,057 | ||
| 30-44 | 58 | 44 | 28 | 31 | 26 | 2,858 | ||
| 45-59 | 49 | 22 | 17 | 23 | 41 | 2,155 | ||
| 60-74 | 40 | 14 | 9 | 13 | 52 | 1,005 | ||
| Principal Economic Status | ||||||||
| At work | 60 | 41 | 28 | 31 | 27 | 4,188 | ||
| Unemployed | 40 | 36 | 14 | 20 | 40 | 632 | ||
| Student | 61 | 64 | 35 | 41 | 15 | 424 | ||
| Home duties | 38 | 36 | 12 | 15 | 43 | 985 | ||
| Retired | 43 | 12 | 10 | 14 | 50 | 608 | ||
| Other | 37 | 33 | 13 | 18 | 48 | 238 | ||
| Region | ||||||||
| Border | 42 | 40 | 16 | 31 | 36 | 688 | ||
| Midland | 40 | 36 | 18 | 27 | 42 | 442 | ||
| West | 52 | 37 | 21 | 25 | 32 | 590 | ||
| Dublin | 66 | 45 | 34 | 35 | 23 | 2,200 | ||
| Mid-East | 55 | 42 | 22 | 21 | 28 | 788 | ||
| Mid-West | 51 | 40 | 20 | 24 | 34 | 536 | ||
| South-East | 47 | 34 | 20 | 18 | 41 | 738 | ||
| South-West | 51 | 43 | 24 | 28 | 30 | 1,093 | ||
| Type of Internet connection | ||||||||
| broadband | 56 | 42 | 25 | 29 | 29 | 6,659 | ||
| narrowband | 54 | 43 | 25 | 31 | 28 | 147 | ||
| No internet | 24 | 19 | 6 | 9 | 63 | 221 | ||
| Unknown internet | 24 | 11 | 11 | 9 | 65 | 48 | ||
| Household Composition | ||||||||
| 1 adult, no dependent children | 50 | 32 | 21 | 26 | 37 | 1,003 | ||
| 2 adults no dependent children | 56 | 39 | 27 | 26 | 32 | 1,900 | ||
| 3 or more adults no dependent children | 58 | 47 | 28 | 31 | 26 | 1,158 | ||
| 1 adult with dependent children | 39 | 54 | 17 | 21 | 29 | 358 | ||
| 2 adults with dependent children | 57 | 40 | 25 | 29 | 29 | 2,024 | ||
| 3 or more adults with dependent children | 48 | 43 | 19 | 29 | 32 | 632 | ||
| Number of persons at work in the household | ||||||||
| 0 | 40 | 35 | 19 | 19 | 43 | 1480 | ||
| 1 | 55 | 38 | 22 | 27 | 30 | 2452 | ||
| 2 | 60 | 45 | 29 | 32 | 25 | 2,656 | ||
| 3+ | 63 | 47 | 30 | 32 | 24 | 487 | ||
| Note 1: Data are subject to sampling and other survey errors, which are relatively greater in respect of smaller values. | ||||||||
| Note 2: Individuals represent all individuals aged 16-74. | ||||||||
| Note 3: Files includes documents, pictures,music, video or other files | ||||||||
| Note 4: More than one method of file sharing may be given by respondents | ||||||||
The Information and Communication Technology (ICT) household survey covers a range of topics related to the use of ICT by households and individuals. The ICT questionnaire focuses on the use of ICT for non-work related activities. The survey was conducted in the 1st Quarter of 2014 and asked respondents about their ICT activities over the previous 12 months. Each year the survey includes a specific group of questions relating to a particular area of ICT; in 2014 questions relating to the use of Cloud Computing were included.
A module on Information communication technology (ICT) is included in the Quarterly National Household Survey (QNHS) in the three months from January to March each year (Quarter 1). The questionnaire asks questions about ICT activities for the reference period of twelve months prior to the interviews taking place.
The annual ICT Household survey by the QNHS contributes to the EU requirement under Regulation (EC) No 808/2004 of the European Parliament and of the Council of 21 April 2004 concerning Community statistics on the information society (OJ L143, 30.04.2004, p. 49). The QNHS began in September 1997, replacing the annual April Labour Force Survey (LFS). The purpose of the survey is the production of quarterly labour force estimates and occasional reports on special social topics. The ICT Household questionnaire is conducted in Quarter 1 as part of the QNHS. The annual ICT household survey is one of the special module subjects that make up the ad hoc module surveys appended onto the main QNHS Labour Force Survey.
Grossing
The QNHS grossing procedure aligns the distribution of persons covered in the survey with independently determined population estimates at the level of sex, five-year age group and region.
All estimates based on sample surveys are subject to error, some of which is measurable. Where an estimate is statistically significantly different from another estimate it means that we can be 95% confident that differences between those two estimates are not due to sampling error. Unless otherwise stated, changes and differences mentioned in the text have been found to be statistically significant at the 95% confidence level
Survey Questionnaire
The 2014 ICT household questionnaire is available at
Detailed Methodology and Background notes available at
Information Society Statistics - Households
 Hide Background Notes
Scan the QR code below to view this release online or go to
http://www.cso.ie/en/releasesandpublications/er/isshh/informationsocietystatistics-households2014/
 Show Table 1(a) Households with internet access, 2008 to 2014
 Hide Table 1(a) Households with internet access, 2008 to 2014