
| Enterprise use of paid advertising on the internet, 2016 and 2018 | |||||
| % | |||||
| Ireland 2016 | Ireland 2018 | EU-28 2016 | EU-28 2018 | ||
| Any use of paid advertising on the internet | 33 | 34 | 25 | 26 | |
| Based on webpages' content or keywords searched by users | 26 | 26 | 19 | 21 | |
| Based on tracking of internet users' past activities or profile | 13 | 13 | 7 | 8 | |
| Based on geolocation of internet users | 14 | 18 | 7 | 10 | |
| Based on any other method of targeted advertising | 15 | 16 | 9 | 10 | |
| Enterprises can use more than one type of paid advertising, hence the sum of the different types does not equal the total figure. | |||||
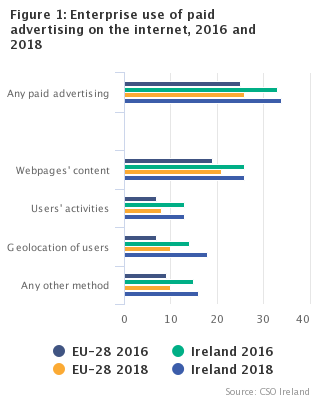
34% of Irish enterprises reported to have paid to advertise on the internet in 2018, such as on search engines, social media and other websites. See Headline Table.
The most popular advertising method was based on webpages' content or keywords searched by users, with 26% paying for this method. 18% opted for advertising based on the geolocation of internet users, with 13% based on tracking of internet users' past activities or profile. 16% opted for other targeted advertising methods.
In terms of enterprises using paid advertising, Ireland ranked joint seventh in the EU-28. Denmark and Malta had the largest percentage of enterprises in the EU-28 using paid advertising at 47%, while Romania had the lowest usage at 15%. See Figure 1 and Table 1.
| 2016 | 2018 | |
| Enterprise purchase of any cloud computing services | 36 | 45 |
| 0 | 0 | |
| Storage of files | 27 | 35 |
| 25 | 35 | |
| Office Software | 17 | 28 |
| Hosting the enterprise's databases | 16 | 24 |
| Finance or accounting software applications | 13 | 20 |
| Customer Relationship Management (CRM) software | 11 | 16 |
| Computing power to run the enterprise's own software | 8 | 10 |
Purchase of cloud computing services by Irish enterprises increased in 2018
In 2018, 45% of Irish enterprises employing 10 or more persons purchased cloud computing services. This increased from 36% in 2016 and compared with an EU-28 average of 26% in 2018. Finland had the largest percentage of enterprises in the EU purchasing cloud computing services at 65%, while Bulgaria had the lowest take up rate at 8%. The most popular cloud computing services purchased by Irish enterprises in 2018 were the storage of files and e-mail, both at 35%. See Figure 2 and Tables 2(a) and 2(b).
| 2018 | |
| Big Data using any source | 20 |
| 0 | |
| Enterprise's own data from smart devices or sensors | 8 |
| Geolocation data from the use of portable devices | 6 |
| Data generated from social media | 13 |
| Other Big Data sources | 6 |
20% of enterprises used Big Data analysis in 2018
20% of Irish enterprises reported that they used Big Data in 2018. The most popular method was analysing data generated from social media, with 13% of enterprises using this method, while 8% opted for analysing their enterprise's own data from smart devices or sensors. See Figure 3 and Table 3.
| Other sales | e-Commerce sales | |
| Small (10 to 49) | 76 | 24 |
| Medium (50 to 249) | 71 | 29 |
| Large (250+) | 58 | 42 |
Over half of large and medium sized enterprises conducted their sales electronically
In 2018, 61% of large enterprises had e-Commerce sales which accounted for 42% of total sales of such enterprises. 31% of small enterprises had e-Commerce sales which accounted for 24% of all sales in this size class. 53% of medium sized enterprises had e-Commerce sales which accounted for 29% of their total sales. See Figure 4 and Table 4.
| Other purchases | e-Commerce purchases | |
| Small (10 to 49) | 69 | 31 |
| Medium (50 to 249) | 71 | 29 |
| Large (250+) | 57 | 43 |
75% of large enterprises made e-Commerce purchases in 2018
In 2018, 75% of large enterprises made e-Commerce purchases which accounted for 43% of all purchases made by enterprises that employed 250 or more persons, while 63% of medium sized enterprises made e-Commerce purchases which accounted for 29% of total purchases for this size class. 49% of small enterprises made e-Commerce purchases which amounted to 31% of their total purchases. See Figure 5 and Table 4.
| Percentage of enterprises with e-Commerce purchases | Percentage of enterprises with e-Commerce sales | |
| Small (10 to 49) | 49 | 31 |
| Medium (50 to 249) | 63 | 53 |
| Large (250+) | 75 | 61 |
More enterprises engaged in e-Commerce purchases than sales
Across all size classes, the proportion of enterprises that have made e-Commerce purchases is higher than those enterprises who have made e-Commerce sales. Small enterprises had the greatest difference between e-Commerce purchases and sales. See Figure 6 and Table 4.
| e-Commerce purchases as a percentage of total enterprises | e-Commerce purchases as a percentage of total purchases | |
| Manufacturing | 48 | 37 |
| Construction | 38 | 3 |
| Selected services | 52 | 37 |
Enterprises in the Services sector had largest share of e-Commerce purchases
In 2018, Services sector enterprises reported that 52% of enterprises had made e-Commerce purchases which accounted for 37% of total purchases in that sector. Comparable figures for Manufacturing enterprises indicated that 48% of enterprises also made e-Commerce purchases which accounted for 37% of total purchases. When looking at the Construction sector, 38% reported making e-commerce purchases which accounted for just 3% of all purchases made in this category. See Figure 7 and Table 5.
| e-Commerce sales as a percentage of total enterprises | e-Commerce sales as a percentage of total turnover | |
| Manufacturing | 38 | 39 |
| Construction | 10 | 3 |
| Selected services | 35 | 34 |
Manufacturing sector had the largest share of e-Commerce sales by turnover
Looking at the detailed sectors shows that 38% of Manufacturing enterprises reported e-Commerce sales which accounted for 39% of total turnover for that sector. The Services sector reported that 35% of enterprises had e-Commerce sales which accounted for 34% of all turnover generated in that sector. Just 10% of Construction enterprises made e-Commerce sales which accounted for 3% of total Construction turnover. See Figure 8 and Table 5.
| Table 1 Enterprise purchase of internet advertising, 2018 | |||||
| % | |||||
| Pay to advertise on the internet | Based on webpages' content or keywords searched by users | Based on tracking of internet users' past activities or profile | Based on geolocation of internet users | Based on any other method of targeted advertising | |
| EU-28 | 26 | 21 | 8 | 10 | 10 |
| Belgium | 30 | 21 | 10 | 11 | 13 |
| Bulgaria | 21 | 16 | 5 | 6 | 7 |
| Czech Republic | 31 | 27 | 10 | 11 | 13 |
| Denmark | 47 | 33 | 15 | 21 | 19 |
| Germany | 27 | 23 | 7 | 9 | 8 |
| Estonia | 28 | 21 | 15 | 11 | 17 |
| Ireland | 34 | 26 | 13 | 18 | 16 |
| Greece | 28 | 23 | 11 | 12 | 14 |
| Spain | 25 | 18 | 10 | 9 | 12 |
| France | 19 | 16 | 6 | 6 | 8 |
| Croatia | 27 | 19 | 8 | 6 | 7 |
| Italy | 21 | 15 | 5 | 8 | 9 |
| Cyprus | 33 | 27 | 16 | 18 | 3 |
| Latvia | 26 | 20 | 3 | 5 | 6 |
| Lithuania | 35 | 28 | 13 | 9 | 15 |
| Luxembourg | 36 | 23 | 9 | 12 | 13 |
| Hungary | 21 | 17 | 6 | 7 | 8 |
| Malta | 47 | 34 | 19 | 22 | 32 |
| Netherlands | 34 | 30 | 14 | 15 | 17 |
| Austria | 32 | 23 | 10 | 12 | 9 |
| Poland | 26 | 23 | 8 | 7 | 9 |
| Portugal | 16 | 12 | 7 | 7 | 9 |
| Romania | 15 | 13 | 6 | 5 | 6 |
| Slovenia | 22 | 20 | 7 | 7 | 1 |
| Slovakia | 25 | 19 | 8 | 6 | 10 |
| Finland | 37 | 31 | 18 | 16 | 12 |
| Sweden | 44 | 27 | 10 | 14 | 12 |
| United Kingdom | 32 | 24 | 12 | 15 | 13 |
| Source: Eurostat | |||||
| Enterprises could purchase more than one type of advertising method, hence the sum of the different types does not equal the total figure. | |||||
| Table 2(a) Enterprise purchase of cloud computing services, 2016 and 2018 | |||
| % | |||
| 2016 | 2018 | ||
| Purchase of any cloud computing services | 36 | 45 | |
| of which - | Storage of files | 27 | 35 |
| 25 | 35 | ||
| Office software | 17 | 28 | |
| Hosting the enterprise's database(s) | 16 | 24 | |
| Finance or accounting software applications | 13 | 20 | |
| Customer Relationship Managemant (CRM) software | 11 | 16 | |
| Computing power to run the enterprise's own software | 8 | 10 | |
| Enterprises could purchase more than one type of cloud computing service, hence the sum of the different cloud computing services type does not equal the total figure. | |||
| Table 2(b) EU enterprise purchase of cloud computing services, 2016 and 2018 | ||
| % | ||
| 2016 | 2018 | |
| EU-28 | 21 | 26 |
| Belgium | 28 | 40 |
| Bulgaria | 7 | 8 |
| Czech Republic | 18 | 26 |
| Denmark | 42 | 56 |
| Germany | 16 | 22 |
| Estonia | 23 | 34 |
| Ireland | 36 | 45 |
| Greece | 9 | 13 |
| Spain | 18 | 22 |
| France | 17 | 19 |
| Croatia | 23 | 31 |
| Italy | 22 | 23 |
| Cyprus | 15 | 27 |
| Latvia | 8 | 15 |
| Lithuania | 17 | 23 |
| Luxembourg | 19 | 25 |
| Hungary | 12 | 18 |
| Malta | 28 | 37 |
| Netherlands | 35 | 48 |
| Austria | 17 | 23 |
| Poland | 8 | 11 |
| Portugal | 18 | 25 |
| Romania | 7 | 10 |
| Slovenia | 22 | 26 |
| Slovakia | 18 | 21 |
| Finland | 57 | 65 |
| Sweden | 48 | 57 |
| United Kingdom | 35 | 42 |
| Source: Eurostat | ||
| Table 3 Use of Big Data analysis, 2018 | |
| % | |
| Analysing Big Data using any source | 20 |
| analysing enterprise's own data from smart devices or sensors | 8 |
| analysing geolocation data from the use of portable devices | 6 |
| analysing data generated from social media | 13 |
| analysing other Big Data sources | 6 |
| Enterprises can use more than one type of Big Data analysis, hence the sum of the different types does not equal the total figure. | |
| Table 4 ICT usage by size of enterprise, 2018 | |||||
| % | |||||
| Small (10 to 49) | Medium (50 to 249) | Large (250+) | |||
| Enterprises with e-Commerce sales | 31 | 53 | 61 | ||
| e-Commerce sales as a % of total sales | 24 | 29 | 42 | ||
| Enterprises with e-Commerce purchases | 49 | 63 | 75 | ||
| e-Commerce purchases as a % of total purchases | 31 | 29 | 43 | ||
| Enterprises using broadband | 95 | 98 | 99 | ||
| Enterprises using mobile broadband connection | 69 | 85 | 96 | ||
| Table 5 Purchases and sales via e-Commerce, 2017 and 2018 | ||||||||||
| % | ||||||||||
| Manufacturing sector | Construction sector | Selected services sectors | Total | |||||||
| 2017 | 2018 | 2017 | 2018 | 2017 | 2018 | 2017 | 2018 | |||
| Use of e-Commerce for purchases (as % of total enterprises) | ||||||||||
| by internet or EDI | 48 | 48 | 37 | 38 | 48 | 52 | 48 | 52 | ||
| Use of e-Commerce for sales (as % of total enterprises) | ||||||||||
| by internet or EDI | 42 | 38 | 18 | 10 | 32 | 35 | 33 | 35 | ||
| by internet | 20 | 22 | 11 | 7 | 27 | 31 | 26 | 29 | ||
| by EDI | 32 | 28 | 8 | 6 | 15 | 13 | 16 | 14 | ||
| Percentage of purchases by e-Commerce (as % of total purchases) | ||||||||||
| by internet or EDI | 36 | 37 | 4 | 3 | 34 | 37 | 34 | 36 | ||
| Percentage of sales by e-Commerce (as % of total turnover) | ||||||||||
| by internet or EDI | 35 | 39 | 2 | 3 | 33 | 34 | 34 | 35 | ||
| by internet | 7 | 10 | 0 | 1 | 20 | 18 | 16 | 15 | ||
| by EDI | 28 | 29 | 2 | 3 | 14 | 16 | 18 | 21 | ||
| Table 6 Purchases and sales via e-Commerce by sector, 2018 | ||||||||||||||||||||
| % | ||||||||||||||||||||
| Manufacturing sector | Construction sector | Selected services sectors | ||||||||||||||||||
| NACE Division1 | 10-18 | 19-22 | 23-25 | 26-33 | Total | 41-43 | 45-47 | 49-53 | 55-56 | 58-63 | 68 | 69-74 | 77-82 | Total | Total | |||||
| Use of e-Commerce for purchases (as % of total enterprises) | ||||||||||||||||||||
| by internet or EDI | 41 | 64 | 45 | 53 | 48 | 38 | 57 | 45 | 41 | 67 | 57 | 58 | 48 | 52 | 52 | |||||
| Use of e-Commerce for sales (as % of total enterprises) | ||||||||||||||||||||
| by internet or EDI | 48 | 51 | 22 | 29 | 38 | 10 | 37 | 43 | 42 | 36 | 30 | 19 | 22 | 35 | 35 | |||||
| by internet | 27 | 33 | 10 | 20 | 22 | 7 | 33 | 38 | 41 | 30 | 24 | 13 | 18 | 31 | 29 | |||||
| by EDI | 38 | 31 | 16 | 21 | 28 | 6 | 15 | 20 | 8 | 15 | 13 | 11 | 10 | 13 | 14 | |||||
| Percentage of purchases by e-Commerce (as % of total purchases) | ||||||||||||||||||||
| by internet or EDI | 6 | 36 | 5 | 58 | 37 | 3 | 40 | 49 | 22 | 35 | 27 | 18 | 15 | 37 | 36 | |||||
| Percentage of sales by e-Commerce (as % of total turnover) | ||||||||||||||||||||
| by internet or EDI | 25 | 35 | 4 | 46 | 39 | 3 | 38 | 52 | 20 | 32 | 6 | 13 | 18 | 34 | 35 | |||||
| by internet | 7 | 4 | 1 | 14 | 10 | 1 | 16 | 43 | 14 | 20 | 6 | 7 | 9 | 18 | 15 | |||||
| by EDI | 19 | 31 | 3 | 32 | 29 | 3 | 22 | 9 | 5 | 12 | 1 | 6 | 10 | 16 | 21 | |||||
| 1 See Background notes for NACE Rev.2 classification. | ||||||||||||||||||||
| Table 7 Purchases via e-Commerce by enterprises, EU-28, 2016 - 2018 | |||
| % | |||
| 2016 | 2017 | 2018 | |
| EU-28 | 42 | 45 | : |
| Belgium | 40 | 44 | 49 |
| Bulgaria | 11 | 13 | 17 |
| Czech Republic | 62 | 57 | 61 |
| Denmark | : | : | 66 |
| Germany | : | 56 | : |
| Estonia | 25 | 25 | 26 |
| Ireland | 46 | 48 | 52 |
| Greece | 15 | 11 | 14 |
| Spain | 32 | 32 | 31 |
| France | 55 | 51 | : |
| Croatia | 23 | 26 | 37 |
| Italy | 41 | 43 | : |
| Cyprus | 43 | 41 | 34 |
| Latvia | 41 | 31 | 45 |
| Lithuania | 26 | 28 | 36 |
| Luxembourg | 42 | 38 | 45 |
| Hungary | 37 | 38 | 41 |
| Malta | : | : | : |
| Netherlands | 52 | 57 | 66 |
| Austria | 66 | 63 | : |
| Poland | 35 | 33 | 34 |
| Portugal | 27 | 25 | 28 |
| Romania | 14 | 12 | 14 |
| Slovenia | 29 | : | : |
| Slovakia | 25 | 22 | 27 |
| Finland | : | : | : |
| Sweden | 37 | 56 | 78 |
| United Kingdom | 54 | 51 | 53 |
| Source: Eurostat | |||
| : indicates no figure available. | |||
| Table 8 Sales via e-Commerce by enterprises, EU-28, 2016 - 2018 | |||
| % | |||
| 2016 | 2017 | 2018 | |
| EU-28 | 20 | 20 | 20 |
| Belgium | 26 | 26 | 30 |
| Bulgaria | 9 | 10 | 8 |
| Czech Republic | 27 | 24 | 25 |
| Denmark | 29 | 30 | 32 |
| Germany | 28 | 26 | 22 |
| Estonia | 18 | 19 | 20 |
| Ireland | 30 | 33 | 35 |
| Greece | 12 | 12 | 12 |
| Spain | 21 | 21 | 20 |
| France | 21 | 21 | 19 |
| Croatia | 19 | 18 | 18 |
| Italy | 11 | 13 | 14 |
| Cyprus | 13 | 13 | 14 |
| Latvia | 10 | 12 | 13 |
| Lithuania | 20 | 23 | 22 |
| Luxembourg | 15 | 13 | 16 |
| Hungary | 15 | 16 | 15 |
| Malta | 20 | 18 | 22 |
| Netherlands | 25 | 26 | 27 |
| Austria | 19 | 21 | 18 |
| Poland | 12 | 12 | 14 |
| Portugal | 19 | 18 | 19 |
| Romania | 7 | 8 | 9 |
| Slovenia | 20 | 25 | 25 |
| Slovakia | 15 | 18 | 16 |
| Finland | 22 | 24 | 24 |
| Sweden | 28 | 31 | 32 |
| United Kingdom | 22 | 23 | 22 |
| Source: Eurostat | |||
| Table 9 General findings of enterprise ICT survey, as a percentage of all enterprises, 2017 - 2018 | ||||||||||||
| % | ||||||||||||
| Manufacturing sector | Construction sector | Selected services sectors | Total | |||||||||
| 2017 | 2018 | 2017 | 2018 | 2017 | 2018 | 2017 | 2018 | |||||
| General information about ICT systems | ||||||||||||
| Using a computer | 100 | 100 | 99 | 99 | 99 | 97 | 99 | 97 | ||||
| Use of the internet | ||||||||||||
| Using the internet | 100 | 99 | 99 | 99 | 96 | 96 | 96 | 97 | ||||
| Have a website or homepage | 91 | 90 | 75 | 79 | 73 | 77 | 74 | 79 | ||||
| Purposes of using the internet (as provider) | ||||||||||||
| Providing links or references to the enterprise's social media profiles | 51 | 46 | 35 | 31 | 52 | 51 | 52 | 50 | ||||
| Facilitating access to online ordering or reservations | 16 | 17 | 9 | 5 | 27 | 31 | 25 | 29 | ||||
| Table 10 General findings of enterprise ICT survey, as a percentage of all enterprises, by sector, 2018 | ||||||||||||||||||||
| % | ||||||||||||||||||||
| Manufacturing sector | Construction sector | Selected services sectors | ||||||||||||||||||
| NACE Division1 | 10-18 | 19-22 | 23-25 | 26-33 | Total | 41-43 | 45-47 | 49-53 | 55-56 | 58-63 | 68 | 69-74 | 77-82 | Total | Total | |||||
| General information about ICT systems | ||||||||||||||||||||
| Using a computer | 99 | 100 | 100 | 100 | 100 | 99 | 99 | 100 | 91 | 99 | 100 | 98 | 98 | 97 | 97 | |||||
| Use of the internet | ||||||||||||||||||||
| Using the internet | 99 | 98 | 100 | 100 | 99 | 99 | 99 | 100 | 90 | 98 | 100 | 97 | 98 | 96 | 97 | |||||
| Have a website or homepage | 90 | 82 | 92 | 93 | 90 | 79 | 69 | 81 | 78 | 90 | 84 | 88 | 82 | 77 | 79 | |||||
| Purposes of using the internet (as provider) | ||||||||||||||||||||
| Providing links or references to the enterprise's social media profiles | 46 | 49 | 47 | 43 | 46 | 31 | 46 | 44 | 54 | 73 | 52 | 54 | 48 | 51 | 50 | |||||
| Facilitating access to online ordering or reservations | 20 | 24 | 13 | 13 | 17 | 5 | 33 | 34 | 46 | 20 | 28 | 10 | 20 | 31 | 29 | |||||
| 1 See Background notes for NACE Rev.2 classification. | ||||||||||||||||||||
| Table 11 External connection to the internet, as a percentage of all enterprises, by sector, 2017 - 2018 | |||||||||||||
| % | |||||||||||||
| Manufacturing sectors | Construction sector | Selected services sectors | Total | ||||||||||
| 2017 | 2018 | 2017 | 2018 | 2017 | 2018 | 2017 | 2018 | ||||||
| Type of external connection to the internet | |||||||||||||
| Broadband | 100 | 98 | 99 | 97 | 96 | 95 | 96 | 96 | |||||
| Mobile broadband connection | 77 | 78 | 77 | 74 | 66 | 71 | 68 | 72 | |||||
| Enterprises with broadband | |||||||||||||
| Purchases by internet or EDI | 48 | 49 | 37 | 39 | 50 | 55 | 50 | 53 | |||||
| Sales by internet or EDI | 42 | 39 | 18 | 10 | 34 | 37 | 34 | 36 | |||||
| Table 12 External connection to the internet, as a percentage of all enterprises, by sector, 2018 | ||||||||||||||||||||
| % | ||||||||||||||||||||
| Manufacturing sector | Construction sector | Selected services sectors | ||||||||||||||||||
| NACE Division 1 | 10-18 | 19-22 | 23-25 | 26-33 | Total | 41-43 | 45-47 | 49-53 | 55-56 | 58-63 | 68 | 69-74 | 77-82 | Total | Total | |||||
| Type of external connection to the internet | ||||||||||||||||||||
| Broadband | 97 | 98 | 96 | 100 | 98 | 97 | 98 | 98 | 88 | 95 | 100 | 96 | 97 | 95 | 96 | |||||
| Mobile broadband connection | 76 | 87 | 75 | 80 | 78 | 74 | 71 | 79 | 53 | 84 | 78 | 82 | 87 | 71 | 72 | |||||
| Enterprises with broadband | ||||||||||||||||||||
| Purchases by internet or EDI | 42 | 64 | 47 | 53 | 49 | 39 | 58 | 46 | 46 | 70 | 57 | 59 | 49 | 55 | 53 | |||||
| Sales by internet or EDI | 50 | 52 | 23 | 29 | 39 | 10 | 38 | 44 | 47 | 37 | 30 | 19 | 23 | 37 | 36 | |||||
| 1See Background notes for NACE Rev.2 classification. | ||||||||||||||||||||
The Survey on e-Commerce and ICT is conducted to provide harmonised enterprise statistics at EU level. The survey is carried out annually under EU Regulation (EC) No. 808/2004.
The Survey on e-Commerce and ICT was conducted as a wholly electronic survey for the first time in 2013 via the CSO’s e-form system, allowing sampled enterprises to complete and return the survey form electronically. Reminders are periodically sent to non-respondents throughout the year and a telephone campaign is also conducted to ensure that the response rate is sufficient for the survey. The 2018 response rate was 40.5%. Returned survey forms are verified and edited before the data is grossed up to the sample frame population.
A pilot survey was conducted in 2002 and a full annual survey began in 2003. Approximately 6,000 enterprises are surveyed in the first quarter of each year. The sample of enterprises is chosen from the CSO’s Business Register. The overall results are released by Eurostat on an EU-28-wide basis in December each year. The results presented in this release are from the 2018 survey. The results cover enterprises with ten or more persons engaged in the manufacturing, construction and selected services sectors. Enterprises operating in the following NACE Rev.2 classifications were included in the coverage of this survey. NACE coding is a classification system which groups enterprises according to their business activities. Each business activity category is assigned a unique NACE code.
NACE Rev.2 categories used in the ICT survey
| Section C (10-33) | Manufacturing: Food, beverages, tobacco, textiles, wearing apparel, leather, wood, printing and paper products (10 to 18); Petroleum, chemical, pharmaceutical, rubber and plastic products (19 to 22); Other non-metallic mineral products, basic metals and fabricated metal products (23 to 25); Computer, electronic and other equipment, repairs and installation, other manufacturing (26 to 33). |
| Section D, E (35-39) | Electricity, gas and steam, water supply, sewerage and waste management |
| Section F (41-43) | Construction |
| Section G (45-47) | Wholesale and retail trade; repair of motor vehicles and motorcycles |
| Section H (49-53) | Transportation and storage |
| Section I (55-56) | Accommodation and food service activities |
| Section J (58-63) | Information and communication |
| Section L (68) | Real estate activities |
| Division M (69-74) | Professional, scientific and technical activities (selected sectors) |
| Section N (77-82) | Administrative and Support Service activities |
| Group (95.1) | Repair of computers m, water supply, sewerage and waste management) |
Results are based on the survey of Survey on e-Commerce and ICT by an enterprise, which was conducted in the first half of 2018. This survey covers enterprises with 10 or more persons engaged in the manufacturing, construction and selected services sectors.
The Survey on e-Commerce and ICT usage is carried out across all member countries of the EU-28. Each national country designs its own enterprise survey, using a template questionnaire issued by Eurostat, and incorporating some optional modules.
National results are transmitted to Eurostat annually and subsequently published by Eurostat in December of each year. Published results for Ireland may differ slightly from those in the Eurostat tables due to rounding. Further information on Eurostat tables and comparable results across member countries of the EU-28 are available online at
Broadband: High-speed, always-on internet access running with a speed of greater than 128Kb/sec (Kilobytes per second).
Digital Subscriber Line (DSL): Digital Subscriber Line technologies are designed to increase bandwidth available over standard copper telephone wires. Includes IDSL, HDSL, SDSL, ADSL, RADSL, VDSL, DSL-Lite and xDSL.
Electronic Commerce (e-Commerce): Transactions conducted over IP (Internet Protocol) based networks and over other computer mediated networks. The goods and services are ordered over those networks, but the payment and ultimate delivery of the goods or service may be conducted on or offline. Orders received via telephone, facsimile and non-interactive e-mails are not counted as electronic commerce.
Electronic Data Interchange (EDI): Electronic exchange of forms, such as for orders, between geographically dispersed locations.
Enterprise Resource Planning (ERP): Enterprise Resource Planning consists of one or a set of software applications that integrate information and processes across the several business functions of the enterprise.
Extranet: A secure extension of an intranet that allows external users to access some parts of an organisation’s intranet.
Intranet: An internal company communications network using IP-based communications within an organisation.
Integrated Services Digital Network (ISDN): Integrated Services Digital Network is the digital version of the old telephone system. ISDN offers many services such as private virtual networks, high-speed facsimile (fax), video-conferencing and most importantly, high speed communications.
LAN: Local Area Network. This relates to your company’s computer network, usually within an office, building or closed geographical area.
Modem: Device that converts outgoing digital signals from a computer to analogue signals which can be transmitted via a conventional copper telephone line and which converts incoming analogue signals to digital.
Social Media: Use of social media refers to the enterprise’s use of applications based on internet technology or communication platforms for connecting, creating and exchanging content online with customers, suppliers, partners or within the enterprise. Enterprises using social media are considered to be those that have a user profile, an account or a user licence depending on the requirements of the social media type.
Social networks e.g. Facebook, Linkedln, Xing, Viadeo, Yammer, etc
Blogs or microblogs e.g. Twitter
Multimedia content shared websites e.g. YouTube, Flickr, Picassa, SlideShare
Wiki based knowledge sharing sites e.g. Wikipedia
| Member states of the EU-28 |
|---|
| Austria |
| Belgium |
| Bulgaria |
| Croatia |
| Cyprus |
| Czech Republic |
| Denmark |
| Estonia |
| Finland |
| France |
| Germany |
| Greece |
| Hungary |
| Ireland |
| Italy |
| Latvia |
| Lithuania |
| Luxembourg |
| Malta |
| Netherlands |
| Poland |
| Portugal |
| Romania |
| Slovakia |
| Slovenia |
| Spain |
| Sweden |
| United Kingdom |
 Hide Background Notes
Scan the QR code below to view this release online or go to
http://www.cso.ie/en/releasesandpublications/er/iss/informationsocietystatistics-enterprises2018/
 Show Table 1 Enterprise purchase of internet advertising, 2018
 Hide Table 1 Enterprise purchase of internet advertising, 2018