
This release has been compiled during the COVID-19 crisis. The results contained in this release reflect some of the economic impacts of the COVID-19 situation. For further information see our Information Note.
| Seasonally Adjusted Gross Household Saving by Component | |||
| €m | Total Disposable Income | Final Consumption Expenditure | Gross Saving Ratio |
| (B.6g + D.8) | (P.3) | ||
| Quarter | |||
| Q4 2020 | 31,659 | 23,494 | 25.8% |
| Q1 2021 | 32,185 | 22,196 | 31.0% |
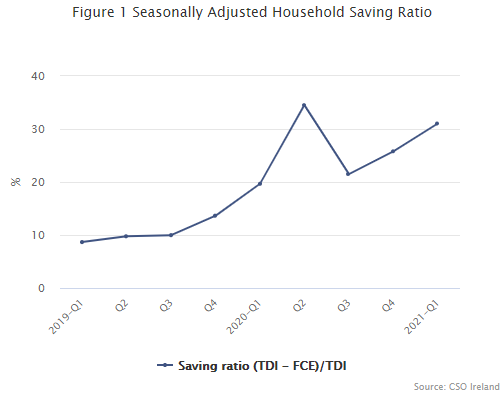
In the first quarter of the year, households saved over €10bn: that is more than four times the amount usually saved in the first quarter of the year. As in the other quarters since pandemic-related restrictions have come in, the high level of saving was due to incomes holding up or increasing while spending was depressed. See our Infographic. COVID-19 restrictions imposed after Christmas severely limited opportunities to spend on activities such as dining out. The uncertainty around the trajectory of the pandemic may also have induced 'precautionary savings' as households kept money back, anticipating tightening finances in the future.
On the income side of the account, households were supported by government interventions. Government subsidies were up by €1.1bn and social protection payments grew by €2.7bn (see table S13, below) compared to the first quarter of 2020 (the economic effect of COVID-19 was largely confined to the last few weeks of quarter 1 in 2020). The subsides were paid to employers and then to workers as the Employment Wage Subsidy Scheme, while the increase in social protection payments was largely made up of the Pandemic Unemployment Payment. While this was a large-scale intervention, median income for those receiving the PUP declined compared to income when working. This decline in income was offset by higher median incomes for those in work. The total wage bill in some parts of the economy (such as finance, IT, and public service) rose due to higher earnings per week and more people being employed in those sectors. Even after higher taxes and social contributions are taken into account, overall gross disposable income (B.6g) rose. The CSO's COVID-19 Information Hub has further information on COVID-19's social impact and the changes in employment and business in recent months.
The largest proportion of the extra saving was added to deposits in Irish banks. Most of these deposits are available immediately to households to use as restrictions ease. Saving also went into pension funds and paying off mortgages and other loans. Capital investment (fixed capital formation, P.5) in new housing and improvement to dwellings was largely unchanged on this period last year, perhaps because of restrictions on construction activity.
|
The seasonally adjusted data series which includes Gross Disposable Income, Personal Consumption of Goods and Services and Gross Saving of the Household incl. NPISH sector is available on PxStat. Only the most significant transactions are shown in the table for each sector in this release. The entire unadjusted series for all variables published in this release are also available at the same link. See Background Notes for definitions of the terms used. |
| Table S1M Households and NPISH (€million) | |||||||
| ESA Code | Description | 2020Q1 | 2020Q2 | 2020Q3 | 2020Q4 | 2021Q1 | 2021Q1 versus 2020Q1 |
| B2A3G | Self-employment and rent | 8,390 | 7,426 | 7,075 | 7,076 | 7,907 | -483 |
| D1 | Paid employment | 26,392 | 23,208 | 24,475 | 26,815 | 25,592 | -800 |
| D4_rec | Investment income received | 1,294 | 1,565 | 1,200 | 1,108 | 1,152 | -142 |
| D4_paid | minus Interest paid after FISIM | -325 | -322 | -351 | -342 | -357 | -32 |
| D5_paid | minus PAYE, income tax etc | -6,000 | -5,124 | -5,577 | -8,907 | -6,550 | -550 |
| D61 | minus PRSI, pension contributions etc | -5,814 | -5,012 | -5,290 | -5,747 | -5,747 | 67 |
| D62 | plus Social protection, pensions received | 7,701 | 10,239 | 8,847 | 10,057 | 10,414 | 2,713 |
| D7_net | plus net miscellaneous transfers | -53 | 83 | -15 | -61 | 45 | 99 |
| B6G | equals gross disposable income | 31,584 | 32,062 | 30,364 | 30,000 | 32,456 | 873 |
| D8 | plus adjustment for pension fund value | 402 | 353 | 271 | 240 | 346 | -56 |
| P3 | minus consumer spending | -24,553 | -20,185 | -23,696 | -24,984 | -21,644 | 2,909 |
| B8G | equals gross saving | 7,432 | 12,230 | 6,939 | 5,256 | 11,157 | 3,725 |
| D9_net | plus net capital transfers | 121 | 177 | 102 | 71 | 111 | -10 |
| P5 | minus capital spending | -1,370 | -854 | -1,563 | -1,816 | -1,319 | 52 |
| B9 | equals net lending (+) /borrowing (-) | 6,183 | 11,552 | 5,478 | 3,510 | 9,950 | 3,767 |
Domestic Economy Grows
The economy as a whole grew in 2021-Q1, driven by non-financial corporations' higher gross value added. This increase is seen in their higher gross operating surplus (profit), rather than their compensation of employees. Corporations that manufacture medicines and tech equipment, or provide information and communication services were responsible for most of this expansion. These economic activities are dominated by multi-national corporations. At the same time, economic sectors dominated by smaller domestic corporations, such as construction and trade, had lower gross value added. More information is contained in the Quarterly National Accounts.
Ireland has a positive current account (CA) balance in the quarter (the negative of B.12 of S.2). This meant that Ireland (including, of course, the foreign-owned corporations operating here) generated a surplus to invest in the rest of the world. The current account balance can also be seen as what is left of gross saving (B.8g) after the country has invested in fixed capital (P.5): we invest disposable income here and we invest in the rest of the world.
Gross Saving - Investment = Current Account Balance.
Gross Saving less investment can be estimated for each sector, showing the contribution of corporations, government and household to the change in our account with the rest of the world. Figure 2 illustrates the trends in, and relationships between the current account balance, gross saving and investment.
It is immediately obvious how much the current account balance is driven by non-financial corporations (dark blue bars). Between 2017 and 2020 these corporations invested in large intellectual property assets (IP, such as patents), so their saving minus investment was large and negative. This IP was imported from the rest of the world, driving up our service imports, and making the current account balance negative. From the second quarter of 2020 onward, these huge IP investments are absent, so the current account balance is positive and steadier. Figure 2 also illustrates the pattern for government and household saving and investment (click on the legend to hide corporations). While government (S.13) has a deficit after capital spending, households (S.1M) have positive net transactions after capital investment, suggesting that domestic sectors are not increasing overall borrowing requirements from the rest of the world.
| S11 | S12 | S13 | S1M | CA Balance | |
| 2017-Q1 | 7.30995365308439 | 0.994085672992672 | -1.00320929778574 | 1.3692972697087 | 5.99448 |
| 2017-Q2 | -37.5432058347061 | -1.20351083416569 | -0.017876370823263 | 2.04485672277229 | -31.7590036149228 |
| 2017-Q3 | 9.66970120240172 | 0.616774118075306 | -1.9332988583887 | 2.83266683591168 | 14.39533 |
| 2017-Q4 | 11.6149041886768 | -0.117369592559432 | 2.38888269664028 | 0.190220105242401 | 12.82749 |
| 2018-Q1 | 8.32016097840807 | 1.02707151665135 | -1.54414972902758 | 0.967051798468144 | 10.08247530725 |
| 2018-Q2 | 6.94860664168263 | -1.12654581081356 | 0.292583293008362 | 2.11185114062258 | 9.72370530725001 |
| 2018-Q3 | 12.0949728176448 | 0.856156804172466 | -1.55829291752197 | 2.53841829020472 | 10.17739530725 |
| 2018-Q4 | -14.3451130685433 | -0.548914364020926 | 4.03637316970224 | -0.669745172638056 | -13.97665469275 |
| 2019-Q1 | 8.72285978670001 | 0.610099643134643 | -1.90380461464293 | 1.69421549480827 | 9.91761 |
| 2019-Q2 | -35.2641750130456 | -1.27726047315952 | 0.973352611096357 | 2.85157488510871 | -33.53223 |
| 2019-Q3 | 11.9594942051805 | 1.04397812050111 | -1.25095413758143 | 1.78327112189984 | 11.61678 |
| 2019-Q4 | -60.30491038218 | -0.110987467833756 | 4.01729414942372 | -0.290496989409947 | -58.77283 |
| 2020-Q1 | -49.8439323685677 | 0.586703810788609 | -3.28273687878985 | 6.06183393656893 | -45.92393 |
| 2020-Q2 | 2.46806241203127 | -0.216443029393959 | -5.87586216215344 | 11.3755372795161 | 9.85501 |
| 2020-Q3 | 16.119209454558 | 0.173129926803801 | -6.33482970661967 | 5.3759823452579 | 15.28692 |
| 2020-Q4 | 6.54088474197144 | -0.78152982552685 | -2.08353265556018 | 3.43920833911558 | 10.88957 |
| 2021-Q1 | 15.5323595323418 | 1.24306349311314 | -6.51103866699248 | 9.83881964153758 | 19.04027 |
| Table S1 Domestic Economy (€million) | |||||||
| ESA Code | Description | 2020Q1 | 2020Q2 | 2020Q3 | 2020Q4 | 2021Q1 | 2021Q1 versus 2020Q1 |
| B1GQ | Gross Domestic product | 93,183 | 84,562 | 100,960 | 94,164 | 101,164 | 7,981 |
| D2/D3 | minus taxes on production paid by domestic sectors plus subsidies received | -4,827 | -2,980 | -5,198 | -4,022 | -5,038 | -211 |
| D1_paid | minus Compensation of Employees paid by domestic enterprises | -26,443 | -23,284 | -24,552 | -26,905 | -25,682 | 761 |
| B2A3G | equals Gross operating surplus & mixed income | 61,913 | 58,297 | 71,210 | 63,237 | 70,444 | 8,531 |
| D1_rec | plus Compensation of Employees received by Irish Households | 26,392 | 23,208 | 24,475 | 26,815 | 25,592 | -800 |
| D2/D3(b) | plus taxes on production received by Government here minus subsidies paid | 5,115 | 3,128 | 5,550 | 4,336 | 5,303 | 188 |
| D4_net | plus net investment income from the rest of the world | -21,196 | -21,874 | -28,991 | -17,881 | -28,467 | -7,271 |
| B5G | equals Gross National Income | 72,224 | 62,759 | 72,244 | 76,507 | 72,872 | 648 |
| D5_D6_D7_D8 | plus net other transfers from rest of world | -1,042 | -956 | -734 | -1,080 | -1,278 | -237 |
| P3_S13 | minus final consumption expenditure of government | -10,299 | -11,678 | -12,393 | -12,785 | -11,298 | -999 |
| P3_S1M | minus final consumption expenditure of households | -24,553 | -20,185 | -23,696 | -24,984 | -21,644 | 2,909 |
| B8G | equals Gross Saving | 36,331 | 29,941 | 35,421 | 37,658 | 38,651 | 2,320 |
| D9_net | plus net capital transfers from RoW | -5 | 7 | 9 | 109 | -5 | 0 |
| P5 | minus capital investment | -82,255 | -20,086 | -20,134 | -26,769 | -19,611 | 62,644 |
| NP | minus non-produced asset investment | -3,841 | -7,092 | -1,307 | -3,406 | -173 | 3,667 |
| B9 | equals net lending (+) /borrowing (-) | -49,770 | 2,770 | 13,988 | 7,592 | 18,862 | 68,632 |
Government borrowing
At €6.8bn, government net borrowing (B.9) in the first quarter of 2021 was the biggest deficit since the arrival of the coronavirus. This deficit is 7% of GDP, and measures to deal with the COVID-19 pandemic have brought net borrowing over the 3% of GDP Maastricht threshold for four of the last five quarters. On the expenditure side, the government spent heavily on supporting household incomes, as mentioned above, through social transfers (D.62) such as the Pandemic Unemployment Payment, and through subsidies (D.3), such as the Employment Wage Subsidy Scheme. Government spending also increased on providing services such as health and education directly (P.3). On the income side, revenue from taxation was higher than in 2020Q1: receipts of taxes on income (D.5, such as PAYE and corporation tax) were up €0.4bn, but there was an even larger rise in the government's income of VAT-type (D.2) taxes of €1.3bn. This surprising increase was explained in the Department of Finance's Fiscal Monitor as follows: "The significant increase is driven by two factors. Firstly, in March 2020 the Revenue Commissioners introduced forbearance measures, as well as accelerated VAT repayments to help businesses overcome the initial impact of the pandemic. This lowers the base for today’s year-on-year comparisons. Secondly, as the Department’s high frequency economic data publication shows, the impact of the current period of restrictions on consumption has been much less severe than last year, as businesses and consumers adapt to the new environment." Even with this revenue, the net borrowing of the government was at its highest level since 2011.
| Government balance (B.9)/quarterly GDP | |
| 2017-Q1 | -1.68737664713878 |
| Q2 | -0.28949905731608 |
| Q3 | -2.57418096333357 |
| Q4 | 2.58760561239436 |
| 2018-Q1 | -2.22503086429432 |
| Q2 | -0.340052808779553 |
| Q3 | -1.98471280897629 |
| Q4 | 4.48839973825808 |
| 2019-Q1 | -2.47435878812743 |
| Q2 | 0.842680369822165 |
| Q3 | -1.30559706464668 |
| Q4 | 4.00430744274471 |
| 2020-Q1 | -3.87232489887843 |
| Q2 | -7.36536896856897 |
| Q3 | -6.59099327665032 |
| Q4 | -2.40975120192371 |
| 2021-Q1 | -6.7478258831636 |
| Table S13 General Government (€million) | |||||||
| ESA Code | Description | 2020Q1 | 2020Q2 | 2020Q3 | 2020Q4 | 2021Q1 | 2021Q1 versus 2020Q1 |
| B2A3G | Gross Operating Surplus (Depreciation and rental) | 1,262 | 1,262 | 1,262 | 1,262 | 1,262 | 0 |
| D2 | plus taxes on production received | 5,586 | 5,313 | 7,269 | 6,049 | 6,907 | 1,322 |
| D3 | minus subsidies paid | -471 | -2,185 | -1,719 | -1,713 | -1,604 | -1,133 |
| D4_rec | plus investment income received | 47 | 880 | 156 | 76 | 42 | -6 |
| D4_paid | minus Interest paid after FISIM | -1,040 | -950 | -977 | -872 | -828 | 213 |
| D5 | plus income and wealth taxes | 6,872 | 10,147 | 7,148 | 13,399 | 7,261 | 389 |
| D61 | plus PRSI, pension contributions received | 3,999 | 3,531 | 3,946 | 4,198 | 3,988 | -12 |
| D62 | minus Social protection, pensions paid | -6,156 | -8,980 | -7,642 | -8,616 | -8,856 | -2,700 |
| D7_net | plus net miscellaneous transfers | -932 | -1,080 | -706 | -959 | -1,257 | -325 |
| B6G | equals gross disposable income | 9,167 | 7,938 | 8,737 | 12,823 | 6,915 | -2,252 |
| P3 | minus final consumption expenditure | -10,299 | -11,678 | -12,393 | -12,785 | -11,298 | -999 |
| D1 | of which compensation of employees | -6,032 | -6,122 | -5,983 | -6,508 | -6,091 | -59 |
| B8G | equals gross saving | -1,131 | -3,739 | -3,656 | 39 | -4,383 | -3,252 |
| D9_net | plus net capital transfers | -326 | -352 | -319 | -186 | -315 | 10 |
| P5 | minus capital spending | -2,151 | -2,137 | -2,679 | -2,122 | -2,128 | 23 |
| NP | plus disposal of non-produced assets | 0 | 0 | 0 | 0 | 0 | 0 |
| B9 | equals net lending (+) /borrowing (-) | -3,608 | -6,228 | -6,654 | -2,269 | -6,826 | -3,218 |
Non-Financial Corporations (S.11)
The Gross Value Added (GVA, B.1g) of Non-Financial Corporations, which drives Ireland's GDP, was €7.6bn (11%) higher in the first quarter of 2021 compared to the equivalent quarter last year. GVA is made up of compensation of employees (D.1) and gross operating surplus (GOS, B.2A3G). The employee part was down slightly, even though it includes €1bn in extra subsidies from government. On the other hand, the operating surplus was up on last year's first quarter.
COVID-19 has different impacts across economic activity sectors: activities predominantly domestically-owned, such as retail and hospitality, have fared worse than foreign-dominated sectors, such as information technology. Figure 4 shows how foreign-controlled corporations (all Non-Financial Corporations) grew their GVA while the rest of the economy (domestic Non-Financial Corporations, and other producers) showed a decline in value added. The Quarterly National Accounts show gross value added by economic activity (NACE A10) with analysis of the multi-national dominated sectors.
As there was an increase in the operating surplus of foreign-controlled corporations, there was also an increase in their dividends and reinvested earnings paid to the rest of the world (D4 Uses). Fixed capital formation was lower than the extraordinary level of last year's first quarter (€78bn), at €14bn this quarter. This left the sector as a net lender in 2021-Q1.
| Foreign-owned MNE dominated | Other | Total | |
| Change compared to 2020Q1 | 10.17052468 | -2.934052155 | 7.23647252499998 |
| Table S11 Non-Financial Corporations (€million) | |||||||
| ESA Code | Description | 2020Q1 | 2020Q2 | 2020Q3 | 2020Q4 | 2021Q1 | 2021Q1 versus 2020Q1 |
| B1G | Gross value added | 68,096 | 59,996 | 75,681 | 67,643 | 75,679 | 7,583 |
| D1 | less compensation of employees | -17,095 | -14,243 | -15,491 | -17,023 | -16,344 | 752 |
| D2/D3 | plus subsidies less taxes on production | -405 | 1,525 | 1,081 | 1,015 | 985 | 1,390 |
| B2A3G | equals gross operating surplus | 50,596 | 47,278 | 61,271 | 51,635 | 60,321 | 9,725 |
| D4_rec | plus investment income received | 5,861 | 2,602 | 5,366 | 7,696 | 8,833 | 2,972 |
| D4_paid | minus investment income paid | -27,256 | -25,787 | -34,192 | -25,254 | -38,033 | -10,777 |
| D42_D43 | of which dividends and reinvested earnings paid | -23,028 | -21,480 | -29,996 | -21,250 | -34,041 | -11,013 |
| D5 | minus corporation tax etc | -697 | -4,009 | -1,256 | -3,588 | -571 | 126 |
| D7_net | plus net miscellaneous transfers | -214 | -113 | -167 | -215 | -234 | -20 |
| B8G | equals gross saving | 28,289 | 19,972 | 31,023 | 30,274 | 30,316 | 2,026 |
| D9_net | plus net capital transfers | 199 | 165 | 148 | 223 | 199 | -0 |
| P5 | minus capital investment expenditure | -78,133 | -17,504 | -14,903 | -23,733 | -14,783 | 63,350 |
| NP | minus expenditure on non-produced assets | -3,841 | -7,092 | -1,307 | -3,406 | -173 | 3,667 |
| B9 | equals net lending (+) /borrowing (-) | -53,485 | -4,459 | 14,960 | 3,358 | 15,559 | 69,044 |
Financial Corporations (S.12)
Financial corporations (S.12) showed a small decrease in property income (D.4) received (resources) and a larger decrease in property income paid (uses) in the first quarter of 2021 compared to the Q1 of 2020, leaving their net income higher. Most of the investment income of S.12 relates to transactions with the rest of the world. As the international investment position shows, the values of the underlying assets and liabilities increased since last year, but the income on them has decreased. Further details of are given in the International Accounts.
| Table S12 Financial Corporations (€million) | |||||||
| ESA Code | Description | 2020Q1 | 2020Q2 | 2020Q3 | 2020Q4 | 2021Q1 | 2021Q1 versus 2020Q1 |
| B1G | Gross value added | 3,687 | 3,444 | 3,736 | 3,833 | 3,722 | 35 |
| D1 | less compensation of employees | -2,202 | -1,939 | -2,044 | -2,240 | -2,156 | 45 |
| D2/D3 | plus subsidies less taxes on production | -97 | -226 | -66 | -215 | -80 | 17 |
| B2A3G | equals gross operating surplus | 1,389 | 1,279 | 1,625 | 1,378 | 1,486 | 97 |
| D4_rec | plus investment income received | 20,968 | 20,110 | 18,328 | 17,338 | 20,602 | -367 |
| D41_rec | of which interest rec. | 16,626 | 15,228 | 13,760 | 13,758 | 13,906 | -2,720 |
| D42_D43_rec | dividends and reinvested earnings rec. | 3,683 | 4,247 | 3,970 | 3,160 | 6,127 | 2,443 |
| D44_rec | other investment income rec. | 659 | 635 | 598 | 419 | 569 | -90 |
| D4_paid | minus investment income paid | -20,744 | -19,971 | -18,521 | -17,630 | -19,877 | 867 |
| D41_paid | of which interest paid | -6,602 | -6,138 | -5,900 | -5,798 | -5,814 | 788 |
| D42_D43_paid | dividends and reinvested earnings paid | -1,639 | -1,655 | -1,367 | -1,267 | -2,096 | -457 |
| D44_paid | other investment income paid | -12,503 | -12,178 | -11,255 | -10,565 | -11,967 | 536 |
| D5 | minus corporation tax etc | -176 | -1,019 | -319 | -909 | -145 | 32 |
| D61 | plus pension contributions received | 1,815 | 1,481 | 1,344 | 1,549 | 1,759 | -56 |
| D62 | minus pension benefits paid | -1,413 | -1,128 | -1,073 | -1,309 | -1,413 | -0 |
| D8 | minus adjustment for pension saving of households | -402 | -353 | -271 | -240 | -346 | 56 |
| D7_net | plus net miscellaneous transfers | 27 | 27 | 27 | 27 | 27 | 0 |
| B8G | equals gross saving | 1,464 | 427 | 1,139 | 203 | 2,093 | 629 |
| D9_net | plus net capital transfers | 0 | 17 | 79 | 0 | 0 | 0 |
| P5 | minus capital investment expenditure | -877 | -643 | -966 | -985 | -850 | 27 |
| B9 | equals net lending (+) /borrowing (-) | 587 | -199 | 252 | -782 | 1,243 | 656 |
Rest of the World Sector (S.2)
As noted in the discussion of the Domestic Economy, service imports (P.72) from the rest of the world (S.2) were down in the first three months of 2021 compared to the same period last year owing to the absence of large intellectual property imports. There was also an increase in exports compared to 2020-Q1. This left a large negative balance of goods and services (B.11) for the rest of the world (and so a positive balance for Ireland). Even after the large profit outflows of foreign-owned corporations, the current external balance (B.12, which is the equal and opposite of the current account balance in International Accounts) was negative for the rest of the world in the first quarter of 2020. As we follow the sequence of accounts on down to net lending, the rest of the world was a net borrower (B.9) in the quarter. Further details on transactions with the rest of the world are provided by institutional sector in the International Accounts, which include the financial account as well.
| Table S2 Rest of the World (€million) | |||||||
| ESA Code | Description | 2020Q1 | 2020Q2 | 2020Q3 | 2020Q4 | 2021Q1 | 2021Q1 versus 2020Q1 |
| P71 | Imports of goods | 24,872 | 22,756 | 23,454 | 28,774 | 25,164 | 292 |
| P72 | Imports of services | 117,336 | 57,021 | 50,975 | 80,636 | 57,259 | -60,077 |
| P61 | minus exports of goods | -62,528 | -57,033 | -61,349 | -63,899 | -68,821 | -6,293 |
| P62 | minus exports of services | -55,756 | -55,356 | -57,818 | -75,139 | -62,212 | -6,456 |
| B11 | equals balance of goods and services | 23,923 | -32,613 | -44,737 | -29,627 | -48,611 | -72,534 |
| D1_net | plus net compensation of employees to rest of world | 50 | 76 | 77 | 90 | 89 | 39 |
| D2/D3 | plus taxes on production received less subsidies paid by rest of world | -288 | -148 | -352 | -314 | -265 | 23 |
| D4_net | plus investment income to rest of world | 21,196 | 21,874 | 28,991 | 17,881 | 28,467 | 7,271 |
| D5_D6_D7_D8 | plus net other current transfers to rest of world | 1,042 | 956 | 734 | 1,080 | 1,278 | 237 |
| B12 | equals current external balance | 45,924 | -9,855 | -15,287 | -10,890 | -19,040 | -64,964 |
| D9_net | plus net capital transfers to rest of world | 5 | -7 | -9 | -109 | 5 | -0 |
| NP | plus non-produced assets disposal by rest of world | 3,841 | 7,092 | 1,307 | 3,406 | 173 | -3,667 |
| B9 | equals net lending (+) /borrowing (-) | 49,770 | -2,770 | -13,988 | -7,592 | -18,862 | -68,632 |
| Table 1 Quarterly Accounts by Institutional Sector, Summary 2021Q1 (€million) | |||||||
| S2 Rest of World | S1 Total Economy | S1N Not Sectorised | S11 Non-Financial Corporations | S12 Financial Corporations | S13 General Government | S14+S15 Households incl. NPISH | |
| (a) B1G Gross Domestic Product/Gross Value Added | |||||||
| 2020Q1 | 93,183 | 4,767 | 68,096 | 3,687 | 7,293 | 9,340 | |
| 2020Q2 | 84,562 | 5,545 | 59,996 | 3,444 | 7,384 | 8,193 | |
| 2020Q3 | 100,960 | 6,375 | 75,681 | 3,736 | 7,245 | 7,923 | |
| 2020Q4 | 94,164 | 6,917 | 67,643 | 3,833 | 7,769 | 8,001 | |
| 2020 | 372,868 | 23,605 | 271,417 | 14,699 | 29,691 | 33,457 | |
| 2021Q1 | 101,164 | 5,512 | 75,679 | 3,722 | 7,352 | 8,899 | |
| (b) B2A3G Gross Operating Surplus and Gross Mixed income | |||||||
| 2020Q1 | 61,913 | 277 | 50,596 | 1,389 | 1,262 | 8,390 | |
| 2020Q2 | 58,297 | 1,052 | 47,278 | 1,279 | 1,262 | 7,426 | |
| 2020Q3 | 71,210 | -23 | 61,271 | 1,625 | 1,262 | 7,075 | |
| 2020Q4 | 63,237 | 1,887 | 51,635 | 1,378 | 1,262 | 7,076 | |
| 2020 | 254,658 | 3,193 | 210,781 | 5,671 | 5,046 | 29,967 | |
| 2021Q1 | 70,444 | -531 | 60,321 | 1,486 | 1,262 | 7,907 | |
| (c) D1_D4 Net Primary Income | |||||||
| 2020Q1 | 10,311 | -21,395 | 224 | 4,122 | 27,360 | ||
| 2020Q2 | 4,462 | -23,185 | 139 | 3,058 | 24,450 | ||
| 2020Q3 | 1,034 | -28,825 | -194 | 4,730 | 25,324 | ||
| 2020Q4 | 13,270 | -17,558 | -293 | 3,540 | 27,581 | ||
| 2020 | 29,077 | -90,964 | -124 | 15,449 | 104,716 | ||
| 2021Q1 | 2,428 | -29,200 | 725 | 4,517 | 26,387 | ||
| (d) B5G Gross National Income = (b + c) | |||||||
| 2020Q1 | 72,224 | 277 | 29,200 | 1,613 | 5,384 | 35,751 | |
| 2020Q2 | 62,759 | 1,052 | 24,093 | 1,418 | 4,319 | 31,877 | |
| 2020Q3 | 72,244 | -23 | 32,446 | 1,431 | 5,991 | 32,399 | |
| 2020Q4 | 76,507 | 1,887 | 34,077 | 1,085 | 4,802 | 34,657 | |
| 2020 | 283,735 | 3,193 | 119,816 | 5,547 | 20,496 | 134,683 | |
| 2021Q1 | 72,872 | -531 | 31,120 | 2,210 | 5,779 | 34,294 | |
| (e) D5_D7 Net Current Transfers | |||||||
| 2020Q1 | -1,042 | -911 | 253 | 3,784 | -4,167 | ||
| 2020Q2 | -956 | -4,121 | -639 | 3,619 | 185 | ||
| 2020Q3 | -734 | -1,423 | -21 | 2,746 | -2,035 | ||
| 2020Q4 | -1,080 | -3,803 | -642 | 8,022 | -4,657 | ||
| 2020 | -3,812 | -10,259 | -1,049 | 18,170 | -10,674 | ||
| 2021Q1 | -1,278 | -805 | 228 | 1,136 | -1,838 | ||
| (f) B6G Gross Disposable Income = (d + e) | |||||||
| 2020Q1 | 71,183 | 277 | 28,289 | 1,865 | 9,167 | 31,584 | |
| 2020Q2 | 61,804 | 1,052 | 19,972 | 780 | 7,938 | 32,062 | |
| 2020Q3 | 71,510 | -23 | 31,023 | 1,410 | 8,737 | 30,364 | |
| 2020Q4 | 75,427 | 1,887 | 30,274 | 443 | 12,823 | 30,000 | |
| 2020 | 279,923 | 3,193 | 109,558 | 4,498 | 38,666 | 124,009 | |
| 2021Q1 | 71,593 | -531 | 30,316 | 2,438 | 6,915 | 32,456 | |
| (g) P3_D8 Use of Disposable Income | |||||||
| 2020Q1 | -34,852 | 0 | -402 | -10,299 | -24,151 | ||
| 2020Q2 | -31,863 | 0 | -353 | -11,678 | -19,832 | ||
| 2020Q3 | -36,089 | 0 | -271 | -12,393 | -23,426 | ||
| 2020Q4 | -37,768 | 0 | -240 | -12,785 | -24,744 | ||
| 2020 | -140,572 | 0 | -1,266 | -47,154 | -92,153 | ||
| 2021Q1 | -32,942 | 0 | -346 | -11,298 | -21,299 | ||
| (h) B8G Gross Saving = f + g | |||||||
| 2020Q1 | 36,331 | 277 | 28,289 | 1,464 | -1,131 | 7,432 | |
| 2020Q2 | 29,941 | 1,052 | 19,972 | 427 | -3,739 | 12,230 | |
| 2020Q3 | 35,421 | -23 | 31,023 | 1,139 | -3,656 | 6,939 | |
| 2020Q4 | 37,658 | 1,887 | 30,274 | 203 | 39 | 5,256 | |
| 2020 | 139,351 | 3,193 | 109,558 | 3,232 | -8,488 | 31,856 | |
| 2021Q1 | 38,651 | -531 | 30,316 | 2,093 | -4,383 | 11,157 | |
| (i) D9_NP_P5 Changes in Capital Account | |||||||
| 2020Q1 | -60,750 | 277 | -59,692 | -386 | -1,215 | 267 | |
| 2020Q2 | -1,720 | 1,052 | -2,256 | -133 | -1,227 | 845 | |
| 2020Q3 | 4,171 | -23 | 6,252 | -392 | -1,737 | 71 | |
| 2020Q4 | -3,852 | 1,887 | -4,042 | -476 | -1,046 | -175 | |
| 2020 | -62,151 | 3,193 | -59,738 | -1,388 | -5,226 | 1,007 | |
| 2021Q1 | 6,988 | -531 | 8,644 | -272 | -1,182 | 330 | |
| (j) P51C Consumption of Fixed Capital | |||||||
| 2020Q1 | 25,350 | 22,082 | 491 | 1,262 | 1,516 | ||
| 2020Q2 | 25,451 | 22,175 | 493 | 1,262 | 1,522 | ||
| 2020Q3 | 25,603 | 22,314 | 496 | 1,262 | 1,532 | ||
| 2020Q4 | 26,214 | 22,874 | 508 | 1,262 | 1,570 | ||
| 2020 | 102,619 | 89,445 | 1,987 | 5,046 | 6,140 | ||
| 2021Q1 | 26,777 | 23,400 | 578 | 1,262 | 1,537 | ||
| (k) B9 Net Lending (+)/Net Borrowing (-) = (h + i) - j | |||||||
| 2020Q1 | 49,770 | -49,770 | 554 | -53,485 | 587 | -3,608 | 6,183 |
| 2020Q2 | -2,770 | 2,770 | 2,104 | -4,459 | -199 | -6,228 | 11,552 |
| 2020Q3 | -13,988 | 13,988 | -47 | 14,960 | 252 | -6,654 | 5,478 |
| 2020Q4 | -7,592 | 7,592 | 3,775 | 3,358 | -782 | -2,269 | 3,510 |
| 2020 | 25,419 | -25,419 | 6,386 | -39,625 | -142 | -18,760 | 26,723 |
| 2021Q1 | -18,862 | 18,862 | -1,063 | 15,559 | 1,243 | -6,826 | 9,950 |
| Table 1.2 Generation of Income Account (€million) | ||||||||
| Resources (Received) | S2 Rest of World | S1 Total Economy | S1N Not Sectorised | S11 Non-Financial Corporations | S12 Financial Corporations | S13 General Government | S14+S15 Households incl. NPISH | |
| B1G | Gross Domestic Product/Gross Value Added | 101,164 | 5,512 | 75,679 | 3,722 | 7,352 | 8,899 | |
| D3 | Subsidies | 1,980 | 243 | 1,381 | 0 | 0 | 357 | |
| Uses (Paid) | ||||||||
| D1 | Compensation of Employees | 38 | 25,682 | 16,344 | 2,156 | 6,091 | 1,091 | |
| D2 | Taxes on Production and Imports | 7,018 | 6,286 | 396 | 80 | 0 | 258 | |
| B2A3G | Gross Operating Surplus and Gross Mixed income | 70,444 | -531 | 60,321 | 1,486 | 1,262 | 7,907 | |
| Table 1.3 Allocation of Primary Income Account (€million) | ||||||||
| Resources (Received) | S2 Rest of World | S1 Total Economy | S1N Not Sectorised | S11 Non-Financial Corporations | S12 Financial Corporations | S13 General Government | S14+S15 Households incl. NPISH | |
| B2A3G | Gross Operating Surplus and Gross Mixed income | 70,444 | -531 | 60,321 | 1,486 | 1,262 | 7,907 | |
| D1 | Compensation of Employees | 127 | 25,592 | 25,592 | ||||
| D2 | Taxes on Production and Imports | 111 | 6,907 | 6,907 | ||||
| D4 | Property Income | 57,149 | 30,628 | 8,833 | 20,602 | 42 | 1,152 | |
| D41 | Interest | 9,859 | 14,968 | 762 | 13,906 | 13 | 287 | |
| D42 | Distributed Income of Corporations | 32,386 | 6,815 | 1,796 | 4,510 | 11 | 498 | |
| D43 | Reinvested Earnings on Direct Foreign Investment | 3,241 | 7,885 | 6,268 | 1,616 | 0 | 0 | |
| D44 | Property Income attributed to Insurance Policy Holders | 11,663 | 874 | 7 | 569 | 0 | 297 | |
| D45 | Rents | 87 | 0 | 0 | 17 | 70 | ||
| Uses (Paid) | ||||||||
| D3 | Subsidies | 376 | 1,604 | 1,604 | ||||
| D4 | Property Income | 28,681 | 59,096 | 38,033 | 19,877 | 828 | 357 | |
| D41 | Interest | 13,923 | 10,904 | 3,975 | 5,814 | 828 | 288 | |
| D42 | Distributed Income of Corporations | 6,305 | 32,896 | 32,759 | 138 | |||
| D43 | Reinvested Earnings on Direct Foreign Investment | 7,885 | 3,241 | 1,283 | 1,958 | |||
| D44 | Property Income attributed to Insurance Policy Holders | 569 | 11,967 | 0 | 11,967 | 0 | ||
| D45 | Rents | 87 | 17 | 0 | 0 | 70 | ||
| B5G | Gross National Income | 72,872 | -531 | 31,120 | 2,210 | 5,779 | 34,294 | |
| Table 1.5 Secondary Distribution of Income Account (€million) | ||||||||
| Resources (Received) | S2 Rest of World | S1 Total Economy | S1N Not Sectorised | S11 Non-Financial Corporations | S12 Financial Corporations | S13 General Government | S14+S15 Households incl. NPISH | |
| B5G | Gross National Income | 72,872 | -531 | 31,120 | 2,210 | 5,779 | 34,294 | |
| D5 | Current Taxes on Income, Wealth, etc | 6 | 7,261 | 7,261 | ||||
| D61 | Social Contributions | 0 | 5,747 | 0 | 1,759 | 3,988 | 0 | |
| D62 | Social Benefits other than Social Transfers in kind | 81 | 10,414 | 10,414 | ||||
| D7 | Other Current Transfers | 2,446 | 4,141 | 201 | 2,361 | 185 | 1,394 | |
| Uses (Paid) | ||||||||
| D5 | Current Taxes on Income, Wealth, etc | 2 | 7,266 | 571 | 145 | 0 | 6,550 | |
| D61 | Social Contributions | 0 | 5,747 | 5,747 | ||||
| D62 | Social Benefits other than Social Transfers in kind | 226 | 10,269 | 0 | 1,413 | 8,856 | 0 | |
| D7 | Other Current Transfers | 1,027 | 5,560 | 435 | 2,334 | 1,442 | 1,349 | |
| B6G | Gross Disposable Income | 71,593 | -531 | 30,316 | 2,438 | 6,915 | 32,456 | |
| Table 1.6 Secondary Distribution of Income Account (€million) | ||||||||
| Resources (Received) | S2 Rest of World | S1 Total Economy | S1N Not Sectorised | S11 Non-Financial Corporations | S12 Financial Corporations | S13 General Government | S14+S15 Households incl. NPISH | |
| B6G | Gross Disposable Income | 71,593 | -531 | 30,316 | 2,438 | 6,915 | 32,456 | |
| D8 | Adjustment for the Change in Pension Entitlements | 0 | 346 | 346 | ||||
| Uses (Paid) | ||||||||
| P3 | Final Consumption Expenditure | 32,942 | 11,298 | 21,644 | ||||
| D8 | Adjustment for the Change in Pension Entitlements | 0 | 346 | 0 | 346 | 0 | 0 | |
| B8G | Gross Saving | 38,651 | -531 | 30,316 | 2,093 | -4,383 | 11,157 | |
| Table 1.7 External Account (€million) | |||
| Resources (Received) | S2 Rest of World | S1 Total Economy | |
| P7 | Imports of Goods and Services | 82,422 | |
| D1_D8 | Primary Incomes and Current Transfers | 59,920 | 93,016 |
| Uses (Paid) | |||
| P6 | Exports of Goods and Services | 131,033 | |
| B11 | External Balance of Goods & Services | -48,611 | |
| D1_D8 | Primary Incomes and Current Transfers | 30,349 | 122,587 |
| B12 | Current External Balance | -19,040 | |
| Table 1.8 Change in Net Worth due to Saving and Capital Transfers Account (€million) | ||||||||
| Liabilities | S2 Rest of World | S1 Total Economy | S1N Not Sectorised | S11 Non-Financial Corporations | S12 Financial Corporations | S13 General Government | S14+S15 Households incl. NPISH | |
| B8G | Gross Saving | 38,651 | -531 | 30,316 | 2,093 | -4,383 | 11,157 | |
| B12 | Current External Balance | -19,040 | ||||||
| D9 | Capital Transfers | 5 | 637 | 304 | 0 | 161 | 172 | |
| Assets | ||||||||
| D9 | Capital Transfers | 0 | 642 | 105 | 0 | 476 | 61 | |
| P51C | Consumption of Fixed Capital | 26,777 | 23,400 | 578 | 1,262 | 1,537 | ||
| B101 | Changes in Net Worth due to Saving and Capital Transfers | -19,035 | 11,869 | -531 | 7,114 | 1,515 | -5,960 | 9,731 |
| Table 1.9 Secondary Distribution of Income Account (€million) | ||||||||
| Liabilities | S2 Rest of World | S1 Total Economy | S1N Not Sectorised | S11 Non-Financial Corporations | S12 Financial Corporations | S13 General Government | S14+S15 Households incl. NPISH | |
| B101 | Changes in Net Worth due to Saving and Capital Transfers | -19,035 | 11,869 | -531 | 7,114 | 1,515 | -5,960 | 9,731 |
| P51C | Consumption of Fixed Capital | 26,777 | 23,400 | 578 | 1,262 | 1,537 | ||
| Assets | ||||||||
| P5 | Gross Capital Formation | 19,611 | 531 | 14,783 | 850 | 2,128 | 1,319 | |
| NP | Acquisitions less Disposals of Non-Produced Assets | -173 | 173 | 173 | 0 | 0 | 0 | |
| B9 | Net Lending (+)/Net Borrowing (-) | -18,862 | 18,862 | -1,063 | 15,559 | 1,243 | -6,826 | 9,950 |
All quarters have been revised in line with the Quarterly National Accounts, Government Finance Statistics and International Accounts (Balance of Payments).
Seasonally adjusting the Accounts will be challenging until the full scale and shape of the impact COVID-19 has on the time series is better understood. Users should be aware that as further data observations become available in the months and quarters ahead, revisions to the seasonal adjustment models may result in revisions to the quarterly seasonally adjusted series.
Description of Institutional Sectors
In the Sector Accounts, Institutional Sectors are distinguished not in terms of the nature of their production activity (such as agriculture, industry, services, etc.) but rather in terms primarily of the institutional form of the units that make them up. Thus, companies, whether engaged in commercial non-financial or financial business, are grouped in a different sector from households, even though the latter are in many cases also engaged in commercial production, and from government or other non-market producers such as voluntary agencies.
The classification system is that of the European System of Accounts 2010 (ESA2010). The sectors and sub-sectors distinguished in the present publication are as follows:
S.1 Resident Economy is the sum of all the sectors of the domestic economy.
S.11 Non-Financial Corporations are companies producing goods and non-financial services on a commercial basis. They include government-controlled companies, private companies and other corporate forms of business, whether owned by residents or non-residents or both. In particular, therefore, Irish subsidiaries of foreign companies and the Irish branches of foreign companies operating in Ireland on a branch basis are included. The foreign subsidiaries of Irish companies and the foreign branches of Irish companies operating abroad are excluded. Large partnerships such as big law and accounting firms, are included in S.11, even though they are not incorporated they are quasi-corporations. Entities which operate as holding companies for non-financial corporations are classified in the financial sector and not here.
S.12 Financial Corporations are corporate bodies producing financial services on a commercial basis. As with S.11, they can take various legal forms, with a range of ownership arrangements. They include banks, insurance corporations and pension funds.
S.13 General Government consists of central and local government. Central government includes the Ireland Strategic Investment Fund (formerly the NPRF), and non-commercial agencies owned and funded by government, but does not include commercial state-owned companies (which are proper to S.11 or S.12 as appropriate). The Register of Public Sector Bodies sets out which bodies are included here.
S.1M: S.14 + S.15 Households and Non-Profit Institutions Serving Households. S.14 accounts are the economic transactions of people in their capacity as consumers, employees, self-employed workers, pensioners and recipients of other income and transfers. S.15 consists of non-profit institutions such as charities and non-commercial agencies not owned by the government, such as sports clubs and churches.
S.2 Rest of World. This sector represents the economy's transactions with non-residents. The conceptual definition is the same as in the Balance of Payments (BOP) statistics. In particular, non-residents include foreign subsidiaries of Irish companies, the foreign branches of Irish companies that operate abroad on a branch basis, and the head offices of foreign companies that operate in Ireland on a branch basis.
S.1N Not Sectorised. In the non-financial accounts an additional residual sector is used to report taxes and subsidies on products (D.21, D.31) in the Generation of Income Account (Account 1.2) as it is not possible to allocate these amounts to Institutional Sectors. In addition, throughout these accounts S.1N is used to report the amounts that appear as the statistical discrepancy in the National Income and Expenditure GDP accounts, arising from the use of two independent estimates of GDP (from the Income and Expenditure approaches). In the Annual National Accounts NIE tables 3 and 5, the official estimate of GDP is reported as the average of the two measures, and the discrepancy is therefore displayed as half the difference between the two independent estimates (and thus with different signs in the two tables). The discrepancy is projected forward on a quarterly basis in line with the trends in the Expenditure components and is presented in Table 2 of the Quarterly National Accounts. In the Quarterly Sector Accounts it appears in Gross Domestic Product, the opening item in the Generation of Income Account and is then carried through successive accounts via the balancing item.
Sector Accounts present a coherent overview of all economic processes and the roles played by the various sectors. Each economic process is described in a separate account. The accounts describe successively: generation of income, primary and secondary income distribution, final consumption, redistribution by means of capital transfers, and capital formation. Note that the Production Account (1.1) from the Annual Accounts is not included in these quarterly accounts as the data is not available on a quarterly basis. The accounts record economic transactions, distinguishing between uses and resources (e.g. the resources side of the transaction category Interest (D.41) records the amounts of interest receivable by the different sectors of the economy and the uses side shows interest payable) with a special item to balance the two sides of each account. By passing on the balancing item from one account to the next a connection is created between successive accounts.
The accounts are compiled for the total economy and include accounts for separate domestic sectors and the Rest of World sector. In this way the sector accounts describe:
The successive accounts are explained in more detail below.
This account is not presented in the Quarterly Non-Financial Accounts as quarterly data is not available.
This account displays the transactions through which Gross Domestic Product at market prices is distributed to labour (compensation of employees), capital (operating surplus) and government (the balance of taxes and subsidies on production). The balancing item for the Household and NPISH sector in this account is called mixed income, because apart from operating surplus it also contains compensation for work by self-employed persons and their family members. Gross Operating Surplus/Gross Mixed Income (B.2g/B.3g) is the balancing item for the entire account.
This account records, as resources, the income from direct participation in the production process, as well as property income received in exchange for the use of land, financial resources and other intangible assets. In addition, this account records the taxes on production and imports received by the government. On the uses side, property income (including interest, dividends, reinvested earnings and land rent) is recorded as well as the subsidies paid by the government.
On this account the interest paid and received are recorded excluding imputed bank services (financial intermediation services indirectly measured - FISIM). In the national accounts insurance technical reserves are seen as a liability of insurance enterprises and pension funds to policyholders. Therefore, the receipts from investing these reserves are recorded as payments from insurance enterprises and pension funds to households, under Other Investment Income (D.44). The balancing item of this account for each sector is Gross National Income (B.5g). The Primary Income for the total economy is the National Income.
This account is not presented in the Quarterly series.
The Secondary Distribution of Income Account shows how primary income is redistributed by means of current taxes on income and wealth, social contributions (including contributions to pension schemes), social benefits (including pension benefits) and other current transfers. The balancing item of this account is Gross Disposable Income (B.6g). For the consuming sectors (Households, NPISH and General Government) this item is passed on to Use of Disposable Income Account (1.6). For the other sectors the disposable income is generally equal to saving. This is then passed on to the Change in Net Worth due to Saving and Capital Transfers Account (1.8).
This account shows the element of disposable income that is spent on final consumption and also the element that is saved. As mentioned above, final consumption only exists for Households, NPISH and General Government. The net equity of Households in pension funds is seen as a financial asset that belongs to Households. Changes in these reserves need to be included in the saving of Households. However, contributions to pension schemes and pension benefits have already been recorded on the Secondary Distribution of Income Account (1.5) as social contributions and social benefits. Therefore, an adjustment is needed in the saving of Households to include the change in pension funds reserves on which they have a definite claim. This adjustment is called Adjustment for the Change in Pension Entitlements (D.8). There is no need for a similar adjustment concerning life insurance because life insurance premiums and benefits are not recorded as current transactions. The balancing item for this account is Gross Saving (B.8g).
This account records the summarised transactions of the Rest of World Sector (S.2), including on the uses side exports of goods and services, primary incomes and current transfers receivable. The resources side of this account includes imports of goods and services together with primary incomes and transfers payable. The balancing item is Current External Balance (B.12), which records the balance on current accounts with the Rest of World.
On this account the capital transfers are recorded and combined with gross saving and the current external balance. The resulting balancing item is Changes in Net Worth due to Saving and Capital Transfers (B.10.1).
On this account, Gross Fixed Capital Formation (P.51), Changes in Inventories (P.52) and Acquisitions less Disposals of Valuables and Non-Produced Non-Financial Assets (N.P.) are recorded among the uses. The decline in the value of fixed capital goods caused by consumption of fixed capital goods is recorded among the resources (P.51c). The balancing item is B.9, Net Lending (shown as a positive number) or Borrowing (shown as a negative). It shows the amount a sector can invest, or has to borrow, as a result of its current and capital transactions.
Seasonal adjustment is conducted using the direct seasonal adjustment approach. Under this approach, each individual time series is independently adjusted, i.e. aggregate series are adjusted without reference to the component series.
As part of the seasonal adjustment process, ARIMA models are identified for each series based on unadjusted data spanning Q1 1999 to the first quarter of this year. These models are then applied to the entire series in the next three quarters. Seasonal factors and the parameters of the ARIMA models are updated each quarter.
The adjustments are completed by applying the X-13-ARIMA model, developed by the U.S. Census Bureau to the unadjusted data. This methodology estimates seasonal factors while also taking into consideration factors that impact on the quality of the seasonal adjustment such as, for example:
For additional information on the use of X-13-ARIMA, see https://www.census.gov/srd/www/x13as/.
Seasonally adjusted estimates of Household Saving are compiled using the indirect seasonal adjustment approach. Under this approach the two main aggregates, Household Disposable Income (B.6g + D.8) and Final Consumption Expenditure of Households (P.3), are independently adjusted. The derived saving is the difference between the two adjusted series of Household Disposable Income and Final Expenditure of Households. This method for estimating the seasonally adjusted value for a small net residual of two large aggregates, such as Household Saving, is considered to be a more appropriate estimation procedure.
The use of these saving either for financial investment or debt reduction is not recorded in these accounts but is recorded in the financial account (see Quarterly Financial Accounts published by the Central Bank of Ireland and Institutional Sector Accounts Non-Financial and Financial 2019 for annual integrated financial and non financial accounts).
 Hide Background Notes
Scan the QR code below to view this release online or go to
http://www.cso.ie/en/releasesandpublications/er/isanf/institutionalsectoraccountsnon-financialquarter12021/
 Show Table S.1M Households and Non-Profits
 Hide Table S.1M Households and Non-Profits