
This release has been compiled during the COVID-19 crisis. The results contained in this release reflect some of the economic impacts of the COVID-19 situation. For further information see our Information Note.
| Seasonally Adjusted Gross Household Saving by Component | €million | ||
| Gross Disposable Income (B.6g + D.8) | Final Consumption Expenditure (P.3) | Gross Saving Ratio | |
| Q4 2019 | 30,193 | 26,134 | 13.4% |
| Q1 2020 | 30,604 | 25,579 | 16.4% |
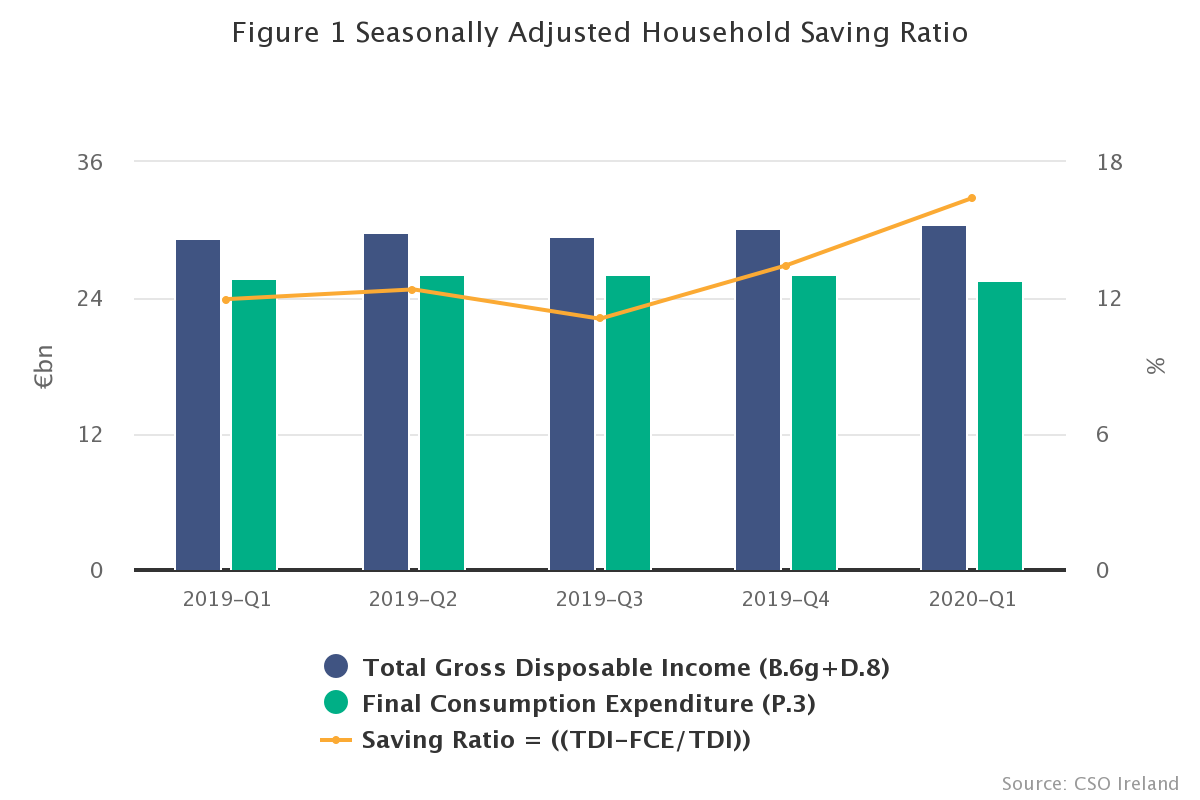
Household saving increased in the first quarter of 2020, as employee pay went up, while consumer spending decreased. The derived saving ratio, which shows the relationship between saving and income, reached 16.4%, its highest since 2009.
|
| Table S.1M Households and Non-Profits | €million | ||||||
| ESA Code | Description | 2019-Q1 | 2019-Q2 | 2019-Q3 | 2019-Q4 | 2020-Q1 | 2020-Q1 versus 2019-Q1 |
| B.2A3G | Self-employment and rent | 7,247 | 7,686 | 8,033 | 8,548 | 7,120 | - 127 |
| D.1 | Paid employment | 24,716 | 24,992 | 24,662 | 25,848 | 26,225 | 1,509 |
| D.4 | Investment income received | 1,304 | 1,650 | 1,215 | 1,626 | 1,604 | 300 |
| D.4 | minus Interest paid after FISIM | - 483 | - 472 | - 596 | - 721 | - 726 | - 243 |
| D.5 | minus PAYE, income tax etc | - 5,710 | - 5,709 | - 5,573 | - 8,721 | - 5,990 | - 280 |
| D.61 | minus PRSI, pension contributions etc | - 5,609 | - 5,469 | - 5,346 | - 5,871 | - 5,613 | - 4 |
| D.62 | plus Social protection, pensions received | 7,189 | 7,037 | 7,072 | 7,875 | 7,497 | 309 |
| D.7 | plus net miscellaneous transfers | - 3 | 73 | 102 | 229 | 53 | 56 |
| B.6g | equals gross disposable income | 28,651 | 29,790 | 29,569 | 28,813 | 30,172 | 1,521 |
| D.8 | plus adjustment for pension fund value | 577 | 459 | 313 | 438 | 413 | - 164 |
| P.3 | minus consumer spending | - 25,717 | - 25,382 | - 25,552 | - 27,503 | - 25,509 | 208 |
| B.8G | equals gross saving | 3,511 | 4,866 | 4,331 | 1,748 | 5,076 | 1,566 |
| D.9 | plus net capital transfers | 122 | 168 | 60 | 95 | 131 | 9 |
| P.5 | minus capital spending | - 1,635 | - 1,660 | - 2,041 | - 1,913 | - 1,770 | - 135 |
| B.9 | equals net lending (+) /borrowing (-) | 1,997 | 3,374 | 2,350 | - 70 | 3,437 | 1,440 |
Growth in Domestic Economy
The economy as a whole grew in the first quarter of 2020 as COVID-19 restrictions only affected the last weeks of the period. Both company profits and earnings of employees went up. There were large imports of intellectual property as the 'on-shoring' of these assets by foreign multi-nationals continued. Consumer spending declined slightly and VAT receipts of government were significantly down. Total saving (B.8g) in the economy was up, as this increased for all sectors except Government. The infographic illustrates some of these significant changes in the quarter.
The gross saving of the total domestic economy is either spent on fixed capital investment in Ireland (P.5) or invested in the rest of the world (the current account (CA) balance, the negative of B.12 of S.2). So saving equals investment plus the CA balance. Figure 2 illustrates the trends in, and relationships between these three important indicators. Saving is generally increasing over the last five years in Ireland. There has been a starkly negative CA balance in some quarters, which has been due to large capital investments (imports of intellectual property (IP)). The negative CA balance has been accompanied by higher fixed capital investment in those exceptional quarters. Such large investments cannot be funded out of saving in the domestic economy and this results ultimately in increased net borrowing from abroad.
| Current Account Balance -B12 | Investment P5 | Saving B8g | |
| 2016-Q1 | 0.705620917553198 | 19.93630211 | 21.7638939175532 |
| 2016-Q2 | -4.55505188676505 | 24.71401231 | 20.9902421132349 |
| 2016-Q3 | -1.22378000000001 | 23.28027201 | 22.279209 |
| 2016-Q4 | -6.29923 | 33.90223761 | 26.487925 |
| 2017-Q1 | 5.99448 | 14.757379702 | 22.6496 |
| 2017-Q2 | -31.7590036149228 | 55.153005702 | 21.4614293850772 |
| 2017-Q3 | 14.39533 | 17.442402702 | 30.90943 |
| 2017-Q4 | 12.82749 | 16.412955802 | 30.47202 |
| 2018-Q1 | 11.16324530725 | 17.87046605 | 28.5981166145 |
| 2018-Q2 | 10.79543530725 | 16.82525265 | 27.2463716145 |
| 2018-Q3 | 11.01572530725 | 19.69431676 | 32.6621776145 |
| 2018-Q4 | -13.35731469275 | 39.71045705 | 27.4567086145 |
| 2019-Q1 | 9.15192 | 19.27557069 | 28.642006 |
| 2019-Q2 | -32.60324 | 60.49669169 | 27.472059 |
| 2019-Q3 | 11.60844 | 22.99296969 | 35.392056 |
| 2019-Q4 | -28.56431 | 61.08232469 | 33.887461 |
| 2020-Q1 | -14.55686 | 47.04033689 | 34.52131 |
| Table S.1 Domestic economy | €million | ||||||
| ESA Code | Description | 2019-Q1 | 2019-Q2 | 2019-Q3 | 2019-Q4 | 2020-Q1 | 2020-Q1 versus 2019-Q1 |
| B.1*g | Gross Domestic product | 84,929 | 84,931 | 93,225 | 92,966 | 90,753 | 5,825 |
| D.2/D.3 | minus taxes on production paid by domestic sectors plus subsidies received | - 6,651 | - 5,146 | - 6,994 | - 5,768 | - 4,694 | 1,957 |
| D.1 | minus Compensation of Employees paid by domestic enterprises | - 24,744 | - 25,028 | - 24,702 | - 25,893 | - 26,274 | - 1,530 |
| B.2A3g | equals Gross operating surplus & mixed income | 53,533 | 54,757 | 61,528 | 61,306 | 59,786 | 6,252 |
| D.1 | plus Compensation of Employees received by Irish Households | 24,716 | 24,992 | 24,662 | 25,848 | 26,225 | 1,509 |
| D.2/D.3 | plus taxes on production received by Government here minus subsidies paid | 6,948 | 5,331 | 7,310 | 6,103 | 4,992 | - 1,956 |
| D.4 | plus net investment income from the rest of the world | - 19,894 | - 21,222 | - 20,349 | - 20,108 | - 19,965 | - 72 |
| B.5g | equals Gross National Income | 65,304 | 63,859 | 73,151 | 73,149 | 71,038 | 5,734 |
| D.5, D.6, D.7, D.8 | plus net other transfers from rest of world | - 1,367 | - 699 | - 917 | - 626 | - 1,094 | 273 |
| P.3 | minus final consumption expenditure of households | - 25,717 | - 25,382 | - 25,552 | - 27,503 | - 25,509 | 208 |
| P.3 | minus final consuption expenditure of government | - 9,578 | - 10,306 | - 11,290 | - 11,132 | - 9,914 | - 336 |
| B.8g | equals Gross Saving | 28,642 | 27,472 | 35,392 | 33,887 | 34,521 | 5,879 |
| D.9 RoW | plus net capital transfers from RoW | - 5 | - 1 | 10 | 2 | - 5 | - 0 |
| P.5 | minus capital investment | - 19,490 | - 60,075 | - 23,784 | - 62,452 | - 49,078 | - 29,588 |
| NP | minus non-produced asset investment | - 6,766 | - 17,301 | - 5,151 | - 5,927 | - 4,816 | 1,951 |
| B.9 | equals net lending (+) /borrowing (-) | 2,381 | - 49,905 | 6,467 | - 34,490 | - 19,377 | - 21,758 |
Negative Government Saving
The government had increased net borrowing (B.9) in the quarter and its gross saving (before capital investment) went from positive to negative. This was in part due to higher spending: final consumption (P.3) and social transfers such as unemployment payments (D.62) were up. There were 283,129 people receiving the new Pandemic Unemployment Payment at the end of the quarter (see the Live Register July 2020). The change in government saving was also owing to reduced income: taxes on products (for instance, VAT) were sharply down compared to the first quarter of last year. Further information on the non-financial accounts and also the financial accounts of the Goverment sector can be found in the Quarterly Government Finance Statistics.
| Government balance (B.9)/quarterly GDP | |
| 2017-Q1 | -1.3670053176676 |
| 2017-Q2 | -0.131921243293256 |
| 2017-Q3 | -2.58144955525217 |
| 2017-Q4 | 2.63959417338 |
| 2018-Q1 | -1.81660234791299 |
| 2018-Q2 | -0.552238728645387 |
| 2018-Q3 | -1.91879563136079 |
| 2018-Q4 | 4.69128492867935 |
| 2019-Q1 | -2.16393420730191 |
| 2019-Q2 | 0.988990019872304 |
| 2019-Q3 | -1.36171009367384 |
| 2019-Q4 | 3.96703157138007 |
| 2020-Q1 | -3.61095308012276 |
| Table S.13 General Government | €million | ||||||
| ESA Code | Description | 2019-Q1 | 2019-Q2 | 2019-Q3 | 2019-Q4 | 2020-Q1 | 2020-Q1 versus 2019-Q1 |
| B.2A3g | Gross Operating Surplus (Depreciation and rental) | 1,331 | 1,331 | 1,331 | 1,331 | 1,363 | 32 |
| D.2 | plus taxes on production received | 7,318 | 5,719 | 7,719 | 6,649 | 5,413 | - 1,905 |
| D.3 | minus subsidies paid | - 370 | - 388 | - 409 | - 546 | - 421 | - 51 |
| D.4 | plus investment income received | 57 | 1,233 | 119 | 198 | 38 | - 20 |
| D.4 | minus Interest paid after FISIM | - 1,134 | - 1,185 | - 1,082 | - 1,054 | - 989 | 144 |
| D.5 | plus income and wealth taxes | 6,238 | 9,361 | 7,241 | 13,788 | 6,881 | 643 |
| D.61 | plus PRSI, pension contributions received | 3,930 | 3,850 | 3,787 | 4,280 | 3,953 | 23 |
| D.62 | minus Social protection, pensions paid | - 6,004 | - 5,790 | - 5,740 | - 6,636 | - 6,153 | - 150 |
| D.7 | plus net miscellaneous transfers | - 1,293 | - 707 | - 953 | - 786 | - 1,089 | 204 |
| B.6g | equals gross disposable income | 10,074 | 13,423 | 12,012 | 17,223 | 8,996 | - 1,078 |
| P.3 | minus final consumption expenditure | - 9,578 | - 10,306 | - 11,290 | - 11,132 | - 9,914 | - 336 |
| D.1 | of which compensation of employees | - 5,612 | - 5,834 | - 5,631 | - 5,932 | - 5,959 | - 347 |
| B.8g | equals gross saving | 496 | 3,117 | 722 | 6,091 | - 918 | - 1,414 |
| D.9 | plus net capital transfers | - 244 | - 277 | - 107 | - 277 | - 292 | - 48 |
| P.5 | minus capital spending | - 2,090 | - 2,000 | - 2,025 | - 2,127 | - 2,067 | 23 |
| NP | plus disposal of non-produced assets | - 0 | - 0 | 140 | - 0 | - 0 | - 0 |
| B.9 | equals net lending (+) /borrowing (-) | - 1,838 | 840 | - 1,269 | 3,688 | - 3,277 | - 1,439 |
Non-Financial Corporations (S.11)
Non-financial corporations had a large increase in capital investment (P.5) over the first quarter of 2019. This was due to imports of intellectual property. The gross value added (B.1g) of the sector grew, as wages (D.1) and operating surplus (B.2g) both went up. The increased operating surplus is reflected in increased gross saving (B.8g) in the sector, and to a lesser extent, lower net investment income (D.4 uses minus resources) as the sector passed on some of these profits to international owners.
| Table S11 Non-Financial Corporations | €million | ||||||
| ESA Code | Description | 2019-Q1 | 2019-Q2 | 2019-Q3 | 2019-Q4 | 2020-Q1 | 2020-Q1 versus 2019-Q1 |
| B.1g | Gross value added | 59,511 | 59,671 | 66,797 | 67,229 | 68,200 | 8,688 |
| D.1 | less compensation of employees | - 16,253 | - 16,282 | - 16,197 | - 16,948 | - 17,249 | - 995 |
| D.2/D.3 | plus subsidies less taxes on production | - 413 | - 426 | - 463 | - 306 | - 411 | 2 |
| B.2G | equals gross operating surplus | 42,845 | 42,963 | 50,137 | 49,976 | 50,540 | 7,695 |
| D.4 | plus investment income received | 4,662 | 4,008 | 5,591 | 5,538 | 6,456 | 1,794 |
| D.4 | minus investment income paid | - 24,143 | - 25,253 | - 25,966 | - 25,341 | - 26,358 | - 2,216 |
| D.42&D.43 | of which dividends and reinvested earnings paid | - 21,282 | - 22,295 | - 22,461 | - 21,726 | - 22,614 | - 1,332 |
| D.5 | minus corporation tax etc | - 408 | - 2,818 | - 1,288 | - 3,914 | - 689 | - 282 |
| D.7 | plus net miscellaneous transfers | - 142 | - 141 | - 141 | - 142 | - 142 | 0 |
| B.8g | equals gross saving | 22,816 | 18,760 | 28,333 | 26,117 | 29,807 | 6,992 |
| D.9 | plus net capital transfers | 117 | 108 | 56 | 183 | 156 | 39 |
| P.5 | minus capital investment expenditure | - 14,679 | - 55,955 | - 17,913 | - 55,905 | - 42,609 | - 27,930 |
| N.P | minus expenditure on non-produced assets | - 6,766 | - 17,301 | - 5,291 | - 5,927 | - 4,816 | 1,951 |
| B.9 | equals net lending (+) /borrowing (-) | 1,488 | - 54,388 | 5,184 | - 35,532 | - 17,461 | - 18,949 |
Financial Corporations (S.12)
Financial corporations (S.12) showed decreases in investment income (D.4) paid and received (mainly from the rest of the world), leaving their net income higher overall. Their profits (B2A3G) also grew leaving the sector with a higher gross saving than in the equivalent quarter of 2019.
| Table S12 Financial Corporations | €million | ||||||
| ESA Code | Description | 2019-Q1 | 2019-Q2 | 2019-Q3 | 2019-Q4 | 2020-Q1 | 2020-Q1 versus 2019-Q1 |
| B.1g | Gross value added | 4,483 | 4,651 | 4,972 | 5,178 | 5,087 | 605 |
| D.1 | less compensation of employees | - 2,056 | - 2,079 | - 2,052 | - 2,151 | - 2,190 | - 134 |
| D.2/D.3 | plus subsidies less taxes on production | - 102 | - 216 | - 101 | - 206 | - 98 | 5 |
| B.2G | equals gross operating surplus | 2,325 | 2,356 | 2,819 | 2,821 | 2,800 | 475 |
| D.4 inc | plus investment income received | 22,193 | 24,823 | 23,981 | 21,534 | 21,321 | - 872 |
| D.41 | of which interest | 17,203 | 17,794 | 18,535 | 18,136 | 17,240 | 37 |
| D.42&D.43 | dividends and reinvested earnings | 4,378 | 6,124 | 4,731 | 2,895 | 3,421 | - 956 |
| D.44 | other investment income | 612 | 905 | 716 | 503 | 659 | 47 |
| D.4 paid | minus investment income paid | - 22,351 | - 26,025 | - 23,610 | - 21,888 | - 21,312 | 1,039 |
| D.41 | of which interest | - 7,243 | - 6,870 | - 7,330 | - 7,428 | - 7,110 | 133 |
| D.42&D.43 | dividends and reinvested earnings | - 1,675 | - 3,594 | - 1,929 | - 1,279 | - 1,642 | 33 |
| D.44 | other investment income | - 13,434 | - 15,561 | - 14,350 | - 13,182 | - 12,560 | 874 |
| D.5 | minus corporation tax etc | - 120 | - 833 | - 381 | - 1,153 | - 203 | - 83 |
| D.61 | plus pension contributions received | 1,679 | 1,619 | 1,559 | 1,591 | 1,660 | - 19 |
| D.62 | minus pension benefits paid | - 1,102 | - 1,160 | - 1,245 | - 1,153 | - 1,247 | - 145 |
| D.8 | minus adjustment for pension saving of households | - 577 | - 459 | - 313 | - 438 | - 413 | 164 |
| D.7 net | plus net miscellaneous transfers | - 12 | - 12 | - 12 | - 12 | - 12 | 0 |
| B.8g | equals gross saving | 2,035 | 308 | 2,797 | 1,301 | 2,594 | 559 |
| D.9 net | plus net capital transfers | - 0 | - 0 | - 0 | - 0 | - 0 | - 0 |
| P.5 | minus capital investment expenditure | - 871 | - 882 | - 1,014 | - 1,138 | - 595 | 277 |
| B.9 | equals net lending (+) /borrowing (-) | 1,163 | - 575 | 1,783 | 163 | 1,999 | 836 |
Rest of the World Sector (S.2)
Ireland had higher exports (P.6) to the rest of the world (S.2) relative to the equivalent quarter last year, a factor in the increasing GDP. Service imports (P.7) from the rest of the world were higher in the first quarter of 2020 owing to exceptionally large imports of intellectual property. These purchases drove the changes in the balance of goods and services (B.11), the external balance (B.12, the equal and opposite of the current account balance in the International Accounts) and thence Ireland's higher net borrowing from institutions in other countries. Further detail on transactions with the Rest of the World are provided in the International Accounts.
| Table S.2 Rest of the World | €million | ||||||
| ESA Code | Description | 2019-Q1 | 2019-Q2 | 2019-Q3 | 2019-Q4 | 2020-Q1 | 2020-Q1 versus 2019-Q1 |
| P.7 | Imports | 74,635 | 120,044 | 80,529 | 129,868 | 105,911 | 31,276 |
| P.6 | minus exports | - 104,779 | - 109,212 | - 113,129 | - 121,747 | - 112,164 | - 7,385 |
| B.11 | equals balance of goods and services | - 30,144 | 10,832 | - 32,599 | 8,121 | - 6,252 | 23,891 |
| D.1 | plus net compensation of employees to rest of world | 28 | 36 | 40 | 44 | 49 | 21 |
| D.2-D.3 | plus taxes on production received less subsidies paid by rest of world | - 297 | - 186 | - 315 | - 335 | - 299 | - 1 |
| D.4 | plus investment income to rest of world | 19,894 | 21,222 | 20,349 | 20,108 | 19,965 | 72 |
| D.5, D.6, D.7, D.8 | plus net other current transfers to rest of world | 1,367 | 699 | 917 | 626 | 1,094 | - 273 |
| B.12 | equals current external balance | - 9,152 | 32,603 | - 11,608 | 28,564 | 14,557 | 23,709 |
| D.9 | plus net capital transfers to rest of world | 5 | 1 | - 10 | - 2 | 5 | 0 |
| NP | plus non-produced assets disposal by rest of world | 6,766 | 17,301 | 5,151 | 5,927 | 4,816 | - 1,951 |
| B.9 | equals net lending (+) /borrowing (-) | - 2,381 | 49,905 | - 6,467 | 34,490 | 19,377 | 21,758 |
| Table 1: Quarterly Accounts by Institutional Sector, Q1 2019 - Q1 2020 Summary | €million | |||||||||
| Key Variables | Quarter | S.2 Rest of World | S.1 Total Economy | S.1N Not Sectorised | S.11 Non-Financial Corporations | S.12 Financial Corporations | S.13 General Government | S.14+S.15 Households incl. NPISH | ||
| (a) | B.1*g | Gross Domestic Product | Q1 2019 | 84,929 | 6,018 | 59,511 | 4,483 | 6,943 | 7,975 | |
| Q2 2019 | 84,931 | 5,164 | 59,671 | 4,651 | 7,164 | 8,280 | ||||
| Q3 2019 | 93,225 | 5,912 | 66,797 | 4,972 | 6,961 | 8,583 | ||||
| Q4 2019 | 92,966 | 4,130 | 67,229 | 5,178 | 7,263 | 9,167 | ||||
| 2019 | 356,051 | 21,223 | 253,209 | 19,284 | 28,331 | 34,004 | ||||
| Q1 2020 | 90,753 | 2,331 | 68,200 | 5,087 | 7,322 | 7,814 | ||||
| (b) | B.2g/B.3g | Gross Operating Surplus / | Q1 2019 | 53,533 | -214 | 42,845 | 2,325 | 1,331 | 7,247 | |
| Mixed income | Q2 2019 | 54,757 | 421 | 42,963 | 2,356 | 1,331 | 7,686 | |||
| Q3 2019 | 61,528 | -791 | 50,137 | 2,819 | 1,331 | 8,033 | ||||
| Q4 2019 | 61,306 | -1,369 | 49,976 | 2,821 | 1,331 | 8,548 | ||||
| 2019 | 231,125 | -1,953 | 185,921 | 10,320 | 5,322 | 31,514 | ||||
| Q1 2020 | 59,786 | -2,038 | 50,540 | 2,800 | 1,363 | 7,120 | ||||
| (c) | D.1_D.4 | Net Primary Income | Q1 2019 | 11,771 | 0 | -19,480 | -158 | 5,872 | 25,537 | |
| Q2 2019 | 9,102 | 0 | -21,244 | -1,202 | 5,378 | 26,170 | ||||
| Q3 2019 | 11,623 | 0 | -20,376 | 372 | 6,346 | 25,281 | ||||
| Q4 2019 | 11,843 | 0 | -19,803 | -354 | 5,247 | 26,752 | ||||
| 2019 | 44,338 | 0 | -80,903 | -1,343 | 22,843 | 103,740 | ||||
| Q1 2020 | 11,252 | 0 | -19,902 | 9 | 4,041 | 27,104 | ||||
| (d) | B.5g | Gross National Income | Q1 2019 | 65,304 | -214 | 23,365 | 2,167 | 7,203 | 32,784 | |
| = (b + c) | Q2 2019 | 63,859 | 421 | 21,718 | 1,154 | 6,709 | 33,857 | |||
| Q3 2019 | 73,151 | -791 | 29,762 | 3,190 | 7,677 | 33,313 | ||||
| Q4 2019 | 73,149 | -1,369 | 30,173 | 2,466 | 6,578 | 35,300 | ||||
| 2019 | 275,463 | -1,953 | 105,019 | 8,977 | 28,166 | 135,255 | ||||
| Q1 2020 | 71,038 | -2,038 | 30,638 | 2,809 | 5,404 | 34,224 | ||||
| (e) | D.5_D.7 | Net Current Transfers | Q1 2019 | -1367 | 0 | -549 | 445 | 2,871 | -4,134 | |
| Q2 2019 | -699 | 0 | -2,959 | -387 | 6,714 | -4,067 | ||||
| Q3 2019 | -917 | 0 | -1,429 | -80 | 4,335 | -3,744 | ||||
| Q4 2019 | -626 | 0 | -4,057 | -727 | 10,646 | -6,487 | ||||
| 2019 | -3,609 | 0 | -8,994 | -749 | 24,566 | -18,432 | ||||
| Q1 2020 | -1094 | 0 | -831 | 198 | 3,592 | -4,052 | ||||
| (f) | B.6g | Gross Disposable Income | Q1 2019 | 63,937 | -214 | 22,816 | 2,611 | 10,074 | 28,651 | |
| = (d + e) | Q2 2019 | 63,160 | 421 | 18,760 | 766 | 13,423 | 29,790 | |||
| Q3 2019 | 72,234 | -791 | 28,333 | 3,111 | 12,012 | 29,569 | ||||
| Q4 2019 | 72,523 | -1,369 | 26,117 | 1,739 | 17,223 | 28,813 | ||||
| 2019 | 271,853 | -1,953 | 96,025 | 8,227 | 52,732 | 116,823 | ||||
| Q1 2020 | 69,944 | -2,038 | 29,807 | 3,007 | 8,996 | 30,172 | ||||
| (g) | P.3 + D.8 | Use of Disposable Income | Q1 2019 | -35,295 | 0 | 0 | -577 | -9,578 | -25,140 | |
| Q2 2019 | -35,687 | 0 | 0 | -459 | -10,306 | -24,923 | ||||
| Q3 2019 | -36,842 | 0 | 0 | -313 | -11,290 | -25,239 | ||||
| Q4 2019 | -38,635 | 0 | 0 | -438 | -11,132 | -27,065 | ||||
| 2019 | -146,460 | 0 | 0 | -1,787 | -42,306 | -102,367 | ||||
| Q1 2020 | -35,423 | 0 | 0 | -413 | -9,914 | -25,096 | ||||
| (h) | B.8g | Gross Saving | Q1 2019 | 28,642 | -214 | 22,816 | 2,035 | 496 | 3,511 | |
| = (f + g) | Q2 2019 | 27,472 | 421 | 18,760 | 308 | 3,117 | 4,866 | |||
| Q3 2019 | 35,392 | -791 | 28,333 | 2,797 | 722 | 4,331 | ||||
| Q4 2019 | 33,887 | -1,369 | 26,117 | 1,301 | 6,091 | 1,748 | ||||
| 2019 | 125,394 | -1,953 | 96,025 | 6,440 | 10,426 | 14,456 | ||||
| Q1 2020 | 34,521 | -2,038 | 29,807 | 2,594 | -918 | 5,076 | ||||
| (i) | Changes in Capital Accounts | Q1 2019 | -4,557 | -214 | -2,682 | -410 | -1,218 | -33 | ||
| Q2 2019 | -55,588 | 421 | -54,423 | -419 | -1,161 | -5 | ||||
| Q3 2019 | -7,005 | -791 | -4,306 | -548 | -876 | -484 | ||||
| Q4 2019 | -45,936 | -1,369 | -42,334 | -660 | -1,288 | -285 | ||||
| 2019 | -113,086 | -1,953 | -103,745 | -2,038 | -4,543 | -807 | ||||
| Q1 2020 | -30,818 | -2,038 | -27,336 | -103 | -1,243 | -98 | ||||
| (j) | P.51C | Consumption of Fixed Capital1 | Q1 2019 | 21,704 | 18,646 | 461 | 1,115 | 1,481 | ||
| Q2 2019 | 21,790 | 18,724 | 463 | 1,115 | 1,487 | |||||
| Q3 2019 | 21,920 | 18,842 | 466 | 1,115 | 1,496 | |||||
| Q4 2019 | 22,441 | 19,315 | 478 | 1,115 | 1,534 | |||||
| 2019 | 87,854 | 75,527 | 1,868 | 4,462 | 5,997 | |||||
| Q1 2020 | 23,081 | 19,932 | 492 | 1,115 | 1,541 | |||||
| (k) | B.9 | Net lending (+) | Q1 2019 | -2,381 | 2,381 | -429 | 1,488 | 1,163 | -1,838 | 1,997 |
| / Net borrowing (-) | Q2 2019 | 49,905 | -49,905 | 843 | -54,388 | -575 | 840 | 3,374 | ||
| = (h + i) - j | Q3 2019 | -6,467 | 6,467 | -1,581 | 5,184 | 1,783 | -1,269 | 2,350 | ||
| Q4 2019 | 34,490 | -34,490 | -2,739 | -35,532 | 163 | 3,688 | -70 | |||
| 2019 | 75,547 | -75,547 | -3,906 | -83,247 | 2,535 | 1,421 | 7,652 | |||
| Q1 2020 | 19,377 | -19,377 | -4,076 | -17,461 | 1,999 | -3,277 | 3,437 | |||
| Table 1.2 Generation of Income Account | €million | ||||||||
| RESOURCES (RECEIVED) | S.1+S.2 Sum Over Sectors | S.2 Rest of World | S.1 Total Economy | S.1N Not Sectorised | S.11 Non-Financial Corporations | S.12 Financial Corporations | S.13 General Government | S.14+S.15 Households incl. NPISH | |
| B.1*g | Gross Domestic Product | 90,753 | 2,331 | 68,200 | 5,087 | 7,322 | 7,814 | ||
| D.3 | Subsidies, Received | 798 | 798 | 236 | 201 | 0 | 0 | 361 | |
| USES (PAID) | |||||||||
| D.1 | Compensation of Employees | 26,405 | 131 | 26,274 | 17,249 | 2,190 | 5,959 | 877 | |
| D.2 | Taxes on Production and Imports, Paid | 5,491 | 5,491 | 4,605 | 612 | 98 | 0 | 177 | |
| B.2g/ B.3g | Gross Operating Surplus/ Gross Mixed Income | 59,786 | -2,038 | 50,540 | 2,800 | 1,363 | 7,120 | ||
| Table 1.3 Allocation of Primary Income Account | €million | ||||||||
| RESOURCES (RECEIVED) | S.1+S.2 Sum Over Sectors | S.2 Rest of World | S.1 Total Economy | S.1N Not Sectorised | S.11 Non-Financial Corporations | S.12 Financial Corporations | S.13 General Government | S.14+S.15 Households incl. NPISH | |
| B.2g/ B.3g | Gross Operating Surplus/ Gross Mixed income | 59,786 | -2,038 | 50,540 | 2,800 | 1,363 | 7,120 | ||
| D.1 | Compensation of Employees | 26,405 | 180 | 26,225 | 26,225 | ||||
| D.2 | Taxes on Production and Imports, Received | 5,491 | 78 | 5,413 | 5,413 | ||||
| D.4 | Property Income | 75,330 | 45,910 | 29,420 | 6,456 | 21,321 | 38 | 1,604 | |
| D.41 | Interest | 28,589 | 10,092 | 18,497 | 681 | 17,240 | 22 | 553 | |
| D.42 | Distributed Income of Corporations | 18,097 | 13,763 | 4,334 | 84 | 3,598 | 11 | 642 | |
| D.43 | Reinvested Earnings on Direct Foreign Investment | 15,350 | 9,844 | 5,506 | 5,682 | -176 | 0 | 0 | |
| D.44 | Property Income attributed to Insurance Policy Holders | 13,219 | 12,211 | 1,008 | 9 | 659 | 0 | 340 | |
| D.45 | Rents | 75 | 75 | 0 | 0 | 5 | 70 | ||
| USES (PAID) | |||||||||
| D.3 | Subsidies, Paid | 798 | 377 | 421 | 421 | ||||
| D.4 | Property Income | 75,330 | 25,945 | 49,385 | 26,358 | 21,312 | 989 | 726 | |
| D.41 | Interest | 28,589 | 16,095 | 12,494 | 3,739 | 7,110 | 989 | 656 | |
| D.42 | Distributed Income of Corporations | 18,097 | 3,685 | 14,412 | 14,199 | 213 | 0 | 0 | |
| D.43 | Reinvested Earnings on Direct Foreign Investment | 15,350 | 5,506 | 9,844 | 8,415 | 1,429 | 0 | 0 | |
| D.44 | Property Income attributed to Insurance Policy Holders | 13,219 | 659 | 12,560 | 0 | 12,560 | 0 | 0 | |
| D.45 | Rents | 75 | 75 | 5 | 0 | 0 | 70 | ||
| B.5g | Gross National Income | 71,038 | -2,038 | 30,638 | 2,809 | 5,404 | 34,224 | ||
| Table 1.5 Secondary Distribution of Income Account | €million | ||||||||
| RESOURCES (RECEIVED) | S.1+S.2 Sum Over Sectors | S.2 Rest of World | S.1 Total Economy | S.1N Not Sectorised | S.11 Non-Financial Corporations | S.12 Financial Corporations | S.13 General Government | S.14+S.15 Households incl. NPISH | |
| B.5g | Gross National Income | 71,038 | -2,038 | 30,638 | 2,809 | 5,404 | 34,224 | ||
| D.5 | Current Taxes on Income, Wealth, etc. | 6,901 | 20 | 6,881 | 6,881 | ||||
| D.61 | Social Contributions | 5,613 | 0 | 5,613 | 0 | 1,660 | 3,953 | 0 | |
| D.62 | Social Benefits other than Social Transfers in kind | 7,576 | 79 | 7,497 | 7,497 | ||||
| D.7 | Other Current Transfers | 6,499 | 2,467 | 4,032 | 185 | 2,341 | 64 | 1,442 | |
| USES (PAID) | |||||||||
| D.5 | Current Taxes on Income, Wealth, etc. | 6,901 | 19 | 6,882 | 689 | 203 | 0 | 5,990 | |
| D.61 | Net Social Contributions | 5,613 | 0 | 5,613 | 5,613 | ||||
| D.62 | Social Benefits other than Social Transfers in kind | 7,576 | 176 | 7,400 | 0 | 1,247 | 6,153 | 0 | |
| D.7 | Other Current Transfers | 6,499 | 1,277 | 5,222 | 326 | 2,353 | 1,154 | 1,389 | |
| B.6g | Gross Disposable Income | 69,944 | -2,038 | 29,807 | 3,007 | 8,996 | 30,172 | ||
| Table 1.6 Use of Disposable Income Account | €million | ||||||||
| RESOURCES (RECEIVED) | S.1+S.2 Sum Over Sectors | S.2 Rest of World | S.1 Total Economy | S.1N Not Sectorised | S.11 Non-Financial Corporations | S.12 Financial Corporations | S.13 General Government | S.14+S.15 Households incl. NPISH | |
| B.6g | Gross Disposable Income | 69,944 | -2,038 | 29,807 | 3,007 | 8,996 | 30,172 | ||
| D.8 | Adjustment for the Change in Pension Entitlements | 413 | 0 | 413 | 413 | ||||
| USES (PAID) | |||||||||
| P.3 | Final Consumption Expenditure | 35,423 | 9,914 | 25,509 | |||||
| D.8 | Adjustment for the Change in Pension Entitlements | 413 | 0 | 413 | 413 | ||||
| B.8g | Gross Saving | 34,521 | -2,038 | 29,807 | 2,594 | -918 | 5,076 | ||
| Table 1.7 External Account | €million | ||||||||
| RESOURCES (RECEIVED) | S.1+S.2 Sum Over Sectors | S.2 Rest of World | S.1 Total Economy | S.1N Not Sectorised | S.11 Non-Financial Corporations | S.12 Financial Corporations | S.13 General Government | S.14+S.15 Households incl. NPISH | |
| P.7 | Imports of Goods and Services | 105,911 | |||||||
| D.1 to D.8 | Primary Incomes and Current Transfers | 135,026 | 48,734 | 86,292 | |||||
| USES (PAID) | |||||||||
| P.6 | Exports of Goods and Services | 112,164 | |||||||
| B.11 | External Balance of Goods & Services | -6,252 | |||||||
| D.1 to D.8 | Primary Incomes and Current Transfers | 135,026 | 27,925 | 107,101 | |||||
| B.12 | Current External Balance | 14,557 | |||||||
| Table 1.8 Change in Net Worth due to Saving and Capital Transfers Account | €million | ||||||||
| LIABILITIES | S.1+S.2 Sum Over Sectors | S.2 Rest of World | S.1 Total Economy | S.1N Not Sectorised | S.11 Non-Financial Corporations | S.12 Financial Corporations | S.13 General Government | S.14+S.15 Households incl. NPISH | |
| B.8g | Gross Saving | 34,521 | -2,038 | 29,807 | 2,594 | -918 | 5,076 | ||
| B.12 | Current External Balance | 14,557 | |||||||
| D.9 | Capital Transfers | 689 | 5 | 684 | 304 | 0 | 196 | 184 | |
| ASSETS | |||||||||
| D.9 | Capital Transfers | 689 | 0 | 689 | 148 | 0 | 488 | 53 | |
| P.51c | Consumption of Fixed Capital | 23,081 | 19,932 | 492 | 1,115 | 1,541 | |||
| B.10.1 | Changes in Net Worth due to Saving and Capital Transfers | 25,997 | 14,562 | 11,436 | -2,038 | 10,031 | 2,102 | -2,326 | 3,666 |
| Table 1.9 Acquisition of Non-Financial Assets Account | €million | ||||||||
| LIABILITIES | S.1+S.2 Sum Over Sectors | S.2 Rest of World | S.1 Total Economy | S.1N Not Sectorised | S.11 Non-Financial Corporations | S.12 Financial Corporations | S.13 General Government | S.14+S.15 Households incl. NPISH | |
| B.10.1 | Changes in Net Worth due to Saving and Capital Transfers | 25,997 | 14,562 | 11,436 | -2,038 | 10,031 | 2,102 | -2,326 | 3,666 |
| P.51c | Consumption of Fixed Capital | 23,081 | 23,081 | 19,932 | 492 | 1,115 | 1,541 | ||
| ASSETS | |||||||||
| P.5 | Gross Capital Formation | 49,078 | 49,078 | 2,038 | 42,609 | 595 | 2,067 | 1,770 | |
| NP | Acquisitions less Disposals of Non-Produced Assets | 0 | -4,816 | 4,816 | 4,816 | 0 | 0 | 0 | |
| B.9 | Net Lending (+)/ Net Borrowing (-) | 0 | 19,377 | -19,377 | -4,076 | -17,461 | 1,999 | -3,277 | 3,437 |
Revisions to all quarters have been made in line with the main Quarterly National Accounts, International Accounts and Government Accounts. The treatment of investment income (interest, dividends, reinvested earnings) transactions with the rest of the world has been revised to be consistent with International Accounts.
Seasonally adjusting the Accounts will be challenging until the full scale and shape of the impact COVID-19 has on the time series is better understood. Users should be aware that as further data observations become available in the months and quarters ahead, revisions to the seasonal adjustment models may result in revisions to the quarterly seasonally adjusted series.
In the Sector Accounts, Institutional Sectors are distinguished not in terms of the nature of their production activity (such as agriculture, industry, services, etc.) but rather in terms primarily of the institutional form of the units that make them up. Thus, companies, whether engaged in commercial non-financial or financial business, are grouped in a different sector from households, even though the latter are in many cases also engaged in commercial production, and from government or other non-market producers such as voluntary agencies.
The classification system is that of the European System of Accounts 2010 (ESA2010). The sectors and sub-sectors distinguished in the present publication are as follows:
S.1 Resident Economy is the sum of all the sectors of the domestic economy.
S.11 Non-Financial Corporations are companies producing goods and non-financial services on a commercial basis. They include government-controlled companies, private companies and other corporate forms of business, whether owned by residents or non-residents or both. In particular, therefore, Irish subsidiaries of foreign companies and the Irish branches of foreign companies operating in Ireland on a branch basis are included. The foreign subsidiaries of Irish companies and the foreign branches of Irish companies operating abroad are excluded. Large partnerships such as big law and accounting firms, are included in S.11, even though they are not incorporated they are quasi-corporations. Entities which operate as holding companies for non-financial corporations are classified in the financial sector and not here.
S.12 Financial Corporations are corporate bodies producing financial services on a commercial basis. As with S.11, they can take various legal forms, with a range of ownership arrangements. They include banks, insurance corporations and pension funds.
S.13 General Government consists of central and local government. Central government includes the Ireland Strategic Investment Fund (formerly the NPRF), and non-commercial agencies owned and funded by government, but does not include commercial state-owned companies (which are proper to S.11 or S.12 as appropriate). The Register of Public Sector Bodies sets out which bodies are included here.
S.1M: S.14 + S.15 Households and Non-Profit Institutions Serving Households. S.14 accounts are the economic transactions of people in their capacity as consumers, employees, self-employed workers, pensioners and recipients of other income and transfers. S.15 consists of non-profit institutions such as charities and non-commercial agencies not owned by the government, such as sports clubs and churches.
S.2 Rest of World. This sector represents the economy's transactions with non-residents. The conceptual definition is the same as in the Balance of Payments (BOP) statistics. In particular, non-residents include foreign subsidiaries of Irish companies, the foreign branches of Irish companies that operate abroad on a branch basis, and the head offices of foreign companies that operate in Ireland on a branch basis.
S.1N Not Sectorised. In the non-financial accounts an additional residual sector is used to report taxes and subsidies on products (D.21, D.31) in the Generation of Income Account (Account 1.2) as it is not possible to allocate these amounts to Institutional Sectors. In addition, throughout these accounts S.1N is used to report the amounts that appear as the statistical discrepancy in the National Income and Expenditure GDP accounts, arising from the use of two independent estimates of GDP (from the Income and Expenditure approaches). In the Annual National Accounts NIE tables 3 and 5, the official estimate of GDP is reported as the average of the two measures, and the discrepancy is therefore displayed as half the difference between the two independent estimates (and thus with different signs in the two tables). The discrepancy is projected forward on a quarterly basis in line with the trends in the Expenditure components and is presented in Table 2 of the Quarterly National Accounts. In the Quarterly Sector Accounts it appears in Gross Domestic Product, the opening item in the Generation of Income Account and is then carried through successive accounts via the balancing item.
Sector Accounts present a coherent overview of all economic processes and the roles played by the various sectors. Each economic process is described in a separate account. The accounts describe successively: generation of income, primary and secondary income distribution, final consumption, redistribution by means of capital transfers, and capital formation. Note that the Production Account (1.1) from the Annual Accounts is not included in these quarterly accounts as the data is not available on a quarterly basis. The accounts record economic transactions, distinguishing between uses and resources (e.g. the resources side of the transaction category Interest (D.41) records the amounts of interest receivable by the different sectors of the economy and the uses side shows interest payable) with a special item to balance the two sides of each account. By passing on the balancing item from one account to the next a connection is created between successive accounts.
The accounts are compiled for the total economy and include accounts for separate domestic sectors and the Rest of World sector. In this way the sector accounts describe:
The successive accounts are explained in more detail below.
This account is not presented in the Quarterly Non-Financial Accounts as quarterly data is not available.
This account displays the transactions through which Gross Domestic Product at market prices is distributed to labour (compensation of employees), capital (operating surplus) and government (the balance of taxes and subsidies on production). The balancing item for the Household and NPISH sector in this account is called mixed income, because apart from operating surplus it also contains compensation for work by self-employed persons and their family members. Gross Operating Surplus/Gross Mixed Income (B.2g/B.3g) is the balancing item for the entire account.
This account records, as resources, the income from direct participation in the production process, as well as property income received in exchange for the use of land, financial resources and other intangible assets. In addition, this account records the taxes on production and imports received by the government. On the uses side, property income (including interest, dividends, reinvested earnings and land rent) is recorded as well as the subsidies paid by the government.
On this account the interest paid and received are recorded excluding imputed bank services (financial intermediation services indirectly measured - FISIM). In the national accounts insurance technical reserves are seen as a liability of insurance enterprises and pension funds to policyholders. Therefore, the receipts from investing these reserves are recorded as payments from insurance enterprises and pension funds to households, under Other Investment Income (D.44). The balancing item of this account for each sector is Gross National Income (B.5g). The Primary Income for the total economy is the National Income.
This account is not presented in the Quarterly series.
The Secondary Distribution of Income Account shows how primary income is redistributed by means of current taxes on income and wealth, social contributions (including contributions to pension schemes), social benefits (including pension benefits) and other current transfers. The balancing item of this account is Gross Disposable Income (B.6g). For the consuming sectors (Households, NPISH and General Government) this item is passed on to Use of Disposable Income Account (1.6). For the other sectors the disposable income is generally equal to saving. This is then passed on to the Change in Net Worth due to Saving and Capital Transfers Account (1.8).
This account shows the element of disposable income that is spent on final consumption and also the element that is saved. As mentioned above, final consumption only exists for Households, NPISH and General Government. The net equity of Households in pension funds is seen as a financial asset that belongs to Households. Changes in these reserves need to be included in the saving of Households. However, contributions to pension schemes and pension benefits have already been recorded on the Secondary Distribution of Income Account (1.5) as social contributions and social benefits. Therefore, an adjustment is needed in the saving of Households to include the change in pension funds reserves on which they have a definite claim. This adjustment is called Adjustment for the Change in Pension Entitlements (D.8). There is no need for a similar adjustment concerning life insurance because life insurance premiums and benefits are not recorded as current transactions. The balancing item for this account is Gross Saving (B.8g).
This account records the summarised transactions of the Rest of World Sector (S.2), including on the uses side exports of goods and services, primary incomes and current transfers receivable. The resources side of this account includes imports of goods and services together with primary incomes and transfers payable. The balancing item is Current External Balance (B.12), which records the balance on current accounts with the Rest of World.
On this account the capital transfers are recorded and combined with gross saving and the current external balance. The resulting balancing item is Changes in Net Worth due to Saving and Capital Transfers (B.10.1).
On this account, Gross Fixed Capital Formation (P.51), Changes in Inventories (P.52) and Acquisitions less Disposals of Valuables and Non-Produced Non-Financial Assets (N.P.) are recorded among the uses. The decline in the value of fixed capital goods caused by consumption of fixed capital goods is recorded among the resources (P.51c). The balancing item is B.9, Net Lending (shown as a positive number) or Borrowing (shown as a negative). It shows the amount a sector can invest, or has to borrow, as a result of its current and capital transactions.
Seasonal adjustment is conducted using the direct seasonal adjustment approach. Under this approach, each individual time series is independently adjusted, i.e. aggregate series are adjusted without reference to the component series.
As part of the seasonal adjustment process, ARIMA models are identified for each series based on unadjusted data spanning Q1 1999 to the first quarter of this year. These models are then applied to the entire series in the next three quarters. Seasonal factors and the parameters of the ARIMA models are updated each quarter.
The adjustments are completed by applying the X-13-ARIMA model, developed by the U.S. Census Bureau to the unadjusted data. This methodology estimates seasonal factors while also taking into consideration factors that impact on the quality of the seasonal adjustment such as, for example:
For additional information on the use of X-13-ARIMA, see https://www.census.gov/srd/www/x13as/.
Seasonally adjusted estimates of Household Saving are compiled using the indirect seasonal adjustment approach. Under this approach the two main aggregates, Household Disposable Income (B.6g + D.8) and Final Consumption Expenditure of Households (P.3), are independently adjusted. The derived saving is the difference between the two adjusted series of Household Disposable Income and Final Expenditure of Households. This method for estimating the seasonally adjusted value for a small net residual of two large aggregates, such as Household Saving, is considered to be a more appropriate estimation procedure.
The use of these saving either for financial investment or debt reduction is not recorded in these accounts but is recorded in the financial account (see Quarterly Financial Accounts published by the Central Bank of Ireland and Institutional Sector Accounts Non-Financial and Financial 2018 for annual integrated financial and non financial accounts).
 Hide Background Notes
Scan the QR code below to view this release online or go to
http://www.cso.ie/en/releasesandpublications/er/isanf/institutionalsectoraccountsnon-financialquarter12020/
 Show Table S.1M Households and Non-Profits
 Hide Table S.1M Households and Non-Profits