
This release has been compiled during the COVID-19 crisis. The results contained in this release reflect some of the economic impacts of the COVID-19 situation. In general, for the Industrial Production and Turnover indices, the CSO recommends that commentary and interpretation of the results should focus mainly on the monthly unadjusted series and on the seasonally adjusted three-month moving average. The CSO will continue to review how the seasonal adjustment models are applied to the series on Industrial Production and Turnover, and may introduce revised estimates. For further information see Information Note Industrial Production and Turnover Index November 2021.
| Notice of Revisions: The Industrial Production and Turnover Indices were revised on 13th December 2021. See here for further information. |
|---|
| Manufacturing Industries - Seasonally Adjusted and Unadjusted1 | ||||
| (Base Year 2015 = 100) | ||||
| Seasonally Adjusted | Seasonally Unadjusted | |||
| Production Index | Turnover Index | Production Index | Turnover Index | |
| November 2020 | 180.9 | 121.1 | 199.2 | 134.5 |
| October 2021 | 92.1 | 127.3 | 130.8 | 138.5 |
| November 2021 | 125.4 | 128.7 | 136.7 | 142.8 |
| Monthly % change | 36.2 | 1.1 | 4.5 | 3.1 |
| Annual % change | -30.7 | 6.3 | -31.4 | 6.2 |
| Jun 2021 - Aug 2021 | 140.4 | 126.6 | 130.4 | 116.2 |
| Sep 2021 - Nov 2021 | 117.0 | 128.7 | 143.6 | 148.2 |
| % change | -16.7 | 1.7 | 10.1 | 27.5 |
| 1Figures may differ due to rounding. | ||||
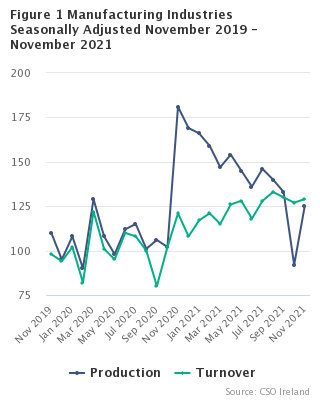
Production in manufacturing industries was 16.7% lower in the three months September 2021 to November 2021 than in the preceding three months. See Headline Table and Table 3b.
On an annual basis, production in manufacturing industries was 30.7% less in November 2021 than in November 2020. See Headline Table, Table 1 and Table 3a.
On an annual basis, production in the “Traditional” sector was 13.4% greater in November 2021 than in November 2020, while over the same period production for the "Modern" sector was 38.5% lower. See Table 2.
A number of large annual increases in production were recorded in some sub-indices of the “Traditional” sector in November 2021. For instance, Wood and wood products, except furniture was 28.9% greater in November 2021 than in November 2020, while food production increased by 41.1%. See Table 3a.
Turnover in manufacturing industries was 1.7% greater in the three months from September 2021 to November 2021 than in the preceding three months. See Headline Table and Table 5b.
On an annual basis, turnover in manufacturing industries was 6.3% greater in November 2021 than in November 2020. See Headline Table, Table 4 and Table 5a.
Adjusted and unadjusted indices are available on CSO PxStat.
|
1The figures from March 2020 onwards are an exception to existing seasonal patterns and have highlighted the underlying volatility of the monthly industrial production and turnover series. Seasonal adjustment is challenging in the current climate and while the seasonal adjustment models have been reviewed and changed as appropriate (e.g. by treating the data for certain sectors as additive outliers) the underlying volatility of the data is still reflected in the seasonally adjusted series. The CSO is continuing to review how the seasonal adjustment models are applied to the series on Industrial Production and Turnover, and may introduce revised estimates. |
| Table 1 Volume Indices of Production | Base Year: 2015=100 | |||||||
| Manufacturing Industries | Industries | |||||||
| NACE 10 - 33 | NACE 05 - 35 | |||||||
| Seasonally Adjusted Indices | ||||||||
| Period | Index | % change on previous period | Annual % change | Index | % change on previous period | Annual % change | ||
| 2018 | Year | 97.9 | -4.2 | 97.3 | -4.9 | |||
| 2019 | Year | 104.0 | 6.2 | 104.0 | 7.0 | |||
| 2020 | Year | 117.2 | 12.7 | 119.2 | 14.6 | |||
| 2019 | 1st quarter | 100.3 | 0.4 | 7.2 | 100.4 | 1.6 | 7.4 | |
| 2nd quarter | 98.5 | -1.8 | 0.2 | 100.2 | -0.2 | 2.4 | ||
| 3rd quarter | 102.1 | 3.7 | 5.5 | 102.7 | 2.5 | 6.5 | ||
| 4th quarter | 109.8 | 7.5 | 9.9 | 108.6 | 5.7 | 9.8 | ||
| 2020 | 1st quarter | 108.9 | -0.8 | 8.6 | 112.9 | 4.0 | 12.4 | |
| 2nd quarter | 105.8 | -2.9 | 7.3 | 111.4 | -1.3 | 11.1 | ||
| 3rd quarter | 107.2 | 1.3 | 4.9 | 110.4 | -0.9 | 7.5 | ||
| 4th quarter | 150.6 | 40.6 | 37.2 | 147.0 | 33.2 | 35.4 | ||
| 2021 | 1st quarter | 157.4 | 4.5 | 44.4 | 158.3 | 7.7 | 40.3 | |
| 2nd quarter | 144.9 | -7.9 | 37.0 | 146.8 | -7.3 | 31.8 | ||
| 3rd quarter | 139.7 | -3.6 | 30.3 | 139.5 | -5.0 | 26.4 | ||
| 2019 | November | 109.8 | -11.6 | 8.8 | 105.5 | -14.1 | 9.2 | |
| December | 95.4 | -13.1 | 1.7 | 97.4 | -7.7 | 3.4 | ||
| 2020 | January | 107.8 | 13.0 | 6.3 | 106.6 | 9.5 | 8.2 | |
| February | 89.6 | -16.9 | -9.1 | 97.3 | -8.7 | -3.4 | ||
| March | 129.4 | 44.4 | 28.3 | 134.7 | 38.4 | 32.0 | ||
| April | 107.7 | -16.8 | 5.8 | 108.0 | -19.8 | 6.8 | ||
| May | 97.5 | -9.4 | -0.8 | 103.5 | -4.2 | 4.0 | ||
| June | 112.1 | 14.9 | 17.3 | 122.6 | 18.4 | 22.6 | ||
| July | 114.7 | 2.3 | 25.6 | 119.9 | -2.2 | 26.0 | ||
| August | 101.2 | -11.7 | 0.3 | 106.0 | -11.6 | 3.3 | ||
| September | 105.5 | 4.3 | -7.5 | 105.3 | -0.6 | -4.7 | ||
| October | 102.3 | -3.1 | -17.6 | 101.0 | -4.0 | -17.7 | ||
| November | 180.9 | 76.9 | 64.8 | 174.7 | 72.9 | 65.6 | ||
| December | 168.6 | -6.8 | 76.7 | 165.2 | -5.4 | 69.7 | ||
| 2021 | January | 165.9 | -1.7 | 53.9 | 159.9 | -3.2 | 50.0 | |
| February | 158.8 | -4.3 | 77.1 | 161.9 | 1.3 | 66.4 | ||
| March | 147.5 | -7.1 | 14.0 | 153.1 | -5.4 | 13.7 | ||
| April | 154.5 | 4.7 | 43.4 | 151.1 | -1.3 | 39.9 | ||
| May | 144.6 | -6.4 | 48.3 | 145.9 | -3.4 | 40.9 | ||
| June | 135.6 | -6.3 | 20.9 | 143.5 | -1.6 | 17.0 | ||
| July | 145.7 | 7.4 | 27.0 | 145.4 | 1.4 | 21.3 | ||
| August | 139.9 | -3.9 | 38.2 | 140.4 | -3.4 | 32.5 | ||
| September | 133.4 | -4.7 | 26.4 | 132.6 | -5.6 | 25.9 | ||
| October | 92.1 | -31.0 | -10.0 | 90.1 | -32.1 | -10.9 | ||
| November1 | 125.4 | 36.2 | -30.7 | 123.7 | 37.4 | -29.2 | ||
| 1 Provisional data | ||||||||
| Table 1a Volume Indices of Production | Base Year: 2015=100 | |||||||
| Manufacturing Industries | Industries | |||||||
| NACE 10 - 33 | NACE 05 - 35 | |||||||
| Seasonally Unadjusted Indices | ||||||||
| Period | Index | % change on previous period | Annual % change | Index | % change on previous period | Annual % change | ||
| 2018 | Year | 97.9 | -4.2 | 97.3 | -4.9 | |||
| 2019 | Year | 104.0 | 6.2 | 104.1 | 7.0 | |||
| 2020 | Year | 117.2 | 12.7 | 119.2 | 14.6 | |||
| 2019 | 1st quarter | 94.0 | -18.4 | 4.1 | 93.9 | -17.5 | 4.7 | |
| 2nd quarter | 88.7 | -5.7 | 0.8 | 89.6 | -4.6 | 2.1 | ||
| 3rd quarter | 106.6 | 20.2 | 8.5 | 106.4 | 18.8 | 8.9 | ||
| 4th quarter | 126.7 | 18.9 | 10.0 | 126.2 | 18.6 | 10.9 | ||
| 2020 | 1st quarter | 101.3 | -20.1 | 7.7 | 104.0 | -17.7 | 10.7 | |
| 2nd quarter | 95.4 | -5.9 | 7.6 | 98.9 | -4.9 | 10.4 | ||
| 3rd quarter | 114.1 | 19.6 | 7.1 | 116.2 | 17.5 | 9.2 | ||
| 4th quarter | 158.2 | 38.6 | 24.8 | 157.9 | 35.9 | 25.0 | ||
| 2021 | 1st quarter | 146.9 | -7.1 | 45.0 | 146.2 | -7.4 | 40.6 | |
| 2nd quarter | 132.5 | -9.8 | 38.9 | 131.7 | -9.9 | 33.2 | ||
| 3rd quarter | 149.8 | 13.1 | 31.3 | 148.3 | 12.6 | 27.7 | ||
| 2019 | November | 122.2 | -33.2 | 8.2 | 121.7 | -32.5 | 8.7 | |
| December | 74.9 | -38.7 | -5.6 | 76.8 | -36.9 | -3.0 | ||
| 2020 | January | 125.8 | 67.9 | 5.5 | 126.9 | 65.4 | 8.2 | |
| February | 72.1 | -42.7 | -9.6 | 76.2 | -39.9 | -5.1 | ||
| March | 106.1 | 47.2 | 27.7 | 108.7 | 42.5 | 29.4 | ||
| April | 117.8 | 11.1 | 9.3 | 119.4 | 9.8 | 10.6 | ||
| May | 80.9 | -31.3 | -1.3 | 85.6 | -28.3 | 2.9 | ||
| June | 87.4 | 8.0 | 14.7 | 91.6 | 7.0 | 17.9 | ||
| July | 130.6 | 49.5 | 30.2 | 132.9 | 45.0 | 32.3 | ||
| August | 82.8 | -36.6 | 1.1 | 85.9 | -35.4 | 3.7 | ||
| September | 128.9 | 55.8 | -6.2 | 129.8 | 51.2 | -4.6 | ||
| October | 149.9 | 16.3 | -18.1 | 150.1 | 15.7 | -16.8 | ||
| November | 199.2 | 32.9 | 63.0 | 197.4 | 31.5 | 62.3 | ||
| December | 125.4 | -37.0 | 67.4 | 126.0 | -36.2 | 64.2 | ||
| 2021 | January | 192.2 | 53.3 | 52.8 | 189.3 | 50.2 | 49.1 | |
| February | 127.4 | -33.7 | 76.8 | 127.6 | -32.6 | 67.4 | ||
| March | 121.0 | -5.0 | 14.1 | 121.6 | -4.7 | 11.9 | ||
| April | 172.7 | 42.8 | 46.6 | 170.6 | 40.4 | 43.0 | ||
| May | 119.7 | -30.7 | 47.9 | 119.2 | -30.1 | 39.2 | ||
| June | 105.1 | -12.2 | 20.3 | 105.2 | -11.7 | 14.8 | ||
| July | 171.1 | 62.8 | 31.0 | 167.8 | 59.5 | 26.2 | ||
| August | 115.0 | -32.8 | 39.0 | 114.7 | -31.6 | 33.7 | ||
| September | 163.3 | 41.9 | 26.6 | 162.4 | 41.5 | 25.1 | ||
| October | 130.8 | -19.9 | -12.7 | 131.4 | -19.1 | -12.5 | ||
| November1 | 136.7 | 4.5 | -31.4 | 137.3 | 4.5 | -30.5 | ||
| 1 Provisional data | ||||||||
| Table 2 Volume Indices of Production for "Modern"2 and "Traditional"2 Sectors | Base Year: 2015=100 | |||||||
| Modern Sector | Traditional (All Other Sectors) | |||||||
| Seasonally Adjusted Indices | ||||||||
| Period | Index | % change on previous period | Annual % change | Index | % change on previous period | Annual % change | ||
| 2018 | Year | 96.4 | -5.7 | 100.7 | -2.1 | |||
| 2019 | Year | 103.5 | 7.4 | 106.2 | 5.5 | |||
| 2020 | Year | 120.8 | 16.8 | 113.2 | 6.7 | |||
| 2019 | 1st quarter | 98.7 | 4.3 | 6.2 | 107.8 | 4.5 | 11.4 | |
| 2nd quarter | 99.2 | 0.6 | 1.0 | 105.2 | -2.4 | 5.5 | ||
| 3rd quarter | 104.7 | 5.5 | 7.4 | 106.5 | 1.3 | 3.7 | ||
| 4th quarter | 105.3 | 0.6 | 11.4 | 105.1 | -1.4 | 1.9 | ||
| 2020 | 1st quarter | 110.0 | 4.4 | 11.5 | 120.9 | 15.0 | 12.1 | |
| 2nd quarter | 114.9 | 4.5 | 15.8 | 102.8 | -14.9 | -2.3 | ||
| 3rd quarter | 114.9 | -0.1 | 9.7 | 115.0 | 11.9 | 8.0 | ||
| 4th quarter | 147.7 | 28.6 | 40.2 | 113.5 | -1.3 | 8.1 | ||
| 2021 | 1st quarter | 167.5 | 13.4 | 52.3 | 112.9 | -0.5 | -6.6 | |
| 2nd quarter | 157.3 | -6.1 | 36.9 | 119.8 | 6.1 | 16.5 | ||
| 3rd quarter | 157.2 | -0.1 | 36.9 | 113.5 | -5.3 | -1.4 | ||
| 2019 | November | 102.0 | -18.0 | 8.0 | 104.9 | -2.0 | -0.3 | |
| December | 89.6 | -12.1 | 0.9 | 103.3 | -1.5 | 4.2 | ||
| 2020 | January | 101.8 | 13.5 | 5.0 | 126.0 | 21.9 | 24.1 | |
| February | 87.4 | -14.1 | -10.0 | 115.8 | -8.1 | 8.5 | ||
| March | 140.7 | 61.0 | 38.2 | 120.8 | 4.4 | 5.0 | ||
| April | 111.5 | -20.8 | 10.4 | 99.6 | -17.5 | -4.7 | ||
| May | 104.6 | -6.1 | 8.0 | 98.6 | -1.1 | -6.7 | ||
| June | 128.6 | 22.9 | 28.9 | 110.3 | 11.9 | 4.6 | ||
| July | 126.7 | -1.5 | 30.5 | 121.8 | 10.4 | 14.1 | ||
| August | 109.5 | -13.6 | 5.3 | 110.0 | -9.7 | 2.8 | ||
| September | 108.4 | -1.0 | -4.1 | 113.3 | 3.0 | 6.9 | ||
| October | 101.3 | -6.6 | -18.6 | 113.7 | 0.3 | 6.2 | ||
| November | 172.9 | 70.8 | 69.6 | 112.7 | -0.8 | 7.5 | ||
| December | 168.9 | -2.4 | 88.4 | 114.3 | 1.4 | 10.6 | ||
| 2021 | January | 166.2 | -1.6 | 63.3 | 116.6 | 2.0 | -7.4 | |
| February | 170.7 | 2.7 | 95.3 | 114.2 | -2.1 | -1.4 | ||
| March | 165.5 | -3.1 | 17.6 | 108.0 | -5.4 | -10.6 | ||
| April | 160.3 | -3.1 | 43.8 | 122.7 | 13.6 | 23.2 | ||
| May | 154.8 | -3.5 | 47.9 | 119.6 | -2.5 | 21.3 | ||
| June | 156.8 | 1.3 | 21.9 | 117.1 | -2.1 | 6.2 | ||
| July | 163.2 | 4.1 | 28.8 | 115.6 | -1.3 | -5.1 | ||
| August | 160.0 | -1.9 | 46.2 | 109.3 | -5.4 | -0.6 | ||
| September | 148.3 | -7.3 | 36.9 | 115.4 | 5.6 | 1.9 | ||
| October | 87.8 | -40.8 | -13.3 | 119.5 | 3.6 | 5.2 | ||
| November1 | 106.4 | 21.2 | -38.5 | 127.8 | 7.0 | 13.4 | ||
| 1 Provisional data | ||||||||
| 2 See Background notes for detailed breakdown | ||||||||
| Table 3a Volume Indices of Production for Industrial Sectors - Provisional Results November 2021 | Base Year: 2015=100 | ||||
| November 2021 | |||||
| Seasonally Adjusted Indices | |||||
| Industrial Sector | NACE | Index | % change on previous month | Annual % change | |
| Food products | 10 | 139.3 | 19.1 | 41.1 | |
| Meat and meat products | 101 | 126.3 | 3.5 | 5.0 | |
| Dairy products | 105 | 136.5 | -0.2 | 22.4 | |
| Bakery and farinaceous products | 107 | 97.9 | 1.1 | -3.1 | |
| Grain mill and starch products; Prepared animal feeds | 106,109 | 159.1 | 2.4 | 34.9 | |
| Other food products | 102-104,108 | 148.9 | 27.0 | 51.3 | |
| Beverages | 11 | * | * | * | |
| Textiles, wearing apparel and leather related products | 13-15 | 109.2 | -3.2 | -5.9 | |
| Wood and wood products, except furniture | 16 | 244.1 | -4.7 | 28.9 | |
| Paper and paper products; Printing and reproduction of recorded media | 17-18 | 69.0 | -6.3 | -22.8 | |
| Chemicals and chemical products | 20 | * | * | * | |
| Basic pharmaceutical products and preparations | 21 | * | * | * | |
| Rubber and plastic products | 22 | 145.7 | -12.1 | 13.7 | |
| Other non-metallic mineral products | 23 | 160.4 | 0.3 | -2.7 | |
| Basic metals and fabricated metal products | 24-25 | 132.1 | -2.0 | -2.0 | |
| Computer, electronic and optical products | 26 | * | * | * | |
| Electrical equipment | 27 | 142.3 | 7.6 | -9.6 | |
| Machinery and equipment, not elsewhere classified | 28 | * | * | * | |
| Transport equipment | 29-30 | 89.7 | 15.0 | -11.8 | |
| Tobacco, leather, coke and refined petroleum products, transport equipment, furniture, repair and installation of machinery and equipment | 12,15,19,29-31,33 | 91.7 | 6.6 | 10.6 | |
| Modern | 20,21,26,27, 182, 325 | 106.4 | 21.2 | -38.5 | |
| Traditional | All Excluding Modern | 127.8 | 7.0 | 13.4 | |
| Electricity, gas, steam and air conditioning supply | 35 | 114.4 | 2.9 | -12.4 | |
| Manufacturing industries | 10-33 | 125.4 | 36.2 | -30.7 | |
| Mining and quarrying | 05-09 | * | * | * | |
| Transportable goods industries | 05-33 | 122.8 | 37.5 | -30.3 | |
| Industries | 05-35 | 123.7 | 37.4 | -29.2 | |
| * Data suppressed for confidentiality reasons | |||||
| Table 3b Volume Indices of Production for Industrial Sectors 3 monthly - Provisional Results | Base Year: 2015=100 | ||||
| September 2021 - November 2021 | |||||
| Seasonally Adjusted Indices | |||||
| Industrial Sector | NACE | Index | % change on previous period | Annual % change | |
| Food products | 10 | 120.2 | 1.1 | 17.2 | |
| Meat and meat products | 101 | 124.4 | 0.7 | 4.0 | |
| Dairy products | 105 | 138.6 | 10.1 | 22.7 | |
| Bakery and farinaceous products | 107 | 98.2 | -2.0 | -3.0 | |
| Grain mill and starch products; Prepared animal feeds | 106,109 | 154.8 | 23.4 | 31.7 | |
| Other food products | 102-104,108 | 120.7 | 1.2 | 19.9 | |
| Beverages | 11 | * | * | * | |
| Textiles, wearing apparel and leather related products | 13-15 | 110.7 | -10.4 | -2.1 | |
| Wood and wood products, except furniture | 16 | 253.9 | 41.9 | 43.8 | |
| Paper and paper products; Printing and reproduction of recorded media | 17-18 | 72.0 | 0.2 | -15.0 | |
| Chemicals and chemical products | 20 | * | * | * | |
| Basic pharmaceutical products and preparations | 21 | * | * | * | |
| Rubber and plastic products | 22 | 153.3 | 5.1 | 17.9 | |
| Other non-metallic mineral products | 23 | 163.0 | 5.7 | 1.3 | |
| Basic metals and fabricated metal products | 24-25 | 132.8 | 13.6 | 7.4 | |
| Computer, electronic and optical products | 26 | * | * | * | |
| Electrical equipment | 27 | 138.0 | -5.2 | -12.7 | |
| Machinery and equipment, not elsewhere classified | 28 | * | * | * | |
| Transport equipment | 29-30 | 80.5 | 8.6 | -24.6 | |
| Tobacco, leather, coke and refined petroleum products, transport equipment, furniture, repair and installation of machinery and equipment | 12,15,19,29-31,33 | 87.5 | -6.0 | 0.1 | |
| Modern | 20,21,26,27,182, 325 | 114.2 | -28.7 | -10.5 | |
| Traditional | All Excluding Modern | 120.9 | 6.1 | 6.8 | |
| Electricity, gas, steam and air conditioning supply | 35 | 113.6 | 73.4 | -14.9 | |
| Manufacturing industries | 10-33 | 117.0 | -16.7 | -9.7 | |
| Mining and quarrying | 05-09 | * | * | * | |
| Transportable goods industries | 05-33 | 114.0 | -17.6 | -9.8 | |
| Industries | 05-35 | 115.5 | -19.3 | -9.1 | |
| * Data suppressed for confidentiality reasons | |||||
| Table 3c Volume Indices of Production for Industrial Sectors - Final Results October 2021 | Base Year: 2015=100 | ||||
| October 2021 | |||||
| Seasonally Adjusted Indices | |||||
| Industrial Sector | NACE | Index | % change on previous month | Annual % change | |
| Food products | 10 | 116.9 | 12.0 | 10.2 | |
| Meat and meat products | 101 | 122.0 | -2.4 | 1.5 | |
| Dairy products | 105 | 136.8 | -4.0 | 23.0 | |
| Bakery and farinaceous products | 107 | 96.8 | -3.1 | -4.0 | |
| Grain mill and starch products; Prepared animal feeds | 106,109 | 155.5 | 3.7 | 31.5 | |
| Other food products | 102-104,108 | 117.3 | 22.1 | 11.4 | |
| Beverages | 11 | * | * | * | |
| Textiles, wearing apparel and leather related products | 13-15 | 112.8 | 2.4 | 0.5 | |
| Wood and wood products, except furniture | 16 | 256.1 | -2.0 | 45.2 | |
| Paper and paper products; Printing and reproduction of recorded media | 17-18 | 73.7 | 0.6 | -8.0 | |
| Chemicals and chemical products | 20 | * | * | * | |
| Basic pharmaceutical products and preparations | 21 | * | * | * | |
| Rubber and plastic products | 22 | 165.8 | 11.8 | 11.9 | |
| Other non-metallic mineral products | 23 | 159.8 | -5.3 | -3.6 | |
| Basic metals and fabricated metal products | 24-25 | 134.7 | 2.4 | 20.9 | |
| Computer, electronic and optical products | 26 | * | * | * | |
| Electrical equipment | 27 | 132.2 | -5.1 | -15.3 | |
| Machinery and equipment, not elsewhere classified | 28 | * | * | * | |
| Transport equipment | 29-30 | 78.0 | 5.6 | -28.8 | |
| Tobacco, leather, coke and refined petroleum products, transport equipment, furniture, repair and installation of machinery and equipment | 12,15,19,29-31,33 | 86.1 | 1.7 | -3.5 | |
| Modern | 20,21,26,27,182, 325 | 87.8 | -40.8 | -13.3 | |
| Traditional | All Excluding Modern | 119.5 | 3.6 | 5.2 | |
| Electricity, gas, steam and air conditioning supply | 35 | 111.1 | -3.5 | -15.6 | |
| Manufacturing industries | 10-33 | 92.1 | -31.0 | -10.0 | |
| Mining and quarrying | 05-09 | * | * | * | |
| Transportable goods industries | 05-33 | 89.3 | -31.1 | -10.5 | |
| Industries | 05-35 | 90.1 | -32.1 | -10.9 | |
| * Data suppressed for confidentiality reasons | |||||
| Table 4 Industrial Turnover Indices | Base Year: 2015=100 | |||||||
| Manufacturing Industries | Transportable Goods Industries2 | |||||||
| NACE 10 - 33 | NACE 05 - 33 | |||||||
| Seasonally Adjusted Indices | ||||||||
| Period | Index | % change on previous period | Annual % change | Index | % change on previous period | Annual % change | ||
| 2018 | Year | 98.2 | 0.5 | 98.6 | 0.8 | |||
| 2019 | Year | 99.9 | 1.8 | 100.2 | 1.6 | |||
| 2020 | Year | 101.8 | 1.9 | 102.1 | 2.0 | |||
| 2019 | 1st quarter | 99.7 | -0.5 | 5.1 | 100.0 | -0.5 | 5.1 | |
| 2nd quarter | 96.7 | -3.0 | -1.0 | 97.0 | -3.1 | -1.1 | ||
| 3rd quarter | 97.1 | 0.4 | -3.1 | 97.3 | 0.3 | -3.4 | ||
| 4th quarter | 105.5 | 8.7 | 5.3 | 105.7 | 8.7 | 5.0 | ||
| 2020 | 1st quarter | 101.9 | -3.4 | 2.2 | 102.1 | -3.4 | 2.1 | |
| 2nd quarter | 101.9 | 0.1 | 5.4 | 102.3 | 0.1 | 5.4 | ||
| 3rd quarter | 95.7 | -6.1 | -1.4 | 96.1 | -6.0 | -1.1 | ||
| 4th quarter | 110.1 | 15.1 | 4.4 | 110.5 | 14.9 | 4.6 | ||
| 2021 | 1st quarter | 117.7 | 6.8 | 15.5 | 118.0 | 6.8 | 15.5 | |
| 2nd quarter | 124.0 | 5.4 | 21.7 | 124.6 | 5.6 | 21.9 | ||
| 3rd quarter | 130.6 | 5.3 | 36.5 | 131.1 | 5.2 | 36.3 | ||
| 2019 | November | 97.8 | -21.8 | 0.4 | 98.0 | -21.6 | 0.2 | |
| December | 93.8 | -4.0 | -2.8 | 94.1 | -4.0 | -2.9 | ||
| 2020 | January | 101.9 | 8.7 | 6.7 | 102.2 | 8.7 | 6.4 | |
| February | 82.1 | -19.5 | -17.3 | 82.4 | -19.4 | -17.3 | ||
| March | 121.6 | 48.1 | 16.7 | 121.8 | 47.8 | 16.6 | ||
| April | 100.9 | -17.0 | -1.9 | 100.9 | -17.2 | -2.3 | ||
| May | 95.2 | -5.6 | 0.9 | 95.7 | -5.2 | 0.9 | ||
| June | 109.6 | 15.1 | 18.1 | 110.2 | 15.2 | 18.6 | ||
| July | 107.8 | -1.7 | 11.5 | 108.2 | -1.8 | 11.7 | ||
| August | 99.5 | -7.7 | 4.2 | 99.9 | -7.7 | 4.4 | ||
| September | 79.8 | -19.8 | -19.4 | 80.3 | -19.6 | -19.0 | ||
| October | 101.5 | 27.2 | -18.7 | 102.0 | 26.9 | -18.4 | ||
| November | 121.1 | 19.2 | 23.8 | 121.4 | 19.1 | 23.9 | ||
| December | 107.8 | -11.0 | 14.9 | 108.2 | -10.9 | 15.0 | ||
| 2021 | January | 116.5 | 8.1 | 14.3 | 116.7 | 7.9 | 14.2 | |
| February | 121.5 | 4.2 | 48.0 | 121.8 | 4.3 | 47.8 | ||
| March | 115.0 | -5.3 | -5.4 | 115.5 | -5.2 | -5.2 | ||
| April | 125.8 | 9.4 | 24.7 | 126.6 | 9.6 | 25.5 | ||
| May | 128.0 | 1.7 | 34.4 | 128.5 | 1.5 | 34.3 | ||
| June | 118.3 | -7.6 | 7.9 | 118.8 | -7.5 | 7.8 | ||
| July | 128.3 | 8.5 | 19.1 | 128.7 | 8.3 | 18.9 | ||
| August | 133.3 | 3.9 | 34.0 | 133.8 | 4.0 | 34.0 | ||
| September | 130.1 | -2.4 | 63.0 | 130.7 | -2.3 | 62.7 | ||
| October | 127.3 | -2.2 | 25.4 | 127.7 | -2.3 | 25.2 | ||
| November1 | 128.7 | 1.1 | 6.3 | 129.3 | 1.2 | 6.5 | ||
| 1 Provisional data | ||||||||
| 2 See Background notes for detailed breakdown | ||||||||
| Table 4a Industrial Turnover Indices | Base Year: 2015=100 | |||||||
| Manufacturing Industries | Transportable Goods Industries2 | |||||||
| NACE 10 - 33 | NACE 05 - 33 | |||||||
| Seasonally Unadjusted Indices | ||||||||
| Period | Index | % change on previous period | Annual % change | Index | % change on previous period | Annual % change | ||
| 2018 | Year | 98.2 | 0.5 | 98.6 | 0.8 | |||
| 2019 | Year | 99.9 | 1.8 | 100.2 | 1.6 | |||
| 2020 | Year | 101.8 | 1.9 | 102.1 | 2.0 | |||
| 2019 | 1st quarter | 97.1 | -8.6 | 4.7 | 97.5 | -8.6 | 4.7 | |
| 2nd quarter | 91.0 | -6.3 | -0.7 | 91.3 | -6.4 | -0.8 | ||
| 3rd quarter | 100.9 | 11.0 | -1.1 | 101.2 | 10.9 | -1.4 | ||
| 4th quarter | 110.6 | 9.5 | 4.1 | 110.8 | 9.5 | 3.8 | ||
| 2020 | 1st quarter | 100.1 | -9.5 | 3.0 | 100.2 | -9.5 | 2.9 | |
| 2nd quarter | 95.1 | -4.9 | 4.6 | 95.4 | -4.8 | 4.6 | ||
| 3rd quarter | 99.5 | 4.5 | -1.5 | 100.0 | 4.8 | -1.2 | ||
| 4th quarter | 112.5 | 13.2 | 1.8 | 112.9 | 13.0 | 2.0 | ||
| 2021 | 1st quarter | 116.5 | 3.6 | 16.5 | 116.7 | 3.4 | 16.4 | |
| 2nd quarter | 116.4 | -0.1 | 22.4 | 117.0 | 0.2 | 22.6 | ||
| 3rd quarter | 138.3 | 18.8 | 39.0 | 138.8 | 18.6 | 38.9 | ||
| 2019 | November | 108.9 | -23.1 | -3.6 | 109.1 | -23.1 | -2.5 | |
| December | 81.1 | -25.6 | 2.1 | 81.3 | -25.5 | 2.7 | ||
| 2020 | January | 117.0 | 44.3 | 8.4 | 117.2 | 44.1 | 8.1 | |
| February | 76.0 | -35.1 | -15.6 | 76.2 | -35.0 | -15.7 | ||
| March | 107.2 | 41.1 | 14.8 | 107.4 | 41.0 | 14.7 | ||
| April | 109.8 | 2.5 | 0.2 | 109.7 | 2.1 | -0.1 | ||
| May | 84.5 | -23.1 | 0.4 | 84.9 | -22.6 | 0.4 | ||
| June | 91.0 | 7.7 | 15.0 | 91.7 | 8.0 | 15.5 | ||
| July | 115.9 | 27.3 | 12.8 | 116.3 | 26.9 | 13.0 | ||
| August | 83.4 | -28.0 | 4.9 | 83.9 | -27.9 | 5.1 | ||
| September | 99.0 | 18.7 | -17.9 | 99.6 | 18.7 | -17.5 | ||
| October | 112.7 | 13.8 | -20.5 | 113.3 | 13.7 | -20.1 | ||
| November | 134.5 | 19.3 | 23.4 | 134.7 | 19.0 | 23.5 | ||
| December | 90.4 | -32.8 | 11.5 | 90.7 | -32.7 | 11.6 | ||
| 2021 | January | 135.1 | 49.5 | 15.5 | 135.1 | 48.9 | 15.3 | |
| February | 114.3 | -15.4 | 50.5 | 114.5 | -15.3 | 50.3 | ||
| March | 100.1 | -12.4 | -6.6 | 100.6 | -12.1 | -6.3 | ||
| April | 138.8 | 38.6 | 26.3 | 139.5 | 38.7 | 27.1 | ||
| May | 113.3 | -18.4 | 34.1 | 113.7 | -18.4 | 34.0 | ||
| June | 97.2 | -14.2 | 6.8 | 97.8 | -14.0 | 6.7 | ||
| July | 139.5 | 43.6 | 20.4 | 139.9 | 43.0 | 20.2 | ||
| August | 112.0 | -19.7 | 34.3 | 112.7 | -19.4 | 34.3 | ||
| September | 163.2 | 45.6 | 64.8 | 163.9 | 45.4 | 64.5 | ||
| October | 138.5 | -15.1 | 22.8 | 139.0 | -15.2 | 22.7 | ||
| November1 | 142.8 | 3.1 | 6.2 | 143.3 | 3.1 | 6.3 | ||
| 1 Provisional data | ||||||||
| 2 See Background notes for detailed breakdown | ||||||||
| Table 5a Turnover Indices for Industrial Sectors - Provisional Results November 2021 | Base Year: 2015=100 | ||||
| November 2021 | |||||
| Seasonally Adjusted Indices | |||||
| Industrial Sector | NACE | Index | % change on previous month | Annual % change | |
| Food products | 10 | 145.9 | 16.0 | 37.1 | |
| Meat and meat products | 101 | 125.9 | 4.2 | 13.5 | |
| Dairy products | 105 | 174.3 | 6.6 | 39.7 | |
| Bakery and farinaceous products | 107 | 102.8 | 1.0 | 7.3 | |
| Grain mill and starch products; Prepared animal feeds | 106,109 | 142.0 | 1.5 | 24.8 | |
| Other food products | 102-104,108 | 141.3 | 25.1 | 53.6 | |
| Beverages | 11 | * | * | * | |
| Textiles, wearing apparel and leather related products | 13-15 | 130.7 | -6.1 | -1.8 | |
| Wood and wood products, except furniture | 16 | 171.4 | -2.4 | 26.8 | |
| Paper and paper products; Printing and reproduction of recorded media | 17-18 | 86.0 | 0.3 | -18.8 | |
| Chemicals and chemical products | 20 | * | * | * | |
| Basic pharmaceutical products and preparations | 21 | * | * | * | |
| Rubber and plastic products | 22 | 147.9 | -8.6 | 26.8 | |
| Other non-metallic mineral products | 23 | 169.5 | 1.4 | 7.5 | |
| Basic metals and fabricated metal products | 24-25 | 140.0 | -0.8 | 11.9 | |
| Computer, electronic and optical products | 26 | * | * | * | |
| Electrical equipment | 27 | 133.3 | -5.2 | -12.9 | |
| Machinery and equipment, not elsewhere classified | 28 | * | * | * | |
| Transport equipment | 29-30 | 83.1 | 6.4 | -23.1 | |
| Tobacco, leather, coke and refined petroleum products, transport equipment, furniture, repair and installation of machinery and equipment | 12,15,19,29-31,33 | 103.2 | -4.3 | 21.9 | |
| Electricity, gas, steam and air conditioning supply | 35 | .. | .. | .. | |
| Manufacturing industries | 10-33 | 128.7 | 1.1 | 6.3 | |
| Mining and quarrying | 05-09 | 251.5 | 0.9 | 28.5 | |
| Transportable goods industries | 05-33 | 129.3 | 1.2 | 6.5 | |
| Industries | 05-35 | .. | .. | .. | |
| * Data suppressed for confidentiality reasons | |||||
| .. Data not available | |||||
| Table 5b Turnover Indices for Industrial Sectors 3 monthly - Provisional Results | Base Year: 2015=100 | ||||
| September 2021 - November 2021 | |||||
| Seasonally Adjusted Indices | |||||
| Industrial Sector | NACE | Index | % change on previous period | Annual % change | |
| Food products | 10 | 128.2 | 3.5 | 19.5 | |
| Meat and meat products | 101 | 123.8 | 0.4 | 12.5 | |
| Dairy products | 105 | 163.9 | 4.3 | 27.7 | |
| Bakery and farinaceous products | 107 | 102.8 | 5.0 | 7.0 | |
| Grain mill and starch products; Prepared animal feeds | 106,109 | 140.4 | -1.0 | 25.0 | |
| Other food products | 102-104,108 | 115.6 | 4.3 | 19.1 | |
| Beverages | 11 | * | * | * | |
| Textiles, wearing apparel and leather related products | 13-15 | 132.3 | -24.2 | -2.2 | |
| Wood and wood products, except furniture | 16 | 177.6 | 12.9 | 39.1 | |
| Paper and paper products; Printing and reproduction of recorded media | 17-18 | 84.4 | 4.7 | -18.2 | |
| Chemicals and chemical products | 20 | * | * | * | |
| Basic pharmaceutical products and preparations | 21 | * | * | * | |
| Rubber and plastic products | 22 | 156.0 | 2.5 | 33.0 | |
| Other non-metallic mineral products | 23 | 169.7 | 1.4 | 9.9 | |
| Basic metals and fabricated metal products | 24-25 | 138.9 | 7.9 | 15.6 | |
| Computer, electronic and optical products | 26 | * | * | * | |
| Electrical equipment | 27 | 137.2 | -2.2 | -9.1 | |
| Machinery and equipment, not elsewhere classified | 28 | * | * | * | |
| Transport equipment | 29-30 | 78.0 | -2.1 | -28.7 | |
| Tobacco, leather, coke and refined petroleum products, transport equipment, furniture, repair and installation of machinery and equipment | 12,15,19,29-31,33 | 99.0 | -7.3 | 15.4 | |
| Electricity, gas, steam and air conditioning supply | 35 | .. | .. | .. | |
| Manufacturing industries | 10-33 | 128.7 | 1.7 | 27.7 | |
| Mining and quarrying | 05-09 | 264.1 | 2.0 | 25.1 | |
| Transportable goods industries | 05-33 | 129.2 | 1.7 | 27.7 | |
| Industries | 05-35 | .. | .. | .. | |
| * Data suppressed for confidentiality reasons | |||||
| .. Data not available | |||||
| Table 5c Turnover Indices for Industrial Sectors - Final Results October 2021 | Base Year: 2015=100 | ||||
| October 2021 | |||||
| Seasonally Adjusted Indices | |||||
| Industrial Sector | NACE | Index | % change on previous month | Annual % change | |
| Food products | 10 | 125.8 | 11.3 | 16.7 | |
| Meat and meat products | 101 | 120.9 | -2.9 | 9.3 | |
| Dairy products | 105 | 163.5 | 6.2 | 26.3 | |
| Bakery and farinaceous products | 107 | 101.8 | -2.1 | 6.1 | |
| Grain mill and starch products; Prepared animal feeds | 106,109 | 139.9 | 0.4 | 22.7 | |
| Other food products | 102-104,108 | 113.0 | 22.1 | 12.5 | |
| Beverages | 11 | * | * | * | |
| Textiles, wearing apparel and leather related products | 13-15 | 139.2 | 9.7 | 4.6 | |
| Wood and wood products, except furniture | 16 | 175.5 | -5.6 | 39.5 | |
| Paper and paper products; Printing and reproduction of recorded media | 17-18 | 85.7 | 5.2 | -15.0 | |
| Chemicals and chemical products | 20 | * | * | * | |
| Basic pharmaceutical products and preparations | 21 | * | * | * | |
| Rubber and plastic products | 22 | 161.8 | 2.1 | 30.6 | |
| Other non-metallic mineral products | 23 | 167.1 | -3.2 | 5.5 | |
| Basic metals and fabricated metal products | 24-25 | 141.1 | 4.1 | 29.5 | |
| Computer, electronic and optical products | 26 | * | * | * | |
| Electrical equipment | 27 | 140.7 | 2.3 | -4.2 | |
| Machinery and equipment, not elsewhere classified | 28 | * | * | * | |
| Transport equipment | 29-30 | 78.0 | 6.9 | -27.8 | |
| Tobacco, leather, coke and refined petroleum products, transport equipment, furniture, repair and installation of machinery and equipment | 12,15,19,29-31,33 | 107.8 | 25.5 | 23.1 | |
| Electricity, gas, steam and air conditioning supply | 35 | .. | .. | .. | |
| Manufacturing industries | 10-33 | 127.3 | -2.2 | 25.4 | |
| Mining and quarrying | 05-09 | 249.4 | -14.5 | 12.1 | |
| Transportable goods industries | 05-33 | 127.7 | -2.3 | 25.2 | |
| Industries | 05-35 | .. | .. | .. | |
| * Data suppressed for confidentiality reasons | |||||
| .. Data not available | |||||
Industrial Production and Turnover (IPT) monitors the volume of production and value of turnover of industrial local units. Two indices are compiled from the survey – the monthly index of production and the monthly index of turnover.
The monthly index of production measures the change in the volume of production (i.e. value added at constant prices) each month.
The monthly index of turnover measures the change in the level of sales each month of industrial products, whether manufactured in the month in question or in previous periods (excluding non-industrial activity where practicable). The turnover indices outlined in this release are exclusive of VAT.
The principal difference between the production and turnover indices is that the production index traces the quantitative volume of production (i.e. with the effect of price changes excluded) each month whether sold or not, whereas the turnover index reflects both the volume of sales and the price level.
Starting with January 2015 updated industrial production and turnover indices are being published to base year 2015=100.
Industrial Production and Turnover covers all the larger local units which between them account for the bulk of industrial output – in general those which in the base year 2015 had twenty or more persons engaged in NACE divisions 5 to 35. For certain sectors the threshold of 20 persons engaged is lowered where this is considered necessary to ensure representativeness of the sample or where data for a sector would have to be kept confidential if a threshold at 20 persons engaged was applied. The business activity classifications are based on the Statistical Classification of Economic Activities in the European Community (NACE Rev. 2).
The provisional results are published about 40 days after the reference month. At that point, the response rates are typically 46% of local units surveyed covering 84% of the value of production and 82% of the value of turnover. The corresponding figures for the final results, one month later, are 66%, 95% and 94% respectively. These response rates are based on averages for the 12 months of 2017.
Individual turnover sub-indices are compiled for each detailed NACE class (i.e. NACE 4-digit level). These sub-indices are combined to provide the indices for broader sectoral groupings (NACE 2-digit and groupings of NACE) using the turnover as the weight. The production indices are created in the same way but use the gross value added at factor cost (GVA) as the weight. The production indices are calculated at constant prices, using the Wholesale Price Index (Base 2015 = 100) as deflators. The GVA and turnover weights are from the 2015 Census of Industrial Production (CIP). The weights and base year are revised every five years.
The level shift of 26% in GDP in 2015 was driven by relocations of entire balance sheets to Ireland, with the activity related to these relocations having consequential impacts on the corresponding annual and monthly industrial statistics. These relocated balance sheets were dominated by intellectual property. The practice of relocating intellectual property to Ireland has been growing in recent years, but the scale of the relocations in 2015 was substantial and added €300 billion to Ireland’s capital stocks.
Associated with the relocations were significant increases in contract manufacturing activity attributable to Ireland. While contract manufacturing and outsourcing arrangements – both by Irish and foreign-owned enterprises - were not new per se, the level of increase seen in 2015 was substantially greater than in previous years. The Index of Industrial Production increased by 33% between 2014 and 2015.
The CSO’s treatment of contract manufacturing in the IPT follows the definitions set out in the UN 2010 International Recommendations for the Index of Industrial Production. The relevant section of the UN recommendations, on the treatment of outsourcing activities is as follows:
"Outsourcing of parts of the production process
If only part of the production process is outsourced, the principal is classified to the ISIC class that corresponds to the activity representing the complete production process, i.e., it is classified as if it were carrying out the complete process, including the contracted work, itself.
This applies not only to the outsourcing of support functions in the production process, such as accounting or computing activities, but also to the outsourcing of parts of the core production process, such as parts of a manufacturing process.
Outsourcing of the complete production process
In general, if the principal outsources the complete production process of a good or service, it is classified as if it were carrying out the production process itself. This applies in particular to all service-producing activities, including construction.
In the case of manufacturing, however, the following special considerations apply. In manufacturing, the principal provides the contractor with the technical specifications of the manufacturing activity to be carried out on the input materials. The input materials (raw materials or intermediate goods) can either be provided (owned) by the principal or not.
A principal who completely outsources the transformation process should be classified into manufacturing if and only if it owns the input materials to the production process – and therefore owns the final output."
On the basis of these recommendations outsourced production is included as part of an enterprise’s Irish production. The inverse (i.e. Irish companies being sub-contracted to produce for foreign companies) has been excluded to avoid double counting.
The PRODCOM annual survey provides statistics on domestic production sold in Ireland annually.
Seasonal adjustment is conducted using the direct seasonal adjustment approach. Under this approach each individual series is independently adjusted, i.e. aggregate series are adjusted without reference to the component series. Seasonal adjustment models are developed for each series based on unadjusted data spanning the months from January 2000 to the current period. These models are then applied to the entire series. Seasonal factors are updated each month.
The adjustments are completed by applying the X-13-ARIMA model, developed by the U.S. Census Bureau to the unadjusted data. This methodology estimates seasonal factors while also taking into consideration factors that impact on the quality of the seasonal adjustment such as:
• Calendar effects, e.g. the timing of Easter
• Outliers, temporary changes and level shifts in the series
For additional information on the use of X-13-ARIMA see https://www.census.gov/srd/www/winx13/
The business activity classifications used in this Statistical release are based on the Statistical Classification of Economic Activities in the European Community i.e. NACE Rev. 2. For further information on the NACE Rev. 2 classification of industrial activity, see NACE Coder.
Definitions
"All Industries"
All industries are comprised of all sectors classified NACE 05 to 35 inclusive. This includes Mining and quarrying NACE 05 to 09, Manufacturing Industries NACE 10 to 33, Electricity, gas, steam and air conditioning supply NACE 35.
"Manufacturing Industries"
Manufacturing Industries is comprised of all sectors classified NACE 10 to 33 inclusive.
"Transportable Goods Industries"
Transportable Goods Industries is comprised of all sectors classified NACE 05 to 33 inclusive. This includes Mining and quarrying NACE 05 to 09 and Manufacturing Industries NACE 10 to 33.
“Modern” Sector
The Modern Sector includes the following industrial sectors:
NACE 20.00 - 21.20 Chemicals and pharmaceuticals
NACE 26.00 - 27.90 Computer, electronic, optical and electrical equipment
NACE 18.20 Reproduction of recorded media
NACE 32.50 Medical and dental instruments and supplies
"Traditional” Sector
The Traditional Sector includes All Industries (NACE 05 to 35) excluding the “Modern” sector as detailed above.
The wholesale price indices were revised in March 2018 to include updated weights (base year = 2015). New base year weights were compiled for the Wholesale Price Index using the results of the 2015 Census of Industrial Production (CIP) and the Prodcom Inquiry surveys. New base weights were applied to each three digit NACE group on the basis of the Census of Industrial Production and the commodity group weights were assigned on the basis of the Prodcom Inquiry. For further information on the updated WPI indices see the CSO publication Revised Wholesale Price Index Introduction to Series 2015=100 (PDF 416KB) .
 Hide Background Notes
Scan the QR code below to view this release online or go to
http://www.cso.ie/en/releasesandpublications/er/ipt/industrialproductionandturnovernovember2021/
 Show Table 1 Volume Indices of Production - Seasonally Adjusted
 Hide Table 1 Volume Indices of Production - Seasonally Adjusted