
| Disputes in Progress | |||
| Disputes | Workers | Days lost | |
| Quarter | |||
| Q4 2014 | 3 | 27,092 | 24,777 |
| Q3 2015 | 0 | 0 | 0 |
| Q4 2015 | 2 | 72 | 116 |
| Year | |||
| 2014 | 11 | 31,665 | 44,015 |
| 2015 | 9 | 37,760 | 32,964 |
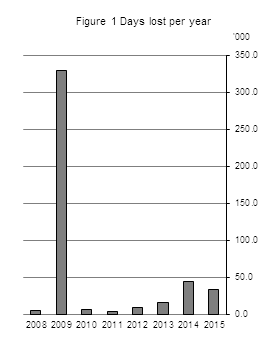
During 2015 there were 32,964 days lost to industrial disputes. This compares with 44,015 days lost in 2014. See table 3 and figure 1.
There were a total of nine industrial disputes in 2015 compared with eleven in 2014. The nine disputes in progress in 2015 involved 37,760 workers and nine firms, whereas 31,665 workers and eleven firms were involved in industrial disputes in 2014. See table 3.
Three disputes in the Education sector accounted for 73% of the days lost in 2015, with 23,960 of the 32,964 total days lost. See table 2.
| Table 1 Industrial Disputes which began or were in progress in the fourth quarter of 2015 | |||||
| Disputes in progress during Q4 2015 | |||||
| Economic sector (NACE Rev. 2) | Disputes which began in Q4 2015 | Number of disputes | Number of firms | Number of workers | Total days lost |
| A Agriculture, forestry and fishing | - | - | - | - | - |
| B-E Industry | - | - | - | - | - |
| F Construction | - | - | - | - | - |
| G Wholesale and retail trade; repair of motor vehicles and motorcycles | - | - | - | - | - |
| H Transportation and storage | - | - | - | - | - |
| I Accommodation and food service activities | - | - | - | - | - |
| J Information and communication | - | - | - | - | - |
| K-L Financial, insurance and real estate activities | - | - | - | - | - |
| M Professional, scientific and technical activities | 1 | 1 | 1 | 34 | 89 |
| N Administrative and support service activities | 1 | 1 | 1 | 38 | 27 |
| O Public administration and defence; compulsory social security | - | - | - | - | - |
| P Education | - | - | - | - | - |
| Q Human health and social work activities | - | - | - | - | - |
| R-U Other NACE activities | - | - | - | - | - |
| All NACE Economic Sectors Q4 2015 | 2 | 2 | 2 | 72 | 116 |
| Table 2 Industrial Disputes which began or were in progress in 2015 | |||||
| Disputes in progress during 2015 | |||||
| Economic sector (NACE Rev. 2) | Disputes which began in 2015 | Number of disputes | Number of firms | Number of workers | Total days lost |
| A Agriculture, forestry and fishing | - | - | - | - | - |
| B-E Industry | - | - | - | - | - |
| F Construction | - | 1 | 1 | 14 | 466 |
| G Wholesale and retail trade; repair of motor vehicles and motorcycles | 1 | 1 | 1 | 6,000 | 2,678 |
| H Transportation and storage | 1 | 1 | 1 | 4,000 | 5,714 |
| I Accommodation and food service activities | - | - | - | - | - |
| J Information and communication | - | - | - | - | - |
| K-L Financial, insurance and real estate activities | - | - | - | - | - |
| M Professional, scientific and technical activities | 1 | 1 | 1 | 34 | 89 |
| N Administrative and support service activities | 2 | 2 | 2 | 52 | 57 |
| O Public administration and defence; compulsory social security | - | - | - | - | - |
| P Education | 1 | 3 | 3 | 27,660 | 23,960 |
| Q Human health and social work activities | - | - | - | - | - |
| R-U Other NACE activities | - | - | - | - | - |
| All NACE Economic Sectors 2015 | 6 | 9 | 9 | 37,760 | 32,964 |
| Table 3 Industrial Disputes which began or were in progress in each quarter, 2010-2015 | ||||||
| Disputes in progress | ||||||
| Year | Quarter | Disputes which began1 | Number of disputes 2 | Number of firms involved 2 | Number of workers involved 2 | Total days lost |
| 2010 | Quarter 1 | 6 | 8 | 8 | 330 | 4,217 |
| Quarter 2 | 2 | 3 | 3 | 22 | 1,136 | |
| Quarter 3 | 3 | 4 | 4 | 156 | 1,222 | |
| Quarter 4 | 1 | 1 | 1 | 31 | 27 | |
| Total 2010 | 12 | 14 | 14 | 511 | 6,602 | |
| 2011 | Quarter 1 | 3 | 3 | 3 | 335 | 2,451 |
| Quarter 2 | 2 | 3 | 3 | 462 | 572 | |
| Quarter 3 | 1 | 1 | 1 | 17 | 93 | |
| Quarter 4 | 2 | 2 | 2 | 580 | 579 | |
| Total 2011 | 8 | 8 | 8 | 1,384 | 3,695 | |
| 2012 | Quarter 1 | 1 | 1 | 1 | 75 | 161 |
| Quarter 2 | 3 | 3 | 3 | 1,445 | 7,754 | |
| Quarter 3 | 1 | 1 | 1 | 400 | 571 | |
| Quarter 4 | 0 | 0 | 0 | 0 | 0 | |
| Total 2012 | 5 | 5 | 5 | 1,920 | 8,486 | |
| 2013 | Quarter 1 | 2 | 2 | 2 | 107 | 228 |
| Quarter 2 | 3 | 3 | 3 | 2,408 | 3,417 | |
| Quarter 3 | 3 | 4 | 4 | 3,032 | 6,718 | |
| Quarter 4 | 4 | 5 | 5 | 6,394 | 4,602 | |
| Total 2013 | 12 | 12 | 12 | 11,924 | 14,965 | |
| 2014 | Quarter 1 | 2 | 2 | 2 | 178 | 310 |
| Quarter 2 | 6 | 7 | 7 | 1,681 | 8,014 | |
| Quarter 3 | 2 | 4 | 4 | 3,412 | 10,914 | |
| Quarter 4 | 1 | 3 | 3 | 27,092 | 24,777 | |
| Total 2014 | 11 | 11 | 11 | 31,665 | 44,015 | |
| 2015 | Quarter 1 | 2 | 4 | 4 | 27,588 | 24,056 |
| Quarter 2 | 2 | 3 | 3 | 10,100 | 8,792 | |
| Quarter 3 | 0 | 0 | 0 | 0 | 0 | |
| Quarter 4 | 2 | 2 | 2 | 72 | 116 | |
| Total 2015 | 6 | 9 | 9 | 37,760 | 32,964 | |
| 1 See Scope and Days Lost in Background Notes for more information on criteria for inclusion of disputes. | ||||||
| 2 The quarterly totals in these columns will not always add to the annual total since an Industrial Dispute can be in progress in more than one quarter. | ||||||
Sources
The information on Industrial Disputes is based on details supplied by the Industrial Relations Section, Department of Jobs, Enterprise and Innovation and on information collected directly from other sources by the Central Statistics Office.
Scope
Disputes are included in this release if they involve a stoppage of work lasting for at least one day and the total time lost is 10 or more person-days.
Days Lost
In calculating days lost, it is assumed that work would have continued if no dispute had occurred. No allowance is made for loss of work from unemployment or other causes (such as bad weather) which might have happened even if there was no dispute. The number of days lost is calculated by multiplying the number of persons involved by the number of normal working days during which they were involved in the dispute. Persons working for approximately 40 hours per week are assumed to be working the equivalent of a 5 day week even if the work is spread over more than 5 days.
Disputes in Progress
The tables show data on disputes which began and disputes which were in progress in each quarter. The quarterly figures for the number of disputes in progress and for the number of firms and workers involved will not always add to the annual total, since an industrial dispute can be in progress in more than one quarter.
Reference Quarters
The reference quarters for Industrial Disputes results are:
Q1 - January to March, Q2 - April to June, Q3 - July to September and Q4 - October to December.
 Hide Background Notes
Scan the QR code below to view this release online or go to
http://www.cso.ie/en/releasesandpublications/er/id/industrialdisputesquarter42015/
 Show Table 1 Industrial Disputes which began or were in progress in the fourth quarter of 2015
 Hide Table 1 Industrial Disputes which began or were in progress in the fourth quarter of 2015