
| Table A: Food and Garden Waste Disposal by Urban or Rural Location, Quarter 3 20211 | |||||||
| % of weighted households | |||||||
| Organic (brown) bin | General waste bin | Compost at home | Feed to animals | ||||
| Food waste | |||||||
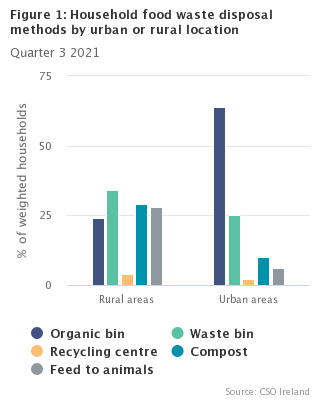
| Rural | 24% | 34% | 29% | 28% | |||
| Urban | 64% | 25% | 10% | 6% | |||
| Garden waste | |||||||
| Rural | 10% | 5% | 69% | - | |||
| Urban | 52% | 9% | 22% | - | |||
| 1 More than one method could be selected | |||||||
Some of the main findings from the CSO Household Environmental Behaviours survey on Waste and Recycling are:
Table A shows a breakdown of food and garden waste disposal methods by urban or rural location. Urban households were more likely to dispose of their food and garden waste using an organic (brown) bin collection service, with 64% and 52% of urban households using the organic bin for food and garden waste respectively, compared with 24% (food waste) and 10% (garden waste) for rural households.
Rural households were more likely to dispose of their food waste by using the general waste bin (34%), by composting it at home (29%) or by feeding it to animals (28%). Around 69% of rural households composted their garden waste, compared with 22% of urban households.
The most common method of disposing of recyclable household waste was through use of a recyclables wheelie bin collection service with 78% of households using this method nationally (see Table 2). A further 11% of households brought their recyclable waste to a recycling centre while 5% shared a recyclables bin with a neighbour, relative or friend. Only 1% of households responded that they did not recycle.
Figure 2 shows a breakdown by region of methods of disposing of recyclable household waste.
| Other | Do not recycle | Recyclables pre-paid bag collection | Share recyclables bin with neighbour, relative or friend | Bring to recycling centre | Recyclables wheelie bin collection | |
| Border | 0 | 1 | 1 | 3 | 16 | 73 |
| Dublin | 1 | 1 | 3 | 6 | 5 | 81 |
| Mid-East | 1 | 0 | 0 | 3 | 7 | 85 |
| Mid-West | 2 | 0 | 0 | 8 | 13 | 75 |
| Midland | 3 | 0 | 1 | 2 | 16 | 73 |
| South-East | 0 | 1 | 1 | 4 | 16 | 74 |
| South-West | 1 | 0 | 1 | 5 | 14 | 74 |
| West | 0 | 0 | 2 | 4 | 12 | 76 |
Recyclables wheelie bin collection services were most commonly used in the Mid-East region with 85% of households reporting this as their main method of disposing of recyclable waste compared with 73% in the Border and Midland regions. However 16% of households in the Border, Midland and South-East regions brought their recyclable waste to a recycling centre compared with 5% of Dublin households and 7% of households in the Mid-East. A further 3% of Dublin households used a recyclables pre-paid bag collection service, compared with 1% nationally (see Table 2).
Figure 3 shows household experiences of noise pollution by type of tenure. A full breakdown of household experiences of noise pollution by household characteristics is provided in Table 5.
| Owner-occupied | Rented | |
| Road traffic | 21 | 34 |
| Dogs | 19 | 22 |
| Neighbouring houses | 14 | 30 |
| Airplanes | 5 | 6 |
| Industrial | 3 | 6 |
| Trains | 2 | 6 |
| Hospitality sector | 1 | 3 |
| None of the above | 58 | 44 |
Households whose members were renting the property were more likely to experience noise pollution of every kind than households which were owner-occupied. Respondents were asked to select all types of noise pollution that they experienced at a sufficient level to cause irritation. No irritating noise pollution was experience by 58% of owner-occupied households and by 44% of households who were renting.
The main sources of noise pollution were road traffic, neighbouring houses and dogs. Road traffic was the most common noise pollution experienced by both renters (34%) and owner-occupiers (21%). Households who were renting also reported high levels of noise pollution from neighbouring houses (30% compared with 14% for owner-occupied households) and dogs (22% of rented households and 19% of owner-occupied households).
Table 6A shows that 12% of households nationally have had their home tested for radon. Testing was most common in the South-East at 23%, followed by the West (21%) and the South-West (17%) where radon levels tend to be higher. Only 6% of Midland households and 5% of Dublin households had had their homes tested for radon.
Figure 4 shows how frequently households purchased or received used clothes and textiles, used electrical or electronic equipment, or used furniture from charity or second-hand shops, online platforms and private gifts, donations or swaps.
| Never | Sometimes | Often | |
| Used clothes from a charity or second-hand shop | 55 | 36 | 8 |
| Used clothes from an online platform | 69 | 20 | 8 |
| Used clothes from private gifts, donations or swaps | 65 | 27 | 5 |
| Used electrical or electronic equipment from a charity or second-hand shop | 82 | 15 | 1 |
| Used electrical or electronic equipment from an online platform | 66 | 28 | 4 |
| Used electrical or electronic equipment from private gifts, donations or swaps | 72 | 24 | 1 |
| Used furniture from a charity or second-hand shop | 64 | 31 | 2 |
| Used furniture from an online platform | 73 | 23 | 2 |
| Used furniture from private gifts, donations or swaps | 69 | 27 | 1 |
Figure 4 shows that 8% of households often bought or received used clothes or textiles from a charity shop or online platform. A further 36% of households sometimes purchased used clothes or textiles from charity shops while 28% often or sometimes bought or received used electrical or electronic equipment via online platforms and 31% often or sometimes bought used furniture from charity shops.
Tables 8A-8C, 9A-9C and 10A-10C show a breakdown by household characteristics of purchases and receipts of used clothes or textiles, used electrical or electronic equipment and used furniture from charity shops, online platforms and private gifts, donations or swaps.
Table 8B shows that 16% of the 18-34 years age group often bought or received used clothes via online platforms while a further 27% reported sometimes using online platforms to purchase or receive used clothes or textiles. Table 10C shows that 34% of women compared with 19% of men sometimes received used furniture through private gifts, donations or swaps.
This release is one of four statistical releases based on the CSO General Household Survey Environment module from Quarter 3, 2021. The other three reports cover Environmental Concerns; Visits to Nature Areas; and Energy Use.
| Table 1: What is your household’s main method for disposing of NON-RECYCLABLE household waste (e.g. heavily soiled food packaging)? | |||||||||||||||||
| % of weighted households | |||||||||||||||||
| Wheelie bin collection service | Pre-paid bag collection service | Share bin with a neighbour, relative or friend | Bring it to a recycling centre that accepts it | Bring it to a Pay-to-Use unit at a petrol station or similar location | Bring it to work | Other | No response | Sample Households | |||||||||
| Total | 80% | 2% | 5% | 8% | 0% | 0% | 2% | 2% | 4,641 | ||||||||
| Nature of occupancy | |||||||||||||||||
| Owner-occupied | 83% | 2% | 4% | 8% | 0% | 0% | 1% | 1% | 4,013 | ||||||||
| Rented | 74% | 3% | 9% | 6% | 1% | 0% | 3% | 4% | 628 | ||||||||
| Number of occupants | |||||||||||||||||
| 1 occupant | 66% | 4% | 12% | 10% | 1% | 0% | 4% | 3% | 755 | ||||||||
| 2 occupants | 78% | 3% | 6% | 9% | 1% | 0% | 2% | 2% | 1,376 | ||||||||
| 3 occupants | 83% | 1% | 4% | 9% | 0% | 0% | 1% | 2% | 901 | ||||||||
| 4 occupants | 89% | 1% | 2% | 5% | 0% | 0% | 1% | 1% | 975 | ||||||||
| 5 or more occupants | 86% | 1% | 3% | 5% | 0% | 0% | 1% | 3% | 634 | ||||||||
| Number of children | |||||||||||||||||
| 1 person under 18 | 83% | 2% | 5% | 6% | 0% | 0% | 2% | 1% | 651 | ||||||||
| 2 persons under 18 | 91% | 1% | 2% | 5% | 0% | 0% | 1% | 0% | 706 | ||||||||
| 3 or more persons under 18 | 88% | 0% | 5% | 3% | 0% | 1% | 0% | 3% | 334 | ||||||||
| Dwelling type | |||||||||||||||||
| Detached house | 80% | 1% | 4% | 11% | 0% | 1% | 1% | 2% | 1,854 | ||||||||
| Semi-detached house | 87% | 1% | 2% | 6% | 0% | 0% | 1% | 2% | 1,590 | ||||||||
| Terraced house | 81% | 6% | 5% | 6% | 1% | 0% | 0% | 1% | 713 | ||||||||
| Flat or apartment in a purpose-built block | 61% | 4% | 20% | 3% | 0% | 0% | 7% | 4% | 390 | ||||||||
| Other | 68% | 6% | 12% | 4% | 1% | 0% | 2% | 6% | 94 | ||||||||
| Construction date | |||||||||||||||||
| Before 1961 | 77% | 5% | 5% | 9% | 1% | 0% | 1% | 1% | 891 | ||||||||
| 1961-1980 | 84% | 2% | 4% | 8% | 0% | 0% | 1% | 1% | 865 | ||||||||
| 1981-2000 | 82% | 2% | 4% | 8% | 0% | 0% | 2% | 2% | 1,257 | ||||||||
| 2001 or later | 82% | 1% | 6% | 7% | 0% | 1% | 2% | 1% | 1,280 | ||||||||
| Unknown construction period | 70% | 3% | 9% | 5% | 1% | 1% | 4% | 8% | 348 | ||||||||
| Region | |||||||||||||||||
| Border | 78% | 3% | 4% | 9% | 0% | 1% | 1% | 3% | 257 | ||||||||
| Dublin | 82% | 4% | 6% | 3% | 0% | 0% | 2% | 2% | 1,725 | ||||||||
| Mid-East | 87% | 0% | 4% | 4% | 0% | 0% | 2% | 2% | 704 | ||||||||
| Mid-West | 79% | 0% | 10% | 6% | 1% | 1% | 1% | 2% | 372 | ||||||||
| Midland | 73% | 2% | 5% | 14% | 1% | 0% | 2% | 4% | 196 | ||||||||
| South-East | 80% | 1% | 4% | 12% | 2% | 0% | 2% | 0% | 357 | ||||||||
| South-West | 76% | 1% | 6% | 12% | 1% | 0% | 2% | 2% | 668 | ||||||||
| West | 76% | 4% | 4% | 10% | 0% | 0% | 3% | 4% | 362 | ||||||||
| Urban/Rural | |||||||||||||||||
| Rural areas | 73% | 2% | 6% | 15% | 0% | 1% | 2% | 2% | 1,078 | ||||||||
| Urban areas | 84% | 2% | 5% | 4% | 0% | 0% | 2% | 2% | 2,984 | ||||||||
| Not known | 75% | 4% | 7% | 8% | 1% | 0% | 2% | 2% | 579 | ||||||||
| Age group of respondent | |||||||||||||||||
| 18-34 years | 74% | 5% | 8% | 5% | 1% | 0% | 3% | 5% | 586 | ||||||||
| 35-44 years | 82% | 2% | 6% | 5% | 1% | 0% | 1% | 2% | 1,035 | ||||||||
| 45-54 years | 84% | 2% | 4% | 7% | 1% | 0% | 1% | 1% | 1,177 | ||||||||
| 55-64 years | 78% | 2% | 5% | 11% | 0% | 0% | 1% | 2% | 979 | ||||||||
| 65 years or over | 78% | 2% | 5% | 11% | 0% | 0% | 2% | 1% | 864 | ||||||||
| Sex of respondent | |||||||||||||||||
| Male | 80% | 2% | 5% | 7% | 0% | 0% | 2% | 2% | 2,194 | ||||||||
| Female | 80% | 2% | 6% | 8% | 1% | 0% | 2% | 2% | 2,447 | ||||||||
| Working status of respondent | |||||||||||||||||
| Working for payment or profit | 82% | 2% | 6% | 6% | 1% | 1% | 1% | 1% | 2,939 | ||||||||
| Retired from employment | 79% | 2% | 5% | 12% | 0% | 0% | 2% | 1% | 881 | ||||||||
| Looking after home or family | 78% | 1% | 2% | 7% | 1% | 0% | 2% | 9% | 233 | ||||||||
| Other | 76% | 3% | 6% | 10% | 0% | 0% | 3% | 3% | 588 | ||||||||
| Table 2: What is your household’s main method for disposing of RECYCLABLE household waste (e.g. paper and cardboard packaging)? | |||||||||||||||||
| % of weighted households | |||||||||||||||||
| Recyclables wheelie bin collection service | Bring it to a recycling centre | Share recyclables bin with a neighbour, relative or friend | Recyclables pre-paid bag collection service | Bring it to work | Do not recycle | Other | No response | Sample Households | |||||||||
| Total | 78% | 11% | 5% | 1% | 0% | 1% | 1% | 4% | 4,641 | ||||||||
| Nature of occupancy | |||||||||||||||||
| Owner-occupied | 80% | 11% | 4% | 1% | 0% | 0% | 1% | 3% | 4,013 | ||||||||
| Rented | 73% | 9% | 8% | 2% | 0% | 1% | 1% | 5% | 628 | ||||||||
| Number of occupants | |||||||||||||||||
| 1 occupant | 65% | 16% | 11% | 2% | 0% | 1% | 1% | 3% | 755 | ||||||||
| 2 occupants | 75% | 12% | 5% | 2% | 0% | 0% | 1% | 4% | 1,376 | ||||||||
| 3 occupants | 80% | 10% | 4% | 1% | 0% | 0% | 0% | 3% | 901 | ||||||||
| 4 occupants | 86% | 7% | 2% | 1% | 0% | 0% | 1% | 3% | 975 | ||||||||
| 5 or more occupants | 83% | 7% | 2% | 0% | 0% | 0% | 1% | 6% | 634 | ||||||||
| Number of children | |||||||||||||||||
| 1 person under 18 | 81% | 8% | 4% | 1% | 0% | 1% | 1% | 4% | 651 | ||||||||
| 2 persons under 18 | 87% | 6% | 2% | 0% | 0% | 0% | 1% | 4% | 706 | ||||||||
| 3 or more persons under 18 | 85% | 6% | 3% | 0% | 0% | 0% | 0% | 5% | 334 | ||||||||
| Dwelling type | |||||||||||||||||
| Detached house | 77% | 14% | 3% | 1% | 0% | 0% | 1% | 4% | 1,854 | ||||||||
| Semi-detached house | 85% | 8% | 2% | 1% | 0% | 0% | 0% | 4% | 1,590 | ||||||||
| Terraced house | 81% | 8% | 4% | 4% | 0% | 0% | 0% | 3% | 713 | ||||||||
| Flat or apartment in a purpose-built block | 59% | 10% | 18% | 3% | 0% | 2% | 3% | 5% | 390 | ||||||||
| Other | 68% | 5% | 15% | 4% | 0% | 4% | 1% | 3% | 94 | ||||||||
| Construction date | |||||||||||||||||
| Before 1961 | 74% | 14% | 5% | 4% | 0% | 0% | 1% | 3% | 891 | ||||||||
| 1961-1980 | 81% | 12% | 3% | 0% | 0% | 0% | 1% | 4% | 865 | ||||||||
| 1981-2000 | 79% | 12% | 4% | 1% | 0% | 0% | 0% | 4% | 1,257 | ||||||||
| 2001 or later | 80% | 9% | 5% | 1% | 0% | 1% | 1% | 3% | 1,280 | ||||||||
| Unknown construction period | 69% | 6% | 10% | 2% | 0% | 1% | 2% | 9% | 348 | ||||||||
| Region | |||||||||||||||||
| Border | 73% | 16% | 3% | 1% | 0% | 1% | 0% | 6% | 257 | ||||||||
| Dublin | 81% | 5% | 6% | 3% | 0% | 1% | 1% | 3% | 1,725 | ||||||||
| Mid-East | 85% | 7% | 3% | 0% | 0% | 0% | 1% | 4% | 704 | ||||||||
| Mid-West | 75% | 13% | 8% | 0% | 1% | 0% | 1% | 2% | 372 | ||||||||
| Midland | 73% | 16% | 2% | 1% | 0% | 0% | 3% | 6% | 196 | ||||||||
| South-East | 74% | 16% | 4% | 1% | 0% | 1% | 0% | 4% | 357 | ||||||||
| South-West | 74% | 14% | 5% | 1% | 0% | 0% | 1% | 4% | 668 | ||||||||
| West | 76% | 12% | 4% | 2% | 0% | 0% | 0% | 5% | 362 | ||||||||
| Urban/Rural | |||||||||||||||||
| Rural areas | 71% | 18% | 4% | 1% | 0% | 1% | 1% | 3% | 1,078 | ||||||||
| Urban areas | 83% | 6% | 5% | 1% | 0% | 0% | 1% | 4% | 2,984 | ||||||||
| Not known | 69% | 15% | 7% | 2% | 0% | 1% | 1% | 5% | 579 | ||||||||
| Age group of respondent | |||||||||||||||||
| 18-34 years | 74% | 5% | 7% | 3% | 0% | 2% | 1% | 7% | 586 | ||||||||
| 35-44 years | 79% | 8% | 6% | 1% | 0% | 1% | 1% | 4% | 1,035 | ||||||||
| 45-54 years | 82% | 11% | 3% | 1% | 0% | 0% | 1% | 3% | 1,177 | ||||||||
| 55-64 years | 76% | 15% | 4% | 1% | 0% | 0% | 1% | 3% | 979 | ||||||||
| 65 years or over | 75% | 14% | 4% | 1% | 0% | 0% | 1% | 4% | 864 | ||||||||
| Sex of respondent | |||||||||||||||||
| Male | 80% | 10% | 4% | 1% | 0% | 1% | 1% | 3% | 2,194 | ||||||||
| Female | 76% | 11% | 5% | 2% | 0% | 0% | 1% | 4% | 2,447 | ||||||||
| Working status of respondent | |||||||||||||||||
| Working for payment or profit | 80% | 9% | 5% | 1% | 0% | 1% | 1% | 3% | 2,939 | ||||||||
| Retired from employment | 75% | 15% | 4% | 1% | 0% | 0% | 1% | 4% | 881 | ||||||||
| Looking after home or family | 77% | 11% | 1% | 0% | 0% | 1% | 2% | 8% | 233 | ||||||||
| Other | 73% | 14% | 4% | 2% | 0% | 1% | 1% | 4% | 588 | ||||||||
| Table 3: How does your household usually dispose of FOOD WASTE (including raw or cooked, edible or inedible parts of food)? | |||||||||||||
| % of weighted households | |||||||||||||
| Put it in the organic (brown) bin for collection | Put it in the general (residual) waste bin for collection | Bring it to a recycling centre | Compost it at home | Feed it to animals | No response | Sample Households | |||||||
| Total | 49% | 30% | 2% | 16% | 13% | 2% | 4,641 | ||||||
| Nature of occupancy | |||||||||||||
| Owner-occupied | 50% | 26% | 3% | 19% | 15% | 2% | 4,013 | ||||||
| Rented | 47% | 38% | 2% | 11% | 8% | 3% | 628 | ||||||
| Number of occupants | |||||||||||||
| 1 occupant | 41% | 32% | 4% | 17% | 11% | 3% | 755 | ||||||
| 2 occupants | 47% | 31% | 3% | 17% | 12% | 2% | 1,376 | ||||||
| 3 occupants | 54% | 27% | 2% | 16% | 15% | 2% | 901 | ||||||
| 4 occupants | 55% | 28% | 1% | 14% | 14% | 2% | 975 | ||||||
| 5 or more occupants | 49% | 30% | 1% | 17% | 14% | 5% | 634 | ||||||
| Number of children | |||||||||||||
| 1 person under 18 | 56% | 29% | 2% | 13% | 13% | 1% | 651 | ||||||
| 2 persons under 18 | 57% | 29% | 0% | 13% | 11% | 1% | 706 | ||||||
| 3 or more persons under 18 | 50% | 33% | 0% | 17% | 13% | 4% | 334 | ||||||
| Dwelling type | |||||||||||||
| Detached house | 37% | 29% | 3% | 25% | 21% | 2% | 1,854 | ||||||
| Semi-detached house | 67% | 20% | 2% | 13% | 9% | 2% | 1,590 | ||||||
| Terraced house | 62% | 26% | 2% | 12% | 8% | 2% | 713 | ||||||
| Flat or apartment in a purpose-built block | 28% | 62% | 1% | 3% | 3% | 3% | 390 | ||||||
| Other | 38% | 39% | 4% | 10% | 16% | 3% | 94 | ||||||
| Construction date | |||||||||||||
| Before 1961 | 48% | 25% | 2% | 27% | 16% | 2% | 891 | ||||||
| 1961-1980 | 57% | 25% | 2% | 16% | 12% | 2% | 865 | ||||||
| 1981-2000 | 51% | 25% | 3% | 16% | 14% | 3% | 1,257 | ||||||
| 2001 or later | 46% | 35% | 2% | 14% | 13% | 2% | 1,280 | ||||||
| Unknown construction period | 45% | 40% | 2% | 7% | 7% | 5% | 348 | ||||||
| Region | |||||||||||||
| Border | 27% | 38% | 4% | 23% | 25% | 5% | 257 | ||||||
| Dublin | 62% | 30% | 1% | 10% | 5% | 3% | 1,725 | ||||||
| Mid-East | 56% | 27% | 1% | 14% | 13% | 1% | 704 | ||||||
| Mid-West | 53% | 25% | 1% | 17% | 16% | 1% | 372 | ||||||
| Midland | 33% | 31% | 3% | 25% | 20% | 4% | 196 | ||||||
| South-East | 41% | 32% | 5% | 20% | 13% | 2% | 357 | ||||||
| South-West | 46% | 27% | 5% | 17% | 14% | 3% | 668 | ||||||
| West | 42% | 32% | 2% | 19% | 17% | 2% | 362 | ||||||
| Urban/Rural | |||||||||||||
| Rural areas | 24% | 34% | 4% | 29% | 28% | 2% | 1,078 | ||||||
| Urban areas | 64% | 25% | 2% | 10% | 6% | 3% | 2,984 | ||||||
| Not known | 34% | 40% | 2% | 19% | 13% | 3% | 579 | ||||||
| Age group of respondent | |||||||||||||
| 18-34 years | 43% | 38% | 2% | 12% | 13% | 5% | 586 | ||||||
| 35-44 years | 51% | 35% | 1% | 13% | 9% | 2% | 1,035 | ||||||
| 45-54 years | 52% | 30% | 2% | 16% | 14% | 1% | 1,177 | ||||||
| 55-64 years | 50% | 23% | 3% | 18% | 15% | 3% | 979 | ||||||
| 65 years or over | 47% | 22% | 5% | 23% | 14% | 3% | 864 | ||||||
| Sex of respondent | |||||||||||||
| Male | 49% | 30% | 2% | 16% | 11% | 2% | 2,194 | ||||||
| Female | 49% | 29% | 2% | 17% | 15% | 3% | 2,447 | ||||||
| Working status of respondent | |||||||||||||
| Working for payment or profit | 50% | 31% | 2% | 15% | 12% | 2% | 2,939 | ||||||
| Retired from employment | 49% | 21% | 4% | 24% | 12% | 2% | 881 | ||||||
| Looking after home or family | 50% | 26% | 2% | 17% | 18% | 6% | 233 | ||||||
| Other | 44% | 34% | 3% | 12% | 16% | 2% | 588 | ||||||
| Table 4: How does your household usually dispose of GARDEN WASTE (e.g. grass, plants and garden clippings)? | |||||||||||||||
| % of weighted households | |||||||||||||||
| Put it in the organic (brown) bin for collection | Put it in the general (residual) waste bin for collection | Bring it to a recycling centre | Compost it at home | Other | Not relevant | No response | Sample Households | ||||||||
| Total | 37% | 8% | 6% | 37% | 7% | 11% | 2% | 4,641 | |||||||
| Nature of occupancy | |||||||||||||||
| Owner-occupied | 39% | 6% | 7% | 43% | 8% | 5% | 2% | 4,013 | |||||||
| Rented | 34% | 13% | 3% | 22% | 5% | 25% | 4% | 628 | |||||||
| Number of occupants | |||||||||||||||
| 1 occupant | 30% | 8% | 7% | 34% | 7% | 18% | 3% | 755 | |||||||
| 2 occupants | 34% | 10% | 8% | 34% | 6% | 14% | 2% | 1,376 | |||||||
| 3 occupants | 42% | 6% | 5% | 35% | 10% | 8% | 1% | 901 | |||||||
| 4 occupants | 45% | 8% | 5% | 37% | 6% | 5% | 2% | 975 | |||||||
| 5 or more occupants | 36% | 7% | 3% | 46% | 7% | 3% | 4% | 634 | |||||||
| Number of children | |||||||||||||||
| 1 person under 18 | 44% | 9% | 7% | 33% | 7% | 7% | 1% | 651 | |||||||
| 2 persons under 18 | 45% | 10% | 3% | 38% | 6% | 5% | 1% | 706 | |||||||
| 3 or more persons under 18 | 39% | 7% | 4% | 45% | 7% | 4% | 4% | 334 | |||||||
| Dwelling type | |||||||||||||||
| Detached house | 22% | 5% | 5% | 61% | 11% | 2% | 2% | 1,854 | |||||||
| Semi-detached house | 58% | 8% | 8% | 25% | 6% | 3% | 2% | 1,590 | |||||||
| Terraced house | 55% | 10% | 6% | 24% | 4% | 8% | 1% | 713 | |||||||
| Flat or apartment in a purpose-built block | 13% | 19% | 1% | 3% | 3% | 57% | 5% | 390 | |||||||
| Other | 27% | 8% | 4% | 19% | 1% | 38% | 6% | 94 | |||||||
| Construction date | |||||||||||||||
| Before 1961 | 38% | 7% | 7% | 45% | 5% | 7% | 1% | 891 | |||||||
| 1961-1980 | 47% | 5% | 9% | 34% | 7% | 8% | 2% | 865 | |||||||
| 1981-2000 | 39% | 6% | 6% | 39% | 9% | 6% | 3% | 1,257 | |||||||
| 2001 or later | 33% | 11% | 4% | 37% | 9% | 12% | 1% | 1,280 | |||||||
| Unknown construction period | 31% | 12% | 2% | 19% | 5% | 29% | 7% | 348 | |||||||
| Region | |||||||||||||||
| Border | 11% | 10% | 3% | 54% | 17% | 8% | 4% | 257 | |||||||
| Dublin | 54% | 10% | 7% | 17% | 3% | 16% | 3% | 1,725 | |||||||
| Mid-East | 49% | 7% | 7% | 33% | 4% | 7% | 1% | 704 | |||||||
| Mid-West | 26% | 7% | 9% | 43% | 10% | 10% | 2% | 372 | |||||||
| Midland | 21% | 6% | 4% | 53% | 13% | 6% | 4% | 196 | |||||||
| South-East | 33% | 6% | 5% | 45% | 8% | 8% | 1% | 357 | |||||||
| South-West | 29% | 10% | 5% | 45% | 5% | 11% | 2% | 668 | |||||||
| West | 33% | 6% | 2% | 45% | 11% | 9% | 2% | 362 | |||||||
| Urban/Rural | |||||||||||||||
| Rural areas | 10% | 5% | 4% | 69% | 14% | 2% | 1% | 1,078 | |||||||
| Urban areas | 52% | 9% | 7% | 22% | 4% | 12% | 3% | 2,984 | |||||||
| Not known | 24% | 11% | 5% | 37% | 7% | 21% | 2% | 579 | |||||||
| Age group of respondent | |||||||||||||||
| 18-34 years | 34% | 11% | 3% | 25% | 5% | 23% | 5% | 586 | |||||||
| 35-44 years | 40% | 11% | 3% | 33% | 7% | 13% | 2% | 1,035 | |||||||
| 45-54 years | 39% | 8% | 6% | 40% | 7% | 6% | 2% | 1,177 | |||||||
| 55-64 years | 38% | 5% | 7% | 42% | 9% | 6% | 2% | 979 | |||||||
| 65 years or over | 35% | 7% | 11% | 42% | 9% | 6% | 2% | 864 | |||||||
| Sex of respondent | |||||||||||||||
| Male | 36% | 8% | 6% | 36% | 7% | 12% | 2% | 2,194 | |||||||
| Female | 39% | 8% | 5% | 37% | 8% | 9% | 3% | 2,447 | |||||||
| Working status of respondent | |||||||||||||||
| Working for payment or profit | 38% | 8% | 5% | 37% | 7% | 11% | 2% | 2,939 | |||||||
| Retired from employment | 37% | 6% | 10% | 42% | 8% | 5% | 2% | 881 | |||||||
| Looking after home or family | 33% | 10% | 6% | 38% | 11% | 3% | 7% | 233 | |||||||
| Other | 35% | 11% | 5% | 28% | 7% | 17% | 3% | 588 | |||||||
| Table 5: Does your household experience any of the following noise pollution sufficient to cause irritation? | |||||||||||||||||||
| % of weighted households | |||||||||||||||||||
| Road traffic | Trains | Airplanes | Hospitality sector | Dogs | Neighbouring houses | Industrial | None of the above | No response | Sample Households | ||||||||||
| Total | 25% | 3% | 5% | 2% | 19% | 19% | 4% | 54% | 2% | 4,641 | |||||||||
| Nature of occupancy | |||||||||||||||||||
| Owner-occupied | 21% | 2% | 5% | 1% | 19% | 14% | 3% | 58% | 2% | 4,013 | |||||||||
| Rented | 34% | 6% | 6% | 3% | 22% | 30% | 6% | 44% | 1% | 628 | |||||||||
| Number of occupants | |||||||||||||||||||
| 1 occupant | 27% | 2% | 3% | 3% | 17% | 17% | 3% | 54% | 2% | 755 | |||||||||
| 2 occupants | 26% | 4% | 6% | 2% | 18% | 22% | 4% | 52% | 2% | 1,376 | |||||||||
| 3 occupants | 27% | 2% | 5% | 2% | 21% | 18% | 4% | 54% | 2% | 901 | |||||||||
| 4 occupants | 21% | 2% | 5% | 1% | 23% | 19% | 3% | 55% | 2% | 975 | |||||||||
| 5 or more occupants | 22% | 3% | 6% | 1% | 19% | 15% | 4% | 57% | 2% | 634 | |||||||||
| Number of children | |||||||||||||||||||
| 1 person under 18 | 26% | 2% | 6% | 2% | 26% | 22% | 4% | 49% | 2% | 651 | |||||||||
| 2 persons under 18 | 27% | 3% | 6% | 2% | 19% | 19% | 3% | 54% | 1% | 706 | |||||||||
| 3 or more persons under 18 | 19% | 2% | 4% | 1% | 18% | 14% | 3% | 58% | 4% | 334 | |||||||||
| Dwelling type | |||||||||||||||||||
| Detached house | 18% | 1% | 4% | 1% | 15% | 6% | 2% | 65% | 2% | 1,854 | |||||||||
| Semi-detached house | 22% | 3% | 6% | 1% | 25% | 25% | 3% | 50% | 2% | 1,590 | |||||||||
| Terraced house | 31% | 4% | 7% | 4% | 27% | 25% | 5% | 44% | 3% | 713 | |||||||||
| Flat or apartment in a purpose-built block | 41% | 7% | 5% | 4% | 11% | 38% | 8% | 43% | 0% | 390 | |||||||||
| Other | 50% | 4% | 3% | 7% | 14% | 26% | 7% | 44% | 0% | 94 | |||||||||
| Construction date | |||||||||||||||||||
| Before 1961 | 33% | 3% | 5% | 4% | 18% | 16% | 3% | 54% | 2% | 891 | |||||||||
| 1961-1980 | 22% | 2% | 5% | 1% | 17% | 17% | 3% | 54% | 2% | 865 | |||||||||
| 1981-2000 | 21% | 3% | 6% | 1% | 20% | 17% | 4% | 56% | 2% | 1,257 | |||||||||
| 2001 or later | 21% | 3% | 5% | 1% | 23% | 20% | 3% | 55% | 1% | 1,280 | |||||||||
| Unknown construction period | 34% | 5% | 3% | 4% | 15% | 26% | 6% | 48% | 2% | 348 | |||||||||
| Region | |||||||||||||||||||
| Border | 19% | 0% | 1% | 2% | 18% | 12% | 3% | 61% | 2% | 257 | |||||||||
| Dublin | 30% | 5% | 11% | 3% | 18% | 24% | 4% | 47% | 2% | 1,725 | |||||||||
| Mid-East | 24% | 4% | 5% | 0% | 23% | 21% | 3% | 52% | 1% | 704 | |||||||||
| Mid-West | 20% | 2% | 3% | 2% | 22% | 24% | 4% | 54% | 2% | 372 | |||||||||
| Midland | 20% | 1% | 2% | 1% | 18% | 12% | 2% | 63% | 2% | 196 | |||||||||
| South-East | 23% | 0% | 0% | 3% | 24% | 14% | 3% | 55% | 2% | 357 | |||||||||
| South-West | 26% | 2% | 5% | 1% | 19% | 17% | 5% | 57% | 2% | 668 | |||||||||
| West | 22% | 2% | 1% | 1% | 13% | 14% | 2% | 61% | 1% | 362 | |||||||||
| Urban/Rural | |||||||||||||||||||
| Rural areas | 15% | 1% | 3% | 0% | 15% | 7% | 2% | 67% | 2% | 1,078 | |||||||||
| Urban areas | 28% | 4% | 6% | 2% | 23% | 23% | 4% | 49% | 2% | 2,984 | |||||||||
| Not known | 30% | 3% | 3% | 3% | 14% | 22% | 3% | 53% | 1% | 579 | |||||||||
| Age group of respondent | |||||||||||||||||||
| 18-34 years | 38% | 5% | 7% | 4% | 24% | 28% | 6% | 46% | 1% | 586 | |||||||||
| 35-44 years | 28% | 4% | 5% | 2% | 21% | 26% | 4% | 46% | 2% | 1,035 | |||||||||
| 45-54 years | 24% | 3% | 6% | 1% | 18% | 19% | 4% | 54% | 1% | 1,177 | |||||||||
| 55-64 years | 18% | 1% | 4% | 1% | 19% | 13% | 2% | 61% | 1% | 979 | |||||||||
| 65 years or over | 16% | 1% | 3% | 1% | 15% | 7% | 1% | 66% | 2% | 864 | |||||||||
| Sex of respondent | |||||||||||||||||||
| Male | 24% | 3% | 4% | 1% | 18% | 17% | 3% | 57% | 2% | 2,194 | |||||||||
| Female | 25% | 3% | 5% | 2% | 21% | 20% | 4% | 52% | 2% | 2,447 | |||||||||
| Working status of respondent | |||||||||||||||||||
| Working for payment or profit | 25% | 3% | 5% | 2% | 20% | 20% | 4% | 54% | 2% | 2,939 | |||||||||
| Retired from employment | 17% | 2% | 3% | 2% | 16% | 8% | 2% | 64% | 2% | 881 | |||||||||
| Looking after home or family | 22% | 1% | 4% | 1% | 19% | 14% | 2% | 57% | 1% | 233 | |||||||||
| Other | 32% | 4% | 6% | 3% | 23% | 29% | 5% | 45% | 1% | 588 | |||||||||
| Table 6A: Has your home been tested for radon? | |||||||||
| % of weighted households | |||||||||
| Yes | No | Don’t know | No response | Sample Households | |||||
| Total | 12% | 51% | 37% | 0% | 4,641 | ||||
| Nature of occupancy | |||||||||
| Owner-occupied | 11% | 62% | 26% | 0% | 4,013 | ||||
| Rented | 12% | 24% | 64% | 0% | 628 | ||||
| Number of occupants | |||||||||
| 1 occupant | 12% | 51% | 36% | 0% | 755 | ||||
| 2 occupants | 12% | 48% | 39% | 0% | 1,376 | ||||
| 3 occupants | 11% | 52% | 38% | 0% | 901 | ||||
| 4 occupants | 11% | 52% | 38% | 0% | 975 | ||||
| 5 or more occupants | 13% | 56% | 32% | 0% | 634 | ||||
| Number of children | |||||||||
| 1 person under 18 | 11% | 47% | 41% | 0% | 651 | ||||
| 2 persons under 18 | 10% | 51% | 39% | 0% | 706 | ||||
| 3 or more persons under 18 | 12% | 57% | 31% | 0% | 334 | ||||
| Dwelling type | |||||||||
| Detached house | 16% | 58% | 25% | 0% | 1,854 | ||||
| Semi-detached house | 10% | 54% | 35% | 0% | 1,590 | ||||
| Terraced house | 10% | 47% | 43% | 0% | 713 | ||||
| Flat or apartment in a purpose-built block | 3% | 29% | 68% | 0% | 390 | ||||
| Other | 9% | 22% | 69% | 0% | 94 | ||||
| Construction date | |||||||||
| Before 1961 | 12% | 58% | 29% | 0% | 891 | ||||
| 1961-1980 | 13% | 62% | 25% | 0% | 865 | ||||
| 1981-2000 | 12% | 56% | 32% | 0% | 1,257 | ||||
| 2001 or later | 13% | 47% | 41% | 0% | 1,280 | ||||
| Unknown construction period | 5% | 23% | 71% | 0% | 348 | ||||
| Region | |||||||||
| Border | 14% | 54% | 33% | 0% | 257 | ||||
| Dublin | 5% | 53% | 43% | 0% | 1,725 | ||||
| Mid-East | 9% | 53% | 38% | 0% | 704 | ||||
| Mid-West | 11% | 50% | 40% | 0% | 372 | ||||
| Midland | 6% | 56% | 38% | 0% | 196 | ||||
| South-East | 23% | 48% | 29% | 0% | 357 | ||||
| South-West | 17% | 46% | 38% | 0% | 668 | ||||
| West | 21% | 52% | 27% | 0% | 362 | ||||
| Urban/Rural | |||||||||
| Rural areas | 18% | 56% | 26% | 0% | 1,078 | ||||
| Urban areas | 9% | 52% | 39% | 0% | 2,984 | ||||
| Not known | 10% | 41% | 49% | 0% | 579 | ||||
| Age group of respondent | |||||||||
| 18-34 years | 5% | 26% | 69% | 0% | 586 | ||||
| 35-44 years | 7% | 46% | 47% | 0% | 1,035 | ||||
| 45-54 years | 13% | 56% | 31% | 0% | 1,177 | ||||
| 55-64 years | 16% | 60% | 24% | 0% | 979 | ||||
| 65 years or over | 17% | 65% | 18% | 0% | 864 | ||||
| Sex of respondent | |||||||||
| Male | 12% | 55% | 33% | 0% | 2,194 | ||||
| Female | 12% | 48% | 40% | 0% | 2,447 | ||||
| Working status of respondent | |||||||||
| Working for payment or profit | 11% | 51% | 38% | 0% | 2,939 | ||||
| Retired from employment | 16% | 65% | 19% | 0% | 881 | ||||
| Looking after home or family | 14% | 43% | 44% | 0% | 233 | ||||
| Other | 10% | 39% | 51% | 0% | 588 | ||||
| Table 6B: Were the radon levels above the reference level of 200 Bq/m3? | |||||||||
| % of weighted households | |||||||||
| Yes | No | Don’t know | No response | Sample Households | |||||
| Total | 1% | 7% | 4% | 88% | 4,641 | ||||
| Nature of occupancy | |||||||||
| Owner-occupied | 1% | 8% | 3% | 89% | 4,013 | ||||
| Rented | 0% | 5% | 7% | 88% | 628 | ||||
| Number of occupants | |||||||||
| 1 occupant | 0% | 6% | 6% | 88% | 755 | ||||
| 2 occupants | 1% | 7% | 4% | 88% | 1,376 | ||||
| 3 occupants | 0% | 7% | 3% | 90% | 901 | ||||
| 4 occupants | 1% | 6% | 4% | 89% | 975 | ||||
| 5 or more occupants | 1% | 7% | 4% | 87% | 634 | ||||
| Number of children | |||||||||
| 1 person under 18 | 0% | 7% | 4% | 89% | 651 | ||||
| 2 persons under 18 | 0% | 5% | 4% | 90% | 706 | ||||
| 3 or more persons under 18 | 2% | 8% | 3% | 88% | 334 | ||||
| Dwelling type | |||||||||
| Detached house | 1% | 10% | 5% | 84% | 1,854 | ||||
| Semi-detached house | 1% | 5% | 4% | 90% | 1,590 | ||||
| Terraced house | 0% | 6% | 4% | 91% | 713 | ||||
| Flat or apartment in a purpose-built block | 0% | 1% | 3% | 97% | 390 | ||||
| Other | 0% | 4% | 6% | 91% | 94 | ||||
| Construction date | |||||||||
| Before 1961 | 0% | 8% | 4% | 88% | 891 | ||||
| 1961-1980 | 1% | 9% | 3% | 87% | 865 | ||||
| 1981-2000 | 1% | 7% | 4% | 88% | 1,257 | ||||
| 2001 or later | 0% | 7% | 5% | 87% | 1,280 | ||||
| Unknown construction period | 0% | 2% | 4% | 95% | 348 | ||||
| Region | |||||||||
| Border | 1% | 7% | 6% | 86% | 257 | ||||
| Dublin | 0% | 2% | 2% | 95% | 1,725 | ||||
| Mid-East | 0% | 5% | 3% | 91% | 704 | ||||
| Mid-West | 0% | 7% | 3% | 89% | 372 | ||||
| Midland | 0% | 3% | 3% | 94% | 196 | ||||
| South-East | 2% | 14% | 7% | 77% | 357 | ||||
| South-West | 1% | 10% | 5% | 84% | 668 | ||||
| West | 2% | 12% | 7% | 79% | 362 | ||||
| Urban/Rural | |||||||||
| Rural areas | 1% | 11% | 6% | 82% | 1,078 | ||||
| Urban areas | 0% | 5% | 3% | 91% | 2,984 | ||||
| Not known | 0% | 6% | 3% | 90% | 579 | ||||
| Age group of respondent | |||||||||
| 18-34 years | 1% | 3% | 2% | 95% | 586 | ||||
| 35-44 years | 0% | 5% | 2% | 93% | 1,035 | ||||
| 45-54 years | 1% | 6% | 6% | 87% | 1,177 | ||||
| 55-64 years | 1% | 10% | 5% | 84% | 979 | ||||
| 65 years or over | 1% | 11% | 5% | 84% | 864 | ||||
| Sex of respondent | |||||||||
| Male | 1% | 7% | 4% | 88% | 2,194 | ||||
| Female | 1% | 6% | 5% | 89% | 2,447 | ||||
| Working status of respondent | |||||||||
| Working for payment or profit | 1% | 7% | 4% | 89% | 2,939 | ||||
| Retired from employment | 1% | 10% | 5% | 84% | 881 | ||||
| Looking after home or family | 0% | 8% | 5% | 87% | 233 | ||||
| Other | 1% | 3% | 5% | 90% | 588 | ||||
| Table 6C: Was any work done to reduce your radon exposure? | |||||||||
| % of weighted households | |||||||||
| Yes | No | Don’t know | No response | Sample Households | |||||
| Total | 0% | 0% | 0% | 99% | 4,641 | ||||
| Nature of occupancy | |||||||||
| Owner-occupied | 0% | 0% | 0% | 99% | 4,013 | ||||
| Rented | 0% | 0% | 0% | 100% | 628 | ||||
| Number of occupants | |||||||||
| 1 occupant | 0% | 0% | 0% | 100% | 755 | ||||
| 2 occupants | 0% | 0% | 0% | 99% | 1,376 | ||||
| 3 occupants | 0% | 0% | 0% | 100% | 901 | ||||
| 4 occupants | 0% | 0% | 0% | 99% | 975 | ||||
| 5 or more occupants | 0% | 1% | 0% | 99% | 634 | ||||
| Number of children | |||||||||
| 1 person under 18 | 0% | 0% | 0% | 100% | 651 | ||||
| 2 persons under 18 | 0% | 0% | 0% | 100% | 706 | ||||
| 3 or more persons under 18 | 1% | 1% | 0% | 98% | 334 | ||||
| Dwelling type | |||||||||
| Detached house | 1% | 0% | 0% | 99% | 1,854 | ||||
| Semi-detached house | 0% | 0% | 0% | 99% | 1,590 | ||||
| Terraced house | 0% | 0% | 0% | 100% | 713 | ||||
| Flat or apartment in a purpose-built block | 0% | 0% | 0% | 100% | 390 | ||||
| Other | 0% | 0% | 0% | 100% | 94 | ||||
| Construction date | |||||||||
| Before 1961 | 0% | 0% | 0% | 100% | 891 | ||||
| 1961-1980 | 1% | 0% | 0% | 99% | 865 | ||||
| 1981-2000 | 0% | 1% | 0% | 99% | 1,257 | ||||
| 2001 or later | 0% | 0% | 0% | 100% | 1,280 | ||||
| Unknown construction period | 0% | 0% | 0% | 100% | 348 | ||||
| Region | |||||||||
| Border | 0% | 1% | 0% | 99% | 257 | ||||
| Dublin | 0% | 0% | 0% | 100% | 1,725 | ||||
| Mid-East | 0% | 0% | 0% | 100% | 704 | ||||
| Mid-West | 0% | 0% | 0% | 100% | 372 | ||||
| Midland | 0% | 0% | 0% | 100% | 196 | ||||
| South-East | 1% | 0% | 0% | 98% | 357 | ||||
| South-West | 0% | 1% | 0% | 99% | 668 | ||||
| West | 0% | 1% | 0% | 98% | 362 | ||||
| Urban/Rural | |||||||||
| Rural areas | 0% | 0% | 0% | 99% | 1,078 | ||||
| Urban areas | 0% | 0% | 0% | 100% | 2,984 | ||||
| Not known | 0% | 0% | 0% | 100% | 579 | ||||
| Age group of respondent | |||||||||
| 18-34 years | 0% | 0% | 0% | 99% | 586 | ||||
| 35-44 years | 0% | 0% | 0% | 100% | 1,035 | ||||
| 45-54 years | 0% | 1% | 0% | 99% | 1,177 | ||||
| 55-64 years | 1% | 1% | 0% | 99% | 979 | ||||
| 65 years or over | 1% | 0% | 0% | 99% | 864 | ||||
| Sex of respondent | |||||||||
| Male | 0% | 0% | 0% | 99% | 2,194 | ||||
| Female | 0% | 0% | 0% | 99% | 2,447 | ||||
| Working status of respondent | |||||||||
| Working for payment or profit | 0% | 0% | 0% | 99% | 2,939 | ||||
| Retired from employment | 0% | 0% | 0% | 99% | 881 | ||||
| Looking after home or family | 0% | 0% | 0% | 100% | 233 | ||||
| Other | 0% | 1% | 0% | 99% | 588 | ||||
| Table 7: Does your household receive or buy used clothes, electronic equipment, or used furniture? | |||||||||
| % of weighted households | |||||||||
| Often | Sometimes | Never | No response | Sample Households | |||||
| Used clothes or textiles | |||||||||
| Charity or second-hand shop | 8% | 36% | 55% | 1% | 4,641 | ||||
| Online platform | 8% | 20% | 69% | 4% | 4,641 | ||||
| Private gifts, donations or swaps | 5% | 27% | 65% | 3% | 4,641 | ||||
| Used electrical or electronic equipment | |||||||||
| Charity or second-hand shop | 1% | 15% | 82% | 2% | 4,641 | ||||
| Online platform | 4% | 28% | 66% | 2% | 4,641 | ||||
| Private gifts, donations or swaps | 1% | 24% | 72% | 3% | 4,641 | ||||
| Used furniture | |||||||||
| Charity or second-hand shop | 2% | 31% | 64% | 2% | 4,641 | ||||
| Online platform | 2% | 23% | 73% | 3% | 4,641 | ||||
| Private gifts, donations or swaps | 1% | 27% | 69% | 3% | 4,641 | ||||
| Table 8A: Does your household receive or buy used clothes or textiles in charity or second-hand shops? | |||||||||
| % of weighted households | |||||||||
| Often | Sometimes | Never | No response | Sample Households | |||||
| Total | 8% | 36% | 55% | 1% | 4,641 | ||||
| Nature of occupancy | |||||||||
| Owner-occupied | 7% | 33% | 60% | 1% | 4,013 | ||||
| Rented | 11% | 43% | 43% | 3% | 628 | ||||
| Number of occupants | |||||||||
| 1 occupant | 7% | 31% | 61% | 1% | 755 | ||||
| 2 occupants | 7% | 36% | 55% | 2% | 1,376 | ||||
| 3 occupants | 9% | 37% | 52% | 1% | 901 | ||||
| 4 occupants | 8% | 38% | 52% | 2% | 975 | ||||
| 5 or more occupants | 8% | 36% | 55% | 1% | 634 | ||||
| Number of children | |||||||||
| 1 person under 18 | 10% | 39% | 50% | 1% | 651 | ||||
| 2 persons under 18 | 9% | 36% | 53% | 2% | 706 | ||||
| 3 or more persons under 18 | 7% | 36% | 56% | 1% | 334 | ||||
| Dwelling type | |||||||||
| Detached house | 7% | 34% | 58% | 1% | 1,854 | ||||
| Semi-detached house | 8% | 36% | 54% | 1% | 1,590 | ||||
| Terraced house | 10% | 39% | 51% | 1% | 713 | ||||
| Flat or apartment in a purpose-built block | 8% | 33% | 56% | 3% | 390 | ||||
| Other | 10% | 49% | 38% | 3% | 94 | ||||
| Construction date | |||||||||
| Before 1961 | 11% | 40% | 48% | 1% | 891 | ||||
| 1961-1980 | 8% | 34% | 57% | 1% | 865 | ||||
| 1981-2000 | 6% | 33% | 60% | 1% | 1,257 | ||||
| 2001 or later | 7% | 34% | 57% | 1% | 1,280 | ||||
| Unknown construction period | 9% | 43% | 44% | 4% | 348 | ||||
| Region | |||||||||
| Border | 10% | 37% | 51% | 2% | 257 | ||||
| Dublin | 8% | 34% | 56% | 2% | 1,725 | ||||
| Mid-East | 9% | 37% | 53% | 1% | 704 | ||||
| Mid-West | 5% | 35% | 59% | 1% | 372 | ||||
| Midland | 6% | 39% | 53% | 2% | 196 | ||||
| South-East | 10% | 39% | 49% | 1% | 357 | ||||
| South-West | 9% | 31% | 59% | 2% | 668 | ||||
| West | 6% | 40% | 52% | 2% | 362 | ||||
| Urban/Rural | |||||||||
| Rural areas | 8% | 39% | 52% | 1% | 1,078 | ||||
| Urban areas | 7% | 34% | 57% | 1% | 2,984 | ||||
| Not known | 10% | 36% | 51% | 3% | 579 | ||||
| Age group of respondent | |||||||||
| 18-34 years | 10% | 41% | 46% | 2% | 586 | ||||
| 35-44 years | 8% | 35% | 55% | 2% | 1,035 | ||||
| 45-54 years | 8% | 37% | 54% | 1% | 1,177 | ||||
| 55-64 years | 9% | 36% | 54% | 1% | 979 | ||||
| 65 years or over | 5% | 29% | 64% | 2% | 864 | ||||
| Sex of respondent | |||||||||
| Male | 5% | 28% | 65% | 2% | 2,194 | ||||
| Female | 11% | 42% | 46% | 1% | 2,447 | ||||
| Working status of respondent | |||||||||
| Working for payment or profit | 8% | 36% | 56% | 1% | 2,939 | ||||
| Retired from employment | 4% | 30% | 64% | 2% | 881 | ||||
| Looking after home or family | 9% | 43% | 46% | 2% | 233 | ||||
| Other | 13% | 40% | 45% | 3% | 588 | ||||
| Table 8B: Does your household receive or buy used clothes or textiles through an online platform? | |||||||||
| % of weighted households | |||||||||
| Often | Sometimes | Never | No response | Sample Households | |||||
| Total | 8% | 20% | 69% | 4% | 4,641 | ||||
| Nature of occupancy | |||||||||
| Owner-occupied | 7% | 18% | 72% | 3% | 4,013 | ||||
| Rented | 9% | 24% | 60% | 6% | 628 | ||||
| Number of occupants | |||||||||
| 1 occupant | 4% | 13% | 80% | 3% | 755 | ||||
| 2 occupants | 5% | 21% | 70% | 4% | 1,376 | ||||
| 3 occupants | 8% | 24% | 64% | 4% | 901 | ||||
| 4 occupants | 11% | 20% | 65% | 4% | 975 | ||||
| 5 or more occupants | 12% | 22% | 63% | 3% | 634 | ||||
| Number of children | |||||||||
| 1 person under 18 | 10% | 23% | 63% | 4% | 651 | ||||
| 2 persons under 18 | 9% | 22% | 66% | 3% | 706 | ||||
| 3 or more persons under 18 | 14% | 20% | 62% | 4% | 334 | ||||
| Dwelling type | |||||||||
| Detached house | 8% | 18% | 71% | 3% | 1,854 | ||||
| Semi-detached house | 7% | 19% | 71% | 3% | 1,590 | ||||
| Terraced house | 11% | 22% | 62% | 5% | 713 | ||||
| Flat or apartment in a purpose-built block | 7% | 25% | 64% | 4% | 390 | ||||
| Other | 10% | 28% | 54% | 8% | 94 | ||||
| Construction date | |||||||||
| Before 1961 | 9% | 20% | 66% | 5% | 891 | ||||
| 1961-1980 | 7% | 19% | 71% | 3% | 865 | ||||
| 1981-2000 | 7% | 18% | 71% | 3% | 1,257 | ||||
| 2001 or later | 9% | 21% | 68% | 3% | 1,280 | ||||
| Unknown construction period | 8% | 23% | 63% | 6% | 348 | ||||
| Region | |||||||||
| Border | 6% | 20% | 70% | 4% | 257 | ||||
| Dublin | 8% | 19% | 69% | 3% | 1,725 | ||||
| Mid-East | 7% | 21% | 69% | 3% | 704 | ||||
| Mid-West | 7% | 22% | 68% | 3% | 372 | ||||
| Midland | 5% | 20% | 67% | 8% | 196 | ||||
| South-East | 7% | 22% | 67% | 3% | 357 | ||||
| South-West | 9% | 19% | 69% | 4% | 668 | ||||
| West | 10% | 19% | 67% | 4% | 362 | ||||
| Urban/Rural | |||||||||
| Rural areas | 8% | 19% | 70% | 3% | 1,078 | ||||
| Urban areas | 8% | 20% | 68% | 4% | 2,984 | ||||
| Not known | 7% | 23% | 67% | 4% | 579 | ||||
| Age group of respondent | |||||||||
| 18-34 years | 16% | 27% | 52% | 5% | 586 | ||||
| 35-44 years | 8% | 23% | 65% | 3% | 1,035 | ||||
| 45-54 years | 8% | 19% | 70% | 3% | 1,177 | ||||
| 55-64 years | 5% | 17% | 74% | 3% | 979 | ||||
| 65 years or over | 2% | 12% | 82% | 4% | 864 | ||||
| Sex of respondent | |||||||||
| Male | 8% | 17% | 72% | 3% | 2,194 | ||||
| Female | 8% | 22% | 66% | 4% | 2,447 | ||||
| Working status of respondent | |||||||||
| Working for payment or profit | 9% | 21% | 67% | 3% | 2,939 | ||||
| Retired from employment | 2% | 12% | 82% | 4% | 881 | ||||
| Looking after home or family | 6% | 21% | 66% | 6% | 233 | ||||
| Other | 10% | 23% | 62% | 5% | 588 | ||||
| Table 8C: Does your household receive or buy used clothes or textiles in the form of private gifts, donations or swaps? | |||||||||
| % of weighted households | |||||||||
| Often | Sometimes | Never | No response | Sample Households | |||||
| Total | 5% | 27% | 65% | 3% | 4,641 | ||||
| Nature of occupancy | |||||||||
| Owner-occupied | 5% | 26% | 67% | 3% | 4,013 | ||||
| Rented | 5% | 31% | 59% | 4% | 628 | ||||
| Number of occupants | |||||||||
| 1 occupant | 2% | 22% | 73% | 3% | 755 | ||||
| 2 occupants | 2% | 25% | 70% | 3% | 1,376 | ||||
| 3 occupants | 5% | 28% | 64% | 3% | 901 | ||||
| 4 occupants | 8% | 33% | 56% | 3% | 975 | ||||
| 5 or more occupants | 11% | 28% | 56% | 4% | 634 | ||||
| Number of children | |||||||||
| 1 person under 18 | 7% | 30% | 61% | 2% | 651 | ||||
| 2 persons under 18 | 11% | 36% | 51% | 2% | 706 | ||||
| 3 or more persons under 18 | 14% | 29% | 51% | 5% | 334 | ||||
| Dwelling type | |||||||||
| Detached house | 5% | 27% | 66% | 2% | 1,854 | ||||
| Semi-detached house | 5% | 27% | 64% | 3% | 1,590 | ||||
| Terraced house | 5% | 26% | 67% | 2% | 713 | ||||
| Flat or apartment in a purpose-built block | 2% | 31% | 62% | 4% | 390 | ||||
| Other | 6% | 28% | 61% | 5% | 94 | ||||
| Construction date | |||||||||
| Before 1961 | 5% | 29% | 64% | 2% | 891 | ||||
| 1961-1980 | 4% | 27% | 66% | 3% | 865 | ||||
| 1981-2000 | 4% | 26% | 67% | 3% | 1,257 | ||||
| 2001 or later | 6% | 28% | 63% | 3% | 1,280 | ||||
| Unknown construction period | 6% | 27% | 61% | 6% | 348 | ||||
| Region | |||||||||
| Border | 5% | 30% | 64% | 1% | 257 | ||||
| Dublin | 4% | 27% | 65% | 3% | 1,725 | ||||
| Mid-East | 5% | 25% | 66% | 4% | 704 | ||||
| Mid-West | 4% | 27% | 67% | 2% | 372 | ||||
| Midland | 4% | 25% | 64% | 7% | 196 | ||||
| South-East | 6% | 25% | 65% | 3% | 357 | ||||
| South-West | 7% | 30% | 61% | 3% | 668 | ||||
| West | 5% | 27% | 64% | 4% | 362 | ||||
| Urban/Rural | |||||||||
| Rural areas | 7% | 29% | 62% | 3% | 1,078 | ||||
| Urban areas | 5% | 25% | 67% | 3% | 2,984 | ||||
| Not known | 4% | 35% | 59% | 2% | 579 | ||||
| Age group of respondent | |||||||||
| 18-34 years | 6% | 30% | 58% | 6% | 586 | ||||
| 35-44 years | 9% | 32% | 57% | 2% | 1,035 | ||||
| 45-54 years | 5% | 30% | 63% | 2% | 1,177 | ||||
| 55-64 years | 3% | 26% | 68% | 2% | 979 | ||||
| 65 years or over | 1% | 15% | 81% | 4% | 864 | ||||
| Sex of respondent | |||||||||
| Male | 2% | 21% | 74% | 3% | 2,194 | ||||
| Female | 7% | 33% | 57% | 3% | 2,447 | ||||
| Working status of respondent | |||||||||
| Working for payment or profit | 6% | 30% | 63% | 2% | 2,939 | ||||
| Retired from employment | 1% | 18% | 78% | 3% | 881 | ||||
| Looking after home or family | 10% | 26% | 60% | 5% | 233 | ||||
| Other | 6% | 28% | 61% | 5% | 588 | ||||
| Table 9A: Does your household receive or buy used electrical or electronic equipment (e.g. phones, laptops, TVs, kitchen appliances) in charity or second-hand shops? | |||||||||
| % of weighted households | |||||||||
| Often | Sometimes | Never | No response | Sample Households | |||||
| Total | 1% | 15% | 82% | 2% | 4,641 | ||||
| Nature of occupancy | |||||||||
| Owner-occupied | 1% | 12% | 86% | 1% | 4,013 | ||||
| Rented | 3% | 23% | 71% | 3% | 628 | ||||
| Number of occupants | |||||||||
| 1 occupant | 3% | 10% | 86% | 1% | 755 | ||||
| 2 occupants | 1% | 15% | 82% | 2% | 1,376 | ||||
| 3 occupants | 1% | 17% | 80% | 2% | 901 | ||||
| 4 occupants | 1% | 16% | 80% | 2% | 975 | ||||
| 5 or more occupants | 1% | 19% | 79% | 1% | 634 | ||||
| Number of children | |||||||||
| 1 person under 18 | 2% | 20% | 76% | 2% | 651 | ||||
| 2 persons under 18 | 1% | 19% | 78% | 2% | 706 | ||||
| 3 or more persons under 18 | 0% | 16% | 82% | 1% | 334 | ||||
| Dwelling type | |||||||||
| Detached house | 1% | 13% | 85% | 1% | 1,854 | ||||
| Semi-detached house | 1% | 15% | 82% | 2% | 1,590 | ||||
| Terraced house | 1% | 16% | 81% | 2% | 713 | ||||
| Flat or apartment in a purpose-built block | 2% | 21% | 74% | 2% | 390 | ||||
| Other | 4% | 21% | 70% | 5% | 94 | ||||
| Construction date | |||||||||
| Before 1961 | 2% | 14% | 83% | 2% | 891 | ||||
| 1961-1980 | 1% | 11% | 86% | 2% | 865 | ||||
| 1981-2000 | 2% | 12% | 84% | 2% | 1,257 | ||||
| 2001 or later | 0% | 17% | 81% | 1% | 1,280 | ||||
| Unknown construction period | 2% | 27% | 68% | 3% | 348 | ||||
| Region | |||||||||
| Border | 1% | 16% | 82% | 1% | 257 | ||||
| Dublin | 2% | 14% | 82% | 3% | 1,725 | ||||
| Mid-East | 1% | 13% | 85% | 1% | 704 | ||||
| Mid-West | 1% | 15% | 82% | 1% | 372 | ||||
| Midland | 0% | 22% | 77% | 2% | 196 | ||||
| South-East | 2% | 17% | 80% | 1% | 357 | ||||
| South-West | 2% | 15% | 81% | 2% | 668 | ||||
| West | 1% | 17% | 80% | 2% | 362 | ||||
| Urban/Rural | |||||||||
| Rural areas | 1% | 16% | 82% | 1% | 1,078 | ||||
| Urban areas | 1% | 15% | 82% | 2% | 2,984 | ||||
| Not known | 2% | 17% | 80% | 1% | 579 | ||||
| Age group of respondent | |||||||||
| 18-34 years | 3% | 24% | 70% | 3% | 586 | ||||
| 35-44 years | 1% | 18% | 80% | 1% | 1,035 | ||||
| 45-54 years | 1% | 16% | 81% | 2% | 1,177 | ||||
| 55-64 years | 1% | 11% | 87% | 1% | 979 | ||||
| 65 years or over | 1% | 8% | 90% | 2% | 864 | ||||
| Sex of respondent | |||||||||
| Male | 1% | 15% | 82% | 2% | 2,194 | ||||
| Female | 1% | 16% | 81% | 2% | 2,447 | ||||
| Working status of respondent | |||||||||
| Working for payment or profit | 1% | 16% | 81% | 2% | 2,939 | ||||
| Retired from employment | 1% | 7% | 91% | 2% | 881 | ||||
| Looking after home or family | 0% | 15% | 84% | 1% | 233 | ||||
| Other | 3% | 22% | 73% | 2% | 588 | ||||
| Table 9B: Does your household receive or buy used electrical or electronic equipment (e.g. phones, laptops, TVs, kitchen appliances) through an online platform? | |||||||||
| % of weighted households | |||||||||
| Often | Sometimes | Never | No response | Sample Households | |||||
| Total | 4% | 28% | 66% | 2% | 4,641 | ||||
| Nature of occupancy | |||||||||
| Owner-occupied | 3% | 26% | 69% | 2% | 4,013 | ||||
| Rented | 5% | 35% | 56% | 4% | 628 | ||||
| Number of occupants | |||||||||
| 1 occupant | 2% | 20% | 74% | 3% | 755 | ||||
| 2 occupants | 3% | 27% | 68% | 2% | 1,376 | ||||
| 3 occupants | 5% | 28% | 64% | 3% | 901 | ||||
| 4 occupants | 4% | 33% | 61% | 2% | 975 | ||||
| 5 or more occupants | 6% | 36% | 57% | 1% | 634 | ||||
| Number of children | |||||||||
| 1 person under 18 | 5% | 35% | 59% | 1% | 651 | ||||
| 2 persons under 18 | 4% | 30% | 63% | 3% | 706 | ||||
| 3 or more persons under 18 | 7% | 37% | 54% | 1% | 334 | ||||
| Dwelling type | |||||||||
| Detached house | 4% | 25% | 69% | 2% | 1,854 | ||||
| Semi-detached house | 3% | 28% | 66% | 2% | 1,590 | ||||
| Terraced house | 3% | 30% | 66% | 1% | 713 | ||||
| Flat or apartment in a purpose-built block | 5% | 35% | 55% | 4% | 390 | ||||
| Other | 2% | 42% | 51% | 5% | 94 | ||||
| Construction date | |||||||||
| Before 1961 | 4% | 29% | 66% | 1% | 891 | ||||
| 1961-1980 | 2% | 27% | 69% | 2% | 865 | ||||
| 1981-2000 | 3% | 25% | 70% | 2% | 1,257 | ||||
| 2001 or later | 4% | 31% | 62% | 3% | 1,280 | ||||
| Unknown construction period | 5% | 32% | 57% | 6% | 348 | ||||
| Region | |||||||||
| Border | 6% | 24% | 69% | 1% | 257 | ||||
| Dublin | 3% | 27% | 67% | 3% | 1,725 | ||||
| Mid-East | 4% | 26% | 68% | 2% | 704 | ||||
| Mid-West | 3% | 36% | 60% | 2% | 372 | ||||
| Midland | 2% | 32% | 61% | 5% | 196 | ||||
| South-East | 4% | 30% | 65% | 1% | 357 | ||||
| South-West | 3% | 28% | 66% | 3% | 668 | ||||
| West | 6% | 27% | 64% | 3% | 362 | ||||
| Urban/Rural | |||||||||
| Rural areas | 4% | 27% | 67% | 2% | 1,078 | ||||
| Urban areas | 4% | 27% | 66% | 3% | 2,984 | ||||
| Not known | 4% | 34% | 61% | 1% | 579 | ||||
| Age group of respondent | |||||||||
| 18-34 years | 7% | 39% | 50% | 4% | 586 | ||||
| 35-44 years | 4% | 34% | 60% | 2% | 1,035 | ||||
| 45-54 years | 4% | 32% | 62% | 2% | 1,177 | ||||
| 55-64 years | 2% | 22% | 74% | 3% | 979 | ||||
| 65 years or over | 1% | 13% | 84% | 2% | 864 | ||||
| Sex of respondent | |||||||||
| Male | 4% | 28% | 65% | 3% | 2,194 | ||||
| Female | 3% | 29% | 66% | 2% | 2,447 | ||||
| Working status of respondent | |||||||||
| Working for payment or profit | 4% | 31% | 62% | 2% | 2,939 | ||||
| Retired from employment | 1% | 13% | 84% | 2% | 881 | ||||
| Looking after home or family | 1% | 33% | 62% | 4% | 233 | ||||
| Other | 4% | 33% | 60% | 3% | 588 | ||||
| Table 9C: Does your household receive or buy used electrical or electronic equipment (e.g. phones, laptops, TVs, kitchen appliances) in the form of private gifts, donations or swaps? | |||||||||
| % of weighted households | |||||||||
| Often | Sometimes | Never | No response | Sample Households | |||||
| Total | 1% | 24% | 72% | 3% | 4,641 | ||||
| Nature of occupancy | |||||||||
| Owner-occupied | 1% | 21% | 76% | 2% | 4,013 | ||||
| Rented | 1% | 30% | 64% | 4% | 628 | ||||
| Number of occupants | |||||||||
| 1 occupant | 1% | 22% | 75% | 3% | 755 | ||||
| 2 occupants | 1% | 23% | 73% | 3% | 1,376 | ||||
| 3 occupants | 1% | 22% | 73% | 3% | 901 | ||||
| 4 occupants | 1% | 25% | 70% | 3% | 975 | ||||
| 5 or more occupants | 1% | 28% | 69% | 2% | 634 | ||||
| Number of children | |||||||||
| 1 person under 18 | 1% | 26% | 70% | 4% | 651 | ||||
| 2 persons under 18 | 2% | 30% | 65% | 3% | 706 | ||||
| 3 or more persons under 18 | 1% | 27% | 71% | 1% | 334 | ||||
| Dwelling type | |||||||||
| Detached house | 1% | 21% | 75% | 3% | 1,854 | ||||
| Semi-detached house | 1% | 26% | 71% | 2% | 1,590 | ||||
| Terraced house | 1% | 26% | 71% | 2% | 713 | ||||
| Flat or apartment in a purpose-built block | 2% | 21% | 72% | 5% | 390 | ||||
| Other | 3% | 31% | 61% | 5% | 94 | ||||
| Construction date | |||||||||
| Before 1961 | 1% | 26% | 69% | 3% | 891 | ||||
| 1961-1980 | 1% | 23% | 74% | 2% | 865 | ||||
| 1981-2000 | 1% | 21% | 76% | 2% | 1,257 | ||||
| 2001 or later | 1% | 23% | 73% | 3% | 1,280 | ||||
| Unknown construction period | 1% | 29% | 63% | 6% | 348 | ||||
| Region | |||||||||
| Border | 1% | 23% | 75% | 1% | 257 | ||||
| Dublin | 1% | 24% | 72% | 3% | 1,725 | ||||
| Mid-East | 1% | 22% | 74% | 2% | 704 | ||||
| Mid-West | 0% | 23% | 72% | 4% | 372 | ||||
| Midland | 1% | 29% | 65% | 5% | 196 | ||||
| South-East | 2% | 23% | 71% | 4% | 357 | ||||
| South-West | 1% | 26% | 71% | 3% | 668 | ||||
| West | 2% | 21% | 75% | 3% | 362 | ||||
| Urban/Rural | |||||||||
| Rural areas | 1% | 23% | 73% | 2% | 1,078 | ||||
| Urban areas | 1% | 23% | 73% | 4% | 2,984 | ||||
| Not known | 2% | 28% | 69% | 1% | 579 | ||||
| Age group of respondent | |||||||||
| 18-34 years | 3% | 30% | 60% | 6% | 586 | ||||
| 35-44 years | 1% | 27% | 70% | 2% | 1,035 | ||||
| 45-54 years | 1% | 26% | 70% | 2% | 1,177 | ||||
| 55-64 years | 1% | 20% | 77% | 2% | 979 | ||||
| 65 years or over | 0% | 13% | 84% | 3% | 864 | ||||
| Sex of respondent | |||||||||
| Male | 1% | 19% | 77% | 3% | 2,194 | ||||
| Female | 1% | 28% | 68% | 3% | 2,447 | ||||
| Working status of respondent | |||||||||
| Working for payment or profit | 1% | 26% | 70% | 3% | 2,939 | ||||
| Retired from employment | 0% | 14% | 84% | 2% | 881 | ||||
| Looking after home or family | 0% | 25% | 71% | 4% | 233 | ||||
| Other | 1% | 25% | 69% | 4% | 588 | ||||
| Table 10A: Does your household receive or buy used furniture in charity or second-hand shops? | |||||||||
| % of weighted households | |||||||||
| Often | Sometimes | Never | No response | Sample Households | |||||
| Total | 2% | 31% | 64% | 2% | 4,641 | ||||
| Nature of occupancy | |||||||||
| Owner-occupied | 2% | 27% | 70% | 1% | 4,013 | ||||
| Rented | 4% | 40% | 52% | 4% | 628 | ||||
| Number of occupants | |||||||||
| 1 occupant | 3% | 32% | 63% | 2% | 755 | ||||
| 2 occupants | 2% | 33% | 62% | 2% | 1,376 | ||||
| 3 occupants | 3% | 30% | 66% | 2% | 901 | ||||
| 4 occupants | 2% | 29% | 67% | 2% | 975 | ||||
| 5 or more occupants | 2% | 31% | 66% | 1% | 634 | ||||
| Number of children | |||||||||
| 1 person under 18 | 4% | 30% | 65% | 1% | 651 | ||||
| 2 persons under 18 | 2% | 29% | 67% | 2% | 706 | ||||
| 3 or more persons under 18 | 2% | 31% | 65% | 2% | 334 | ||||
| Dwelling type | |||||||||
| Detached house | 2% | 31% | 65% | 2% | 1,854 | ||||
| Semi-detached house | 3% | 29% | 67% | 1% | 1,590 | ||||
| Terraced house | 3% | 32% | 63% | 2% | 713 | ||||
| Flat or apartment in a purpose-built block | 3% | 33% | 59% | 5% | 390 | ||||
| Other | 5% | 38% | 49% | 9% | 94 | ||||
| Construction date | |||||||||
| Before 1961 | 4% | 38% | 57% | 1% | 891 | ||||
| 1961-1980 | 3% | 29% | 67% | 1% | 865 | ||||
| 1981-2000 | 1% | 29% | 68% | 1% | 1,257 | ||||
| 2001 or later | 2% | 29% | 68% | 1% | 1,280 | ||||
| Unknown construction period | 3% | 35% | 54% | 8% | 348 | ||||
| Region | |||||||||
| Border | 2% | 32% | 64% | 1% | 257 | ||||
| Dublin | 2% | 26% | 70% | 2% | 1,725 | ||||
| Mid-East | 3% | 30% | 65% | 3% | 704 | ||||
| Mid-West | 1% | 35% | 62% | 2% | 372 | ||||
| Midland | 1% | 38% | 58% | 2% | 196 | ||||
| South-East | 3% | 32% | 63% | 2% | 357 | ||||
| South-West | 3% | 33% | 63% | 2% | 668 | ||||
| West | 3% | 36% | 58% | 4% | 362 | ||||
| Urban/Rural | |||||||||
| Rural areas | 2% | 34% | 63% | 1% | 1,078 | ||||
| Urban areas | 2% | 29% | 67% | 2% | 2,984 | ||||
| Not known | 5% | 35% | 57% | 3% | 579 | ||||
| Age group of respondent | |||||||||
| 18-34 years | 4% | 36% | 56% | 4% | 586 | ||||
| 35-44 years | 4% | 32% | 62% | 2% | 1,035 | ||||
| 45-54 years | 2% | 31% | 65% | 2% | 1,177 | ||||
| 55-64 years | 2% | 32% | 65% | 1% | 979 | ||||
| 65 years or over | 1% | 24% | 74% | 2% | 864 | ||||
| Sex of respondent | |||||||||
| Male | 1% | 24% | 73% | 2% | 2,194 | ||||
| Female | 3% | 37% | 58% | 2% | 2,447 | ||||
| Working status of respondent | |||||||||
| Working for payment or profit | 2% | 30% | 66% | 2% | 2,939 | ||||
| Retired from employment | 1% | 25% | 73% | 1% | 881 | ||||
| Looking after home or family | 3% | 40% | 55% | 2% | 233 | ||||
| Other | 4% | 38% | 54% | 4% | 588 | ||||
| Table 10B: Does your household receive or buy used furniture through an online platform? | |||||||||
| % of weighted households | |||||||||
| Often | Sometimes | Never | No response | Sample Households | |||||
| Total | 2% | 23% | 73% | 3% | 4,641 | ||||
| Nature of occupancy | |||||||||
| Owner-occupied | 1% | 20% | 77% | 2% | 4,013 | ||||
| Rented | 2% | 32% | 62% | 4% | 628 | ||||
| Number of occupants | |||||||||
| 1 occupant | 2% | 15% | 80% | 4% | 755 | ||||
| 2 occupants | 1% | 21% | 75% | 3% | 1,376 | ||||
| 3 occupants | 1% | 24% | 71% | 3% | 901 | ||||
| 4 occupants | 1% | 29% | 67% | 3% | 975 | ||||
| 5 or more occupants | 3% | 29% | 67% | 1% | 634 | ||||
| Number of children | |||||||||
| 1 person under 18 | 2% | 29% | 67% | 3% | 651 | ||||
| 2 persons under 18 | 2% | 32% | 63% | 2% | 706 | ||||
| 3 or more persons under 18 | 3% | 32% | 64% | 1% | 334 | ||||
| Dwelling type | |||||||||
| Detached house | 1% | 20% | 76% | 2% | 1,854 | ||||
| Semi-detached house | 2% | 24% | 72% | 2% | 1,590 | ||||
| Terraced house | 2% | 24% | 71% | 3% | 713 | ||||
| Flat or apartment in a purpose-built block | 2% | 28% | 65% | 5% | 390 | ||||
| Other | 2% | 29% | 62% | 7% | 94 | ||||
| Construction date | |||||||||
| Before 1961 | 3% | 24% | 71% | 2% | 891 | ||||
| 1961-1980 | 1% | 22% | 75% | 2% | 865 | ||||
| 1981-2000 | 1% | 22% | 76% | 2% | 1,257 | ||||
| 2001 or later | 2% | 24% | 72% | 3% | 1,280 | ||||
| Unknown construction period | 1% | 27% | 65% | 7% | 348 | ||||
| Region | |||||||||
| Border | 1% | 24% | 74% | 2% | 257 | ||||
| Dublin | 2% | 24% | 71% | 3% | 1,725 | ||||
| Mid-East | 2% | 25% | 70% | 3% | 704 | ||||
| Mid-West | 1% | 24% | 72% | 3% | 372 | ||||
| Midland | 1% | 27% | 70% | 3% | 196 | ||||
| South-East | 2% | 22% | 75% | 2% | 357 | ||||
| South-West | 2% | 21% | 75% | 2% | 668 | ||||
| West | 1% | 19% | 75% | 4% | 362 | ||||
| Urban/Rural | |||||||||
| Rural areas | 1% | 19% | 78% | 2% | 1,078 | ||||
| Urban areas | 1% | 23% | 72% | 3% | 2,984 | ||||
| Not known | 2% | 29% | 65% | 4% | 579 | ||||
| Age group of respondent | |||||||||
| 18-34 years | 3% | 36% | 56% | 5% | 586 | ||||
| 35-44 years | 2% | 31% | 64% | 3% | 1,035 | ||||
| 45-54 years | 2% | 25% | 71% | 3% | 1,177 | ||||
| 55-64 years | 0% | 15% | 82% | 2% | 979 | ||||
| 65 years or over | 0% | 7% | 91% | 1% | 864 | ||||
| Sex of respondent | |||||||||
| Male | 1% | 18% | 78% | 3% | 2,194 | ||||
| Female | 2% | 28% | 68% | 3% | 2,447 | ||||
| Working status of respondent | |||||||||
| Working for payment or profit | 2% | 26% | 70% | 2% | 2,939 | ||||
| Retired from employment | 0% | 7% | 91% | 2% | 881 | ||||
| Looking after home or family | 2% | 27% | 70% | 2% | 233 | ||||
| Other | 1% | 29% | 64% | 5% | 588 | ||||
| Table 10C: Does your household receive or buy used furniture in the form of private gifts, donations or swaps? | |||||||||
| % of weighted households | |||||||||
| Often | Sometimes | Never | No response | Sample Households | |||||
| Total | 1% | 27% | 69% | 3% | 4,641 | ||||
| Nature of occupancy | |||||||||
| Owner-occupied | 1% | 23% | 73% | 2% | 4,013 | ||||
| Rented | 1% | 36% | 59% | 4% | 628 | ||||
| Number of occupants | |||||||||
| 1 occupant | 1% | 26% | 70% | 3% | 755 | ||||
| 2 occupants | 1% | 24% | 72% | 3% | 1,376 | ||||
| 3 occupants | 1% | 30% | 67% | 3% | 901 | ||||
| 4 occupants | 2% | 30% | 66% | 2% | 975 | ||||
| 5 or more occupants | 1% | 27% | 68% | 4% | 634 | ||||
| Number of children | |||||||||
| 1 person under 18 | 2% | 30% | 66% | 3% | 651 | ||||
| 2 persons under 18 | 2% | 33% | 63% | 2% | 706 | ||||
| 3 or more persons under 18 | 1% | 33% | 64% | 2% | 334 | ||||
| Dwelling type | |||||||||
| Detached house | 1% | 25% | 72% | 3% | 1,854 | ||||
| Semi-detached house | 1% | 29% | 68% | 2% | 1,590 | ||||
| Terraced house | 1% | 30% | 67% | 2% | 713 | ||||
| Flat or apartment in a purpose-built block | 1% | 26% | 69% | 4% | 390 | ||||
| Other | 3% | 29% | 59% | 9% | 94 | ||||
| Construction date | |||||||||
| Before 1961 | 2% | 32% | 64% | 2% | 891 | ||||
| 1961-1980 | 2% | 22% | 74% | 2% | 865 | ||||
| 1981-2000 | 1% | 25% | 72% | 2% | 1,257 | ||||
| 2001 or later | 1% | 29% | 68% | 3% | 1,280 | ||||
| Unknown construction period | 2% | 27% | 65% | 6% | 348 | ||||
| Region | |||||||||
| Border | 2% | 22% | 74% | 2% | 257 | ||||
| Dublin | 1% | 27% | 69% | 3% | 1,725 | ||||
| Mid-East | 1% | 29% | 68% | 2% | 704 | ||||
| Mid-West | 1% | 25% | 71% | 3% | 372 | ||||
| Midland | 0% | 33% | 62% | 5% | 196 | ||||
| South-East | 2% | 26% | 68% | 3% | 357 | ||||
| South-West | 1% | 26% | 70% | 3% | 668 | ||||
| West | 1% | 30% | 67% | 3% | 362 | ||||
| Urban/Rural | |||||||||
| Rural areas | 1% | 26% | 70% | 3% | 1,078 | ||||
| Urban areas | 1% | 27% | 69% | 3% | 2,984 | ||||
| Not known | 2% | 30% | 66% | 3% | 579 | ||||
| Age group of respondent | |||||||||
| 18-34 years | 3% | 32% | 61% | 5% | 586 | ||||
| 35-44 years | 2% | 31% | 65% | 2% | 1,035 | ||||
| 45-54 years | 1% | 29% | 69% | 2% | 1,177 | ||||
| 55-64 years | 0% | 26% | 72% | 2% | 979 | ||||
| 65 years or over | 0% | 16% | 81% | 3% | 864 | ||||
| Sex of respondent | |||||||||
| Male | 1% | 19% | 78% | 3% | 2,194 | ||||
| Female | 2% | 34% | 62% | 2% | 2,447 | ||||
| Working status of respondent | |||||||||
| Working for payment or profit | 1% | 30% | 67% | 2% | 2,939 | ||||
| Retired from employment | 0% | 18% | 79% | 2% | 881 | ||||
| Looking after home or family | 1% | 30% | 67% | 1% | 233 | ||||
| Other | 2% | 25% | 68% | 5% | 588 | ||||
The data were collected as part of the CSO General Household Survey (GHS). The GHS is a national survey that takes place three or four times each year and is part of an EU-wide programme. Each survey usually has a specific theme: for example in Quarter 3, 2021 the modules were "Personal and Work-Life Balance" and "Environment". The purpose of the Environment module was to collect information on household environmental behaviours.
The survey was planned for Quarter 3, 2021. A slight delay arose; therefore data were collected during the three months from August to October 2021.
A copy of the questionnaire is available at: Household Environmental Behaviours
The questionnaire consisted of a short series of questions on household socio-demographic characteristics and on four topics relating to the environment: opinions on environmental issues; visits to nature areas; waste management and recycling; and energy use. The CSO formed a project group consisting of representatives from the Environmental Protection Agency, the Sustainable Energy Authority of Ireland, the CSO Environment and Climate Division and the CSO Ecosystem Accounts Division to develop the questionnaire so that it would meet statistical and policy needs.
In Quarter 2 of 2014 the CSO collected data on household environment behaviours as part of the Quarterly National Household Survey (QNHS). The QNHS Environment module questionnaire contained questions on household waste and recycling and on energy use by households. A number of questions from the 2014 survey were repeated in this questionnaire. In addition, new questions on waste and recycling and on energy use were incorporated into the questionnaire, while two new sections, Household Environmental Concerns and Household Visits to Nature Areas, were also added.
The GHS Environment module was an online survey of households. Households that were selected in the sample received a letter in the post providing a link to the survey and a QR code along with an access code.
The sample was selected from the Household Sampling Frame, also known as the Ordinarily Resident Frame (ORF). The ORF dataset is produced by combining Local Property Tax (LPT) owner-occupied property data with Residential Tenancies Board (RTB) tenant-occupied property data.
The sample was selected using a Stratified Simple Random Sample, stratified by county and type of occupancy. Type of occupancy consisted of three groups: LPT owner-occupied properties, LPT local authority rental properties, and RTB private rental properties. A sample of 25,000 was selected.
In advance of finalising the sample, a data matching exercise was undertaken to enhance the Eircode coverage in the ORF. This was done in order to aid delivery of letters to correct households, thus potentially increasing response rates and enabling an improved match to Census of Population data to acquire household composition variables.
The data matching exercise was carried out on 30,000 households. Addresses were matched to the GeoDirectory, Census of Population and the Local Property Tax datasets. Eircode coverage was enhanced to 23,435 cases. The remaining 1,565 sample was randomly selected from 6,565 unmatched Eircode records, bringing the total sample to 25,000.
In order to account for unoccupied properties, households were weighted by county and type of tenure to the population totals recorded in the 2016 Census of Population. The total number of households was 1.7 million households. The population of households was defined as occupied private households on Census night 2016.
The module results are based on responses from 4,641 households. These households were weighted by county and type of occupancy (owner-occupied and rented) to represent all occupied households in the State. The data were matched to the Census of Population dataset in order to add certain Census variables such as whether the household is in an urban or a rural area.
Sample
A stratified random sample was selected from the Ordinarily Resident Frame. The original sample size was 30,000 in order to enhance Eircode coverage and hence matching to Census of Population data. All records with Eircode coverage were then selected to be part of the final sample of 25,000. As a result the final sample was not perfectly random; however the benefits in terms of improving receipt of letters by the correct households and hence response rates were considered to justify the approach.
Coverage
The ORF is updated annually with LPT data and quarterly with RTB data. The most recent update at the time of the Environment module was Quarter 4, 2020. The LPT data source identifies properties which are principal private residences of tax-resident persons. It is also possible to identify Local Authority (L.A.)-owned rental properties from the LPT. All privately-owned and Approved Housing Board-owned and rental properties are required to be registered with the RTB. Combining the LPT (taking the owner-occupied properties of tax-resident persons, plus the L.A. rental properties) and the RTB (for private rental properties and AHB rental properties) is considered to make a satisfactory household survey sampling frame.
Measurement
The questionnaire repeated a number of questions which had been included in the QHNS Environment module of Quarter 2 of 2014. The majority of the remaining questions were derived from Eurobarometer questionnaires and from the People and Nature Survey (PANS) questionnaire used in England to gather data on people’s enjoyment, access, understanding of and attitudes to the natural environment.
All questions were assessed for suitability in an Irish context and for an online survey which was to be completed on a device such as a laptop, smartphone or tablet. Each section of the questionnaire was discussed and reviewed by the relevant members of the project group.
Response
The usable response rate for the survey was 18.6%. Three reminders were issued to households in order to increase the response rate. The time taken to fill the questionnaire was kept to approximately ten minutes in order to reduce non-response.
Each table in this release contains figures showing the number of respondent households. The number of households in the population, based on the 2016 Census, was 1,666,266.
While most respondents provided responses to all questions in the questionnaire, some respondents did not answer all questions. The release tables include proportions of non-respondents to specific questions where relevant.
From respondent households who were requested to participate in the module, one person volunteered to respond on behalf of the entire household. Due to the voluntary nature of the household respondent, individual characteristics may not be representative of the population as a whole when compared to a sample survey with a random selection of a respondent.
The row percentages in the tables in this report may not add to 100% due to rounding. Cells containing zero percent include cases where the percentage of respondents in that category was less than 0.5% as well as cases where there was no respondent in that category.
The Environment module questionnaire included a section on sociodemographic characteristics of the household and the individual respondent. In addition information on type of occupancy was available from the ORF. Finally, a Census variable classifying households by whether they are located in rural or urban areas was added to the dataset. This variable was missing for a significant proportion of households due to the incomplete match between the ORF and the Census. The classification variables are outlined below.
Type of Tenure
This classification was available from the ORF. Households were classified as Owner-occupied or Rented.
Number of Occupants
Respondents were asked: Including you, how many people live in this household?
Number of Children
Respondents were asked: How many children under 18 live in this household?
Dwelling Type
Respondents were asked: What type of accommodation does your household live in? The type of dwelling the respondents lived in were categorised as follows:
Construction Date
Respondents were asked: When was your house, flat or apartment built? The responses were classified to the following categories:
NUTS 3 Regions
The regional classification used in this release is based on the NUTS (Nomenclature of Territorial Units) classification used by Eurostat. The composition of the regions is set out below.
Urban/Rural Location
Areas are classified as Urban or Rural based on Census of Population 2016. Urban refers to settlements with a total population of 1,500 or more. Rural refers to the population outside urban areas and includes towns with a population of less than 1,500 persons.
Age
Respondents were asked: What is your age? Responses were categorised as:
Sex
Respondents were asked: What is your sex? Responses were categorised as Female or Male.
Household Working Status
Respondents were asked: Which of the following categories best describes your current situation? Responses were categorised as:
Please contact environment@cso.ie with any queries or requests for further analysis.
The Central Statistics Office wishes to thank the respondent households for their participation in the survey.
 Hide Background Notes
Scan the QR code below to view this release online or go to
http://www.cso.ie/en/releasesandpublications/er/hebwr/householdenvironmentalbehaviours-wasteandrecyclingquarter32021/
 Show Table 1: What is your household’s main method for disposing of NON-RECYCLABLE household waste (e.g. heavily soiled food packaging)?
  Hide Table 1: What is your household’s main method for disposing of NON-RECYCLABLE household waste (e.g. heavily soiled food packaging)?