
| Table A: Main Heating Fuel by Region, Quarter 3 2021 | |||||||||
| % of weighted households | |||||||||
| Natural gas | Heating oil1 | Electricity | Solid fuel2 | Other | |||||
| Border | 4% | 66% | 7% | 20% | 2% | ||||
| Dublin | 69% | 8% | 18% | 2% | 1% | ||||
| Mid-East | 45% | 36% | 8% | 6% | 2% | ||||
| Mid-West | 27% | 43% | 13% | 13% | 3% | ||||
| Midland | 16% | 44% | 6% | 31% | 2% | ||||
| South-East | 20% | 52% | 11% | 14% | 1% | ||||
| South-West | 33% | 44% | 11% | 8% | 2% | ||||
| West | 6% | 58% | 13% | 17% | 3% | ||||
| State | 37% | 37% | 12% | 11% | 2% | ||||
| 1Kerosene, diesel/gas oil and LPG | |||||||||
| 2Wood logs, coal, peat and wood pellets | |||||||||
Some of the main findings from the CSO Household Environmental Behaviours survey on Energy Use are:
Table A shows a breakdown by region of the main heating fuel or energy source used by households to heat their homes. The region most likely to use natural gas was Dublin (69%) while natural gas was least likely to be used in the Border region (4%) and the West (6%) where the availability of networked natural gas is limited. In contrast, home heating oil was most likely to be used as the main heating fuel by households in the Border region (66%) followed by the West (58%), and least likely to be used in Dublin (8%).
Dublin was also the region most likely to use electricity as the main household heating source (18%) while electricity was used by just 6% of Midland households as their primary source of heating. Use of solid fuels (wood logs, coal, peat and wood pellets) also varied by region and was highest in the Midland region where 31% of households used solid fuel as their main heating fuel. It was lowest in Dublin with 2% of households reporting using a solid fuel as their primary heating fuel.
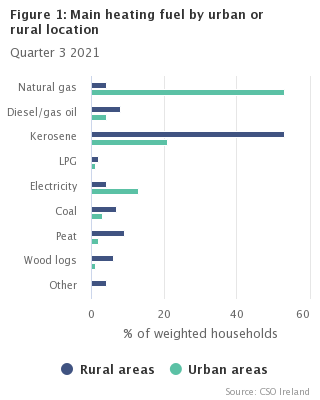
Figure 1 shows a comparison of the main fuels or energy sources used to heat homes by urban and rural location. In urban areas 53% of households used natural gas as the main heating fuel in their homes while in rural areas 53% of households reported that kerosene was their main heating fuel.
Figure 2 shows a comparison of fuels used for additional heating in open fires by urban and rural location. A majority of households (73%) did not use an open fire for additional heating. In rural areas 22% of households used wood logs in their open fire for additional heating, 22% used coal and 15% used peat.
| Rural areas | Urban areas | |
| Wood logs | 22 | 16 |
| Coal/ smokeless coal | 22 | 18 |
| Peat | 15 | 11 |
| Not relevant | 67 | 75 |
Table 2 shows additional heating sources used by households to heat their homes while Tables 3-5 provide details on the fuels used in additional heating sources. Table 6 shows that 68% of households used electricity for cooking, 14% used natural gas and 13% used a combination of electricity and natural gas.
Figure 3 shows a breakdown by type of dwelling of home installations of certain energy efficiency and renewable energy equipment.
| Heat pump | Photovoltaic (PV) solar panel | Thermal solar panel | Smart heating controls | None of the above | |
| Detached house | 10 | 5 | 9 | 16 | 63 |
| Semi-detached house | 7 | 2 | 3 | 21 | 65 |
| Terraced house | 6 | 2 | 1 | 16 | 72 |
| Flat or apartment in a purpose-built block | 8 | 0 | 0 | 8 | 76 |
| Other | 6 | 1 | 1 | 8 | 66 |
Households whose dwelling type was a flat or apartment in a purpose-built block were least likely to have renewable energy or energy efficiency equipment installed in their home, with 76% reporting that they did not have solar panels, a heat pump or smart heating controls installed compared with 63% of households living in detached houses.
Smart heating controls were the type of equipment most likely to be installed in all dwelling types at 21% of semi-detached houses and 16% of both detached and terraced houses. Detached houses were most likely to have photovoltaic (PV) solar panels, thermal solar panels and heat pumps. See Table 7 for a full breakdown of home installations by household characteristics.
Table 8A shows that 4% of households have an electric vehicle while Table 8B shows that the majority of those charge their electric vehicle at home. Households were also asked whether they were likely to purchase an electric vehicle when next changing car (see Table 8D). A breakdown of responses by urban or rural location is shown in Figure 4.
| Rural areas | Urban areas | |
| Yes | 20 | 26 |
| No | 41 | 28 |
| Do not know | 36 | 39 |
| Not relevant | 3 | 8 |
Almost one quarter of households nationally stated that they were likely to purchase an electric vehicle when next changing car. Urban households were more likely to intend to purchase and electric car (26%) than rural households (20%).
This release is one of four statistical releases based on the CSO General Household Survey Environment module from Quarter 3, 2021. The other three reports cover Environmental Concerns; Visits to Nature Areas; and Waste and Recycling.
| Table 1: What is the main fuel or energy source used to heat your home? | |||||||||||||||||||||||||||||
| % of weighted households | |||||||||||||||||||||||||||||
| Natural gas | Diesel/ gas oil | Kerosene | Liquid Petroleum Gas (LPG) | Electricity | Coal/ smokeless coal | Peat | Wood pellets/ wood chips | Wood logs | Heat pump | District heating | Other | None | No response | Sample Households | |||||||||||||||
| Total | 37% | 6% | 30% | 1% | 12% | 4% | 4% | 0% | 3% | 2% | 0% | 0% | 0% | 1% | 4,641 | ||||||||||||||
| Nature of occupancy | |||||||||||||||||||||||||||||
| Owner-occupied | 36% | 7% | 35% | 2% | 7% | 3% | 4% | 1% | 3% | 2% | 0% | 0% | 0% | 1% | 4,013 | ||||||||||||||
| Rented | 41% | 3% | 17% | 1% | 26% | 4% | 3% | 0% | 1% | 1% | 1% | 0% | 0% | 2% | 628 | ||||||||||||||
| Number of occupants | |||||||||||||||||||||||||||||
| 1 occupant | 34% | 6% | 26% | 1% | 21% | 5% | 4% | 1% | 1% | 0% | 0% | 0% | 0% | 1% | 755 | ||||||||||||||
| 2 occupants | 37% | 5% | 28% | 1% | 15% | 3% | 3% | 0% | 3% | 2% | 0% | 0% | 0% | 1% | 1,376 | ||||||||||||||
| 3 occupants | 39% | 7% | 29% | 1% | 9% | 3% | 5% | 0% | 4% | 1% | 0% | 0% | 0% | 1% | 901 | ||||||||||||||
| 4 occupants | 41% | 5% | 32% | 1% | 7% | 3% | 3% | 0% | 3% | 2% | 0% | 0% | 0% | 1% | 975 | ||||||||||||||
| 5 or more occupants | 33% | 5% | 36% | 1% | 7% | 5% | 5% | 1% | 3% | 3% | 0% | 0% | 0% | 1% | 634 | ||||||||||||||
| Number of children | |||||||||||||||||||||||||||||
| 1 person under 18 | 43% | 6% | 27% | 1% | 10% | 3% | 3% | 0% | 3% | 3% | 0% | 0% | 0% | 0% | 651 | ||||||||||||||
| 2 persons under 18 | 41% | 4% | 34% | 1% | 6% | 4% | 3% | 0% | 3% | 2% | 1% | 0% | 0% | 1% | 706 | ||||||||||||||
| 3 or more persons under 18 | 34% | 6% | 34% | 1% | 7% | 4% | 6% | 0% | 3% | 3% | 0% | 1% | 0% | 1% | 334 | ||||||||||||||
| Dwelling type | |||||||||||||||||||||||||||||
| Detached house | 17% | 9% | 47% | 2% | 6% | 3% | 6% | 1% | 4% | 3% | 0% | 0% | 0% | 1% | 1,854 | ||||||||||||||
| Semi-detached house | 52% | 4% | 25% | 1% | 6% | 5% | 3% | 0% | 3% | 1% | 0% | 0% | 0% | 1% | 1,590 | ||||||||||||||
| Terraced house | 61% | 4% | 17% | 1% | 8% | 4% | 3% | 0% | 1% | 1% | 0% | 0% | 0% | 0% | 713 | ||||||||||||||
| Flat or apartment in a purpose-built block | 41% | 1% | 1% | 0% | 51% | 0% | 0% | 0% | 0% | 0% | 1% | 0% | 0% | 4% | 390 | ||||||||||||||
| Other | 22% | 5% | 7% | 1% | 53% | 6% | 0% | 1% | 3% | 0% | 0% | 0% | 1% | 2% | 94 | ||||||||||||||
| Construction date | |||||||||||||||||||||||||||||
| Before 1961 | 42% | 7% | 27% | 0% | 9% | 4% | 4% | 0% | 4% | 1% | 0% | 0% | 0% | 1% | 891 | ||||||||||||||
| 1961-1980 | 40% | 7% | 31% | 1% | 7% | 5% | 4% | 1% | 3% | 0% | 0% | 0% | 0% | 1% | 865 | ||||||||||||||
| 1981-2000 | 35% | 6% | 35% | 1% | 9% | 4% | 5% | 1% | 3% | 1% | 0% | 0% | 0% | 0% | 1,257 | ||||||||||||||
| 2001 or later | 36% | 5% | 31% | 2% | 12% | 3% | 3% | 0% | 2% | 4% | 0% | 0% | 0% | 1% | 1,280 | ||||||||||||||
| Unknown construction period | 32% | 4% | 17% | 1% | 34% | 2% | 2% | 0% | 2% | 0% | 1% | 0% | 1% | 3% | 348 | ||||||||||||||
| Region | |||||||||||||||||||||||||||||
| Border | 4% | 8% | 56% | 2% | 7% | 10% | 5% | 1% | 4% | 2% | 0% | 0% | 0% | 1% | 257 | ||||||||||||||
| Dublin | 69% | 2% | 6% | 0% | 18% | 1% | 0% | 0% | 1% | 1% | 0% | 0% | 0% | 1% | 1,725 | ||||||||||||||
| Mid-East | 45% | 5% | 29% | 2% | 8% | 1% | 2% | 0% | 3% | 2% | 0% | 0% | 0% | 1% | 704 | ||||||||||||||
| Mid-West | 27% | 8% | 34% | 1% | 13% | 5% | 3% | 1% | 4% | 3% | 0% | 0% | 0% | 1% | 372 | ||||||||||||||
| Midland | 16% | 8% | 33% | 3% | 6% | 5% | 21% | 3% | 2% | 2% | 0% | 0% | 0% | 1% | 196 | ||||||||||||||
| South-East | 20% | 5% | 45% | 2% | 11% | 8% | 1% | 0% | 5% | 1% | 0% | 0% | 0% | 0% | 357 | ||||||||||||||
| South-West | 33% | 8% | 35% | 1% | 11% | 4% | 1% | 0% | 3% | 1% | 1% | 0% | 0% | 1% | 668 | ||||||||||||||
| West | 6% | 9% | 48% | 1% | 13% | 2% | 11% | 0% | 4% | 2% | 0% | 1% | 0% | 2% | 362 | ||||||||||||||
| Urban/Rural | |||||||||||||||||||||||||||||
| Rural areas | 4% | 8% | 53% | 2% | 4% | 7% | 9% | 1% | 6% | 3% | 0% | 0% | 0% | 1% | 1,078 | ||||||||||||||
| Urban areas | 53% | 4% | 21% | 1% | 13% | 3% | 2% | 0% | 1% | 0% | 0% | 0% | 0% | 1% | 2,984 | ||||||||||||||
| Not known | 28% | 7% | 26% | 1% | 24% | 2% | 4% | 0% | 3% | 3% | 1% | 0% | 0% | 1% | 579 | ||||||||||||||
| Age group of respondent | |||||||||||||||||||||||||||||
| 18-34 years | 34% | 4% | 19% | 1% | 28% | 2% | 4% | 0% | 2% | 1% | 1% | 0% | 0% | 4% | 586 | ||||||||||||||
| 35-44 years | 40% | 5% | 25% | 1% | 15% | 2% | 4% | 0% | 2% | 2% | 0% | 0% | 0% | 1% | 1,035 | ||||||||||||||
| 45-54 years | 40% | 5% | 32% | 1% | 9% | 4% | 3% | 0% | 2% | 1% | 0% | 0% | 0% | 0% | 1,177 | ||||||||||||||
| 55-64 years | 35% | 6% | 37% | 2% | 6% | 4% | 4% | 0% | 4% | 1% | 0% | 0% | 0% | 1% | 979 | ||||||||||||||
| 65 years or over | 33% | 8% | 34% | 2% | 6% | 6% | 4% | 1% | 4% | 1% | 0% | 0% | 0% | 0% | 864 | ||||||||||||||
| Sex of respondent | |||||||||||||||||||||||||||||
| Male | 39% | 5% | 30% | 2% | 12% | 3% | 3% | 1% | 2% | 1% | 0% | 0% | 0% | 1% | 2,194 | ||||||||||||||
| Female | 35% | 6% | 29% | 1% | 12% | 4% | 5% | 0% | 3% | 2% | 0% | 0% | 0% | 1% | 2,447 | ||||||||||||||
| Working status of respondent | |||||||||||||||||||||||||||||
| Working for payment or profit | 40% | 6% | 29% | 1% | 12% | 3% | 3% | 0% | 2% | 2% | 0% | 0% | 0% | 1% | 2,939 | ||||||||||||||
| Retired from employment | 33% | 8% | 35% | 1% | 6% | 5% | 4% | 1% | 4% | 2% | 0% | 0% | 0% | 0% | 881 | ||||||||||||||
| Looking after home or family | 27% | 4% | 41% | 2% | 9% | 3% | 7% | 0% | 4% | 2% | 0% | 0% | 0% | 1% | 233 | ||||||||||||||
| Other | 34% | 4% | 21% | 1% | 22% | 6% | 5% | 1% | 2% | 1% | 0% | 1% | 0% | 2% | 588 | ||||||||||||||
| Table 2: Is any additional heating used to heat your home? | |||||||||||||||||||||||||
| % of weighted households | |||||||||||||||||||||||||
| Open fire | Open fire with back boiler | Stove or range | Stove or range with back boiler | Portable room heaters | Decorative effect fires | Electric storage heaters | Plug-in electric room heaters | Electric underfloor heating | Other | None | No response | Sample Households | |||||||||||||
| Total | 23% | 5% | 24% | 7% | 4% | 4% | 3% | 16% | 2% | 3% | 23% | 5% | 4,641 | ||||||||||||
| Nature of occupancy | |||||||||||||||||||||||||
| Owner-occupied | 23% | 5% | 29% | 9% | 3% | 4% | 2% | 16% | 2% | 3% | 20% | 4% | 4,013 | ||||||||||||
| Rented | 23% | 4% | 11% | 3% | 7% | 3% | 6% | 17% | 2% | 3% | 32% | 5% | 628 | ||||||||||||
| Number of occupants | |||||||||||||||||||||||||
| 1 occupant | 19% | 3% | 17% | 5% | 4% | 5% | 6% | 22% | 1% | 4% | 28% | 3% | 755 | ||||||||||||
| 2 occupants | 22% | 4% | 22% | 7% | 6% | 4% | 5% | 19% | 3% | 3% | 23% | 5% | 1,376 | ||||||||||||
| 3 occupants | 24% | 6% | 24% | 9% | 3% | 4% | 2% | 15% | 2% | 3% | 24% | 5% | 901 | ||||||||||||
| 4 occupants | 24% | 4% | 28% | 8% | 4% | 4% | 2% | 13% | 1% | 3% | 22% | 5% | 975 | ||||||||||||
| 5 or more occupants | 29% | 5% | 29% | 10% | 3% | 3% | 2% | 12% | 2% | 5% | 18% | 4% | 634 | ||||||||||||
| Number of children | |||||||||||||||||||||||||
| 1 person under 18 | 23% | 6% | 26% | 5% | 3% | 3% | 2% | 14% | 2% | 2% | 27% | 3% | 651 | ||||||||||||
| 2 persons under 18 | 26% | 4% | 27% | 7% | 4% | 3% | 1% | 11% | 1% | 4% | 22% | 5% | 706 | ||||||||||||
| 3 or more persons under 18 | 29% | 6% | 33% | 10% | 4% | 2% | 1% | 10% | 3% | 4% | 18% | 4% | 334 | ||||||||||||
| Dwelling type | |||||||||||||||||||||||||
| Detached house | 26% | 5% | 37% | 13% | 3% | 3% | 2% | 17% | 2% | 4% | 11% | 4% | 1,854 | ||||||||||||
| Semi-detached house | 28% | 6% | 19% | 4% | 4% | 4% | 1% | 17% | 2% | 3% | 25% | 4% | 1,590 | ||||||||||||
| Terraced house | 22% | 5% | 17% | 3% | 3% | 5% | 2% | 13% | 1% | 2% | 32% | 6% | 713 | ||||||||||||
| Flat or apartment in a purpose-built block | 3% | 0% | 0% | 1% | 12% | 5% | 15% | 17% | 2% | 3% | 46% | 7% | 390 | ||||||||||||
| Other | 8% | 4% | 4% | 4% | 6% | 2% | 11% | 15% | 1% | 2% | 42% | 6% | 94 | ||||||||||||
| Construction date | |||||||||||||||||||||||||
| Before 1961 | 24% | 5% | 29% | 9% | 4% | 4% | 3% | 16% | 3% | 2% | 20% | 4% | 891 | ||||||||||||
| 1961-1980 | 21% | 6% | 24% | 8% | 7% | 5% | 2% | 17% | 2% | 4% | 21% | 4% | 865 | ||||||||||||
| 1981-2000 | 24% | 6% | 25% | 8% | 4% | 4% | 3% | 18% | 2% | 3% | 21% | 4% | 1,257 | ||||||||||||
| 2001 or later | 24% | 3% | 25% | 6% | 3% | 4% | 3% | 15% | 2% | 3% | 25% | 4% | 1,280 | ||||||||||||
| Unknown construction period | 20% | 3% | 7% | 5% | 6% | 2% | 8% | 17% | 2% | 5% | 32% | 9% | 348 | ||||||||||||
| Region | |||||||||||||||||||||||||
| Border | 28% | 14% | 23% | 14% | 5% | 4% | 2% | 17% | 0% | 6% | 12% | 4% | 257 | ||||||||||||
| Dublin | 16% | 1% | 13% | 1% | 4% | 4% | 5% | 18% | 3% | 2% | 39% | 7% | 1,725 | ||||||||||||
| Mid-East | 26% | 4% | 22% | 4% | 3% | 4% | 3% | 16% | 2% | 2% | 27% | 3% | 704 | ||||||||||||
| Mid-West | 19% | 3% | 33% | 8% | 8% | 5% | 2% | 14% | 1% | 2% | 19% | 3% | 372 | ||||||||||||
| Midland | 29% | 5% | 34% | 14% | 2% | 0% | 2% | 11% | 3% | 5% | 13% | 4% | 196 | ||||||||||||
| South-East | 27% | 7% | 25% | 12% | 5% | 5% | 2% | 17% | 1% | 2% | 16% | 4% | 357 | ||||||||||||
| South-West | 29% | 4% | 29% | 6% | 4% | 4% | 3% | 16% | 2% | 4% | 16% | 3% | 668 | ||||||||||||
| West | 21% | 7% | 30% | 17% | 3% | 2% | 5% | 19% | 2% | 7% | 11% | 5% | 362 | ||||||||||||
| Urban/Rural | |||||||||||||||||||||||||
| Rural areas | 28% | 6% | 38% | 18% | 2% | 2% | 1% | 16% | 2% | 4% | 7% | 4% | 1,078 | ||||||||||||
| Urban areas | 22% | 4% | 18% | 3% | 4% | 5% | 4% | 16% | 2% | 3% | 30% | 5% | 2,984 | ||||||||||||
| Not known | 19% | 4% | 22% | 7% | 7% | 3% | 5% | 18% | 2% | 3% | 24% | 4% | 579 | ||||||||||||
| Age group of respondent | |||||||||||||||||||||||||
| 18-34 years | 21% | 4% | 12% | 6% | 6% | 4% | 6% | 17% | 2% | 3% | 28% | 10% | 586 | ||||||||||||
| 35-44 years | 22% | 4% | 23% | 8% | 6% | 2% | 4% | 12% | 2% | 2% | 27% | 4% | 1,035 | ||||||||||||
| 45-54 years | 25% | 4% | 27% | 6% | 3% | 5% | 2% | 16% | 2% | 4% | 22% | 4% | 1,177 | ||||||||||||
| 55-64 years | 26% | 4% | 28% | 8% | 4% | 4% | 3% | 17% | 2% | 4% | 19% | 3% | 979 | ||||||||||||
| 65 years or over | 21% | 7% | 27% | 9% | 2% | 5% | 2% | 22% | 2% | 3% | 19% | 4% | 864 | ||||||||||||
| Sex of respondent | |||||||||||||||||||||||||
| Male | 21% | 4% | 23% | 7% | 4% | 4% | 3% | 17% | 3% | 3% | 26% | 4% | 2,194 | ||||||||||||
| Female | 25% | 5% | 24% | 8% | 5% | 4% | 4% | 16% | 2% | 3% | 21% | 5% | 2,447 | ||||||||||||
| Working status of respondent | |||||||||||||||||||||||||
| Working for payment or profit | 23% | 4% | 24% | 6% | 4% | 4% | 4% | 16% | 2% | 4% | 25% | 5% | 2,939 | ||||||||||||
| Retired from employment | 21% | 7% | 28% | 8% | 2% | 5% | 2% | 21% | 2% | 3% | 20% | 4% | 881 | ||||||||||||
| Looking after home or family | 31% | 2% | 26% | 14% | 7% | 1% | 3% | 13% | 2% | 3% | 18% | 4% | 233 | ||||||||||||
| Other | 22% | 7% | 16% | 8% | 8% | 3% | 5% | 16% | 2% | 3% | 23% | 5% | 588 | ||||||||||||
| Table 3: What fuels do you use in the open fire or open fire with back boiler? | |||||||||||
| % of weighted households | |||||||||||
| Wood logs | Coal/ smokeless coal | Peat | Other | Not relevant | Sample Households | ||||||
| Total | 18% | 18% | 12% | 1% | 73% | 4,641 | |||||
| Nature of occupancy | |||||||||||
| Owner-occupied | 18% | 18% | 12% | 1% | 73% | 4,013 | |||||
| Rented | 18% | 19% | 11% | 0% | 74% | 628 | |||||
| Number of occupants | |||||||||||
| 1 occupant | 14% | 15% | 11% | 1% | 78% | 755 | |||||
| 2 occupants | 17% | 18% | 9% | 0% | 75% | 1,376 | |||||
| 3 occupants | 19% | 21% | 13% | 1% | 71% | 901 | |||||
| 4 occupants | 19% | 18% | 13% | 1% | 73% | 975 | |||||
| 5 or more occupants | 24% | 22% | 15% | 0% | 67% | 634 | |||||
| Number of children | |||||||||||
| 1 person under 18 | 19% | 21% | 13% | 1% | 72% | 651 | |||||
| 2 persons under 18 | 20% | 19% | 14% | 0% | 71% | 706 | |||||
| 3 or more persons under 18 | 24% | 20% | 14% | 0% | 67% | 334 | |||||
| Dwelling type | |||||||||||
| Detached house | 20% | 19% | 14% | 1% | 70% | 1,854 | |||||
| Semi-detached house | 23% | 24% | 15% | 1% | 67% | 1,590 | |||||
| Terraced house | 16% | 18% | 10% | 0% | 74% | 713 | |||||
| Flat or apartment in a purpose-built block | 1% | 2% | 1% | 0% | 97% | 390 | |||||
| Other | 3% | 8% | 2% | 2% | 88% | 94 | |||||
| Construction date | |||||||||||
| Before 1961 | 19% | 17% | 12% | 1% | 72% | 891 | |||||
| 1961-1980 | 15% | 18% | 11% | 1% | 75% | 865 | |||||
| 1981-2000 | 19% | 20% | 13% | 0% | 71% | 1,257 | |||||
| 2001 or later | 19% | 19% | 12% | 1% | 73% | 1,280 | |||||
| Unknown construction period | 16% | 15% | 9% | 0% | 78% | 348 | |||||
| Region | |||||||||||
| Border | 24% | 34% | 13% | 1% | 61% | 257 | |||||
| Dublin | 13% | 10% | 9% | 0% | 83% | 1,725 | |||||
| Mid-East | 22% | 21% | 11% | 0% | 70% | 704 | |||||
| Mid-West | 16% | 15% | 9% | 0% | 79% | 372 | |||||
| Midland | 17% | 13% | 28% | 2% | 67% | 196 | |||||
| South-East | 20% | 26% | 9% | 1% | 67% | 357 | |||||
| South-West | 24% | 26% | 12% | 0% | 67% | 668 | |||||
| West | 15% | 13% | 17% | 1% | 73% | 362 | |||||
| Urban/Rural | |||||||||||
| Rural areas | 22% | 22% | 15% | 0% | 67% | 1,078 | |||||
| Urban areas | 16% | 18% | 11% | 1% | 75% | 2,984 | |||||
| Not known | 16% | 14% | 10% | 1% | 78% | 579 | |||||
| Age group of respondent | |||||||||||
| 18-34 years | 17% | 16% | 11% | 0% | 77% | 586 | |||||
| 35-44 years | 17% | 16% | 11% | 1% | 75% | 1,035 | |||||
| 45-54 years | 20% | 19% | 13% | 1% | 72% | 1,177 | |||||
| 55-64 years | 20% | 21% | 12% | 0% | 70% | 979 | |||||
| 65 years or over | 16% | 20% | 11% | 1% | 73% | 864 | |||||
| Sex of respondent | |||||||||||
| Male | 16% | 16% | 10% | 1% | 76% | 2,194 | |||||
| Female | 19% | 20% | 13% | 0% | 71% | 2,447 | |||||
| Working status of respondent | |||||||||||
| Working for payment or profit | 18% | 18% | 12% | 1% | 74% | 2,939 | |||||
| Retired from employment | 17% | 20% | 11% | 0% | 74% | 881 | |||||
| Looking after home or family | 22% | 17% | 13% | 1% | 68% | 233 | |||||
| Other | 19% | 20% | 12% | 1% | 73% | 588 | |||||
| Table 4: What fuels do you use in the stove or range, or stove or range with back boiler? | ||||||||||
| % of weighted households | ||||||||||
| Oil | Wood pellets/ wood chips | Wood logs | Coal/ smokeless coal | Peat | Natural gas | Liquid Petroleum Gas (LPG) | Other | Not relevant | Sample Households | |
| Total | 1% | 1% | 22% | 14% | 10% | 0% | 0% | 0% | 70% | 4,641 |
| Nature of occupancy | ||||||||||
| Owner-occupied | 2% | 2% | 27% | 16% | 13% | 0% | 0% | 0% | 63% | 4,013 |
| Rented | 0% | 1% | 9% | 7% | 5% | 0% | 0% | 0% | 87% | 628 |
| Number of occupants | ||||||||||
| 1 occupant | 1% | 1% | 13% | 10% | 8% | 0% | 0% | 0% | 79% | 755 |
| 2 occupants | 2% | 1% | 20% | 13% | 8% | 0% | 0% | 0% | 72% | 1,376 |
| 3 occupants | 1% | 2% | 22% | 14% | 11% | 0% | 0% | 0% | 68% | 901 |
| 4 occupants | 1% | 2% | 27% | 17% | 13% | 0% | 0% | 0% | 64% | 975 |
| 5 or more occupants | 2% | 1% | 28% | 15% | 13% | 0% | 0% | 0% | 63% | 634 |
| Number of children | ||||||||||
| 1 person under 18 | 1% | 2% | 21% | 16% | 9% | 0% | 0% | 0% | 69% | 651 |
| 2 persons under 18 | 1% | 2% | 25% | 17% | 11% | 0% | 0% | 0% | 66% | 706 |
| 3 or more persons under 18 | 1% | 2% | 31% | 15% | 16% | 1% | 0% | 1% | 59% | 334 |
| Dwelling type | ||||||||||
| Detached house | 3% | 2% | 36% | 21% | 17% | 0% | 0% | 1% | 51% | 1,854 |
| Semi-detached house | 0% | 1% | 17% | 12% | 8% | 0% | 0% | 0% | 77% | 1,590 |
| Terraced house | 0% | 2% | 13% | 10% | 6% | 0% | 0% | 0% | 80% | 713 |
| Flat or apartment in a purpose-built block | 0% | 0% | 1% | 0% | 1% | 0% | 0% | 0% | 99% | 390 |
| Other | 1% | 1% | 6% | 3% | 3% | 1% | 0% | 0% | 92% | 94 |
| Construction date | ||||||||||
| Before 1961 | 3% | 2% | 27% | 14% | 12% | 1% | 0% | 0% | 63% | 891 |
| 1961-1980 | 2% | 2% | 22% | 16% | 10% | 0% | 0% | 0% | 69% | 865 |
| 1981-2000 | 1% | 1% | 23% | 14% | 11% | 0% | 0% | 0% | 67% | 1,257 |
| 2001 or later | 1% | 2% | 23% | 15% | 11% | 0% | 0% | 0% | 69% | 1,280 |
| Unknown construction period | 1% | 0% | 5% | 5% | 5% | 0% | 0% | 1% | 88% | 348 |
| Region | ||||||||||
| Border | 2% | 2% | 26% | 21% | 9% | 0% | 0% | 0% | 64% | 257 |
| Dublin | 0% | 1% | 11% | 4% | 3% | 0% | 0% | 0% | 87% | 1,725 |
| Mid-East | 1% | 1% | 22% | 12% | 8% | 0% | 0% | 0% | 74% | 704 |
| Mid-West | 3% | 2% | 28% | 17% | 11% | 0% | 0% | 1% | 60% | 372 |
| Midland | 2% | 2% | 28% | 15% | 31% | 0% | 0% | 0% | 53% | 196 |
| South-East | 1% | 1% | 28% | 25% | 5% | 0% | 0% | 0% | 64% | 357 |
| South-West | 2% | 1% | 26% | 19% | 9% | 0% | 0% | 0% | 65% | 668 |
| West | 3% | 2% | 24% | 15% | 27% | 0% | 0% | 0% | 54% | 362 |
| Urban/Rural | ||||||||||
| Rural areas | 3% | 1% | 39% | 23% | 21% | 0% | 0% | 0% | 46% | 1,078 |
| Urban areas | 1% | 1% | 15% | 10% | 6% | 0% | 0% | 0% | 80% | 2,984 |
| Not known | 2% | 2% | 18% | 12% | 10% | 0% | 0% | 0% | 71% | 579 |
| Age group of respondent | ||||||||||
| 18-34 years | 1% | 1% | 13% | 8% | 7% | 0% | 0% | 0% | 82% | 586 |
| 35-44 years | 1% | 2% | 21% | 13% | 12% | 0% | 0% | 1% | 70% | 1,035 |
| 45-54 years | 1% | 1% | 23% | 15% | 11% | 0% | 0% | 0% | 69% | 1,177 |
| 55-64 years | 2% | 2% | 25% | 16% | 10% | 0% | 0% | 0% | 65% | 979 |
| 65 years or over | 3% | 0% | 24% | 15% | 11% | 0% | 0% | 0% | 65% | 864 |
| Sex of respondent | ||||||||||
| Male | 1% | 1% | 21% | 12% | 10% | 0% | 0% | 0% | 71% | 2,194 |
| Female | 1% | 2% | 22% | 15% | 11% | 0% | 0% | 1% | 69% | 2,447 |
| Working status of respondent | ||||||||||
| Working for payment or profit | 1% | 2% | 22% | 14% | 10% | 0% | 0% | 0% | 70% | 2,939 |
| Retired from employment | 3% | 1% | 24% | 16% | 10% | 0% | 0% | 0% | 65% | 881 |
| Looking after home or family | 2% | 3% | 30% | 13% | 13% | 0% | 0% | 0% | 62% | 233 |
| Other | 1% | 1% | 15% | 12% | 9% | 0% | 0% | 1% | 76% | 588 |
| Table 5: What fuel sources are used in the portable room heater or decorative effect fire? | |||||||||||||
| % of weighted households | |||||||||||||
| Electricity | Oil | Natural gas | Liquid Petroleum Gas (LPG) | Other | Not relevant | Sample Households | |||||||
| Total | 6% | 0% | 1% | 1% | 0% | 92% | 4,641 | ||||||
| Nature of occupancy | |||||||||||||
| Owner-occupied | 5% | 0% | 1% | 1% | 0% | 93% | 4,013 | ||||||
| Rented | 9% | 0% | 1% | 1% | 0% | 90% | 628 | ||||||
| Number of occupants | |||||||||||||
| 1 occupant | 7% | 0% | 1% | 1% | 0% | 91% | 755 | ||||||
| 2 occupants | 7% | 0% | 1% | 1% | 0% | 91% | 1,376 | ||||||
| 3 occupants | 6% | 0% | 1% | 1% | 0% | 93% | 901 | ||||||
| 4 occupants | 6% | 0% | 1% | 1% | 0% | 92% | 975 | ||||||
| 5 or more occupants | 5% | 0% | 1% | 0% | 0% | 94% | 634 | ||||||
| Number of children | |||||||||||||
| 1 person under 18 | 6% | 0% | 1% | 0% | 0% | 94% | 651 | ||||||
| 2 persons under 18 | 6% | 0% | 1% | 0% | 0% | 93% | 706 | ||||||
| 3 or more persons under 18 | 6% | 0% | 0% | 0% | 0% | 94% | 334 | ||||||
| Dwelling type | |||||||||||||
| Detached house | 4% | 0% | 1% | 1% | 0% | 94% | 1,854 | ||||||
| Semi-detached house | 7% | 0% | 1% | 1% | 0% | 92% | 1,590 | ||||||
| Terraced house | 5% | 0% | 1% | 1% | 0% | 92% | 713 | ||||||
| Flat or apartment in a purpose-built block | 14% | 0% | 2% | 0% | 0% | 85% | 390 | ||||||
| Other | 8% | 0% | 0% | 0% | 0% | 92% | 94 | ||||||
| Construction date | |||||||||||||
| Before 1961 | 6% | 0% | 1% | 0% | 0% | 93% | 891 | ||||||
| 1961-1980 | 9% | 0% | 1% | 1% | 0% | 89% | 865 | ||||||
| 1981-2000 | 6% | 0% | 1% | 1% | 0% | 93% | 1,257 | ||||||
| 2001 or later | 6% | 0% | 1% | 0% | 0% | 93% | 1,280 | ||||||
| Unknown construction period | 7% | 0% | 1% | 0% | 0% | 92% | 348 | ||||||
| Region | |||||||||||||
| Border | 8% | 0% | 0% | 2% | 0% | 92% | 257 | ||||||
| Dublin | 6% | 0% | 2% | 0% | 0% | 91% | 1,725 | ||||||
| Mid-East | 5% | 1% | 1% | 0% | 0% | 93% | 704 | ||||||
| Mid-West | 11% | 0% | 0% | 1% | 0% | 88% | 372 | ||||||
| Midland | 2% | 0% | 0% | 0% | 0% | 98% | 196 | ||||||
| South-East | 8% | 0% | 2% | 0% | 0% | 91% | 357 | ||||||
| South-West | 6% | 0% | 2% | 1% | 0% | 92% | 668 | ||||||
| West | 3% | 0% | 1% | 1% | 0% | 95% | 362 | ||||||
| Urban/Rural | |||||||||||||
| Rural areas | 4% | 0% | 0% | 0% | 0% | 95% | 1,078 | ||||||
| Urban areas | 7% | 0% | 2% | 1% | 0% | 91% | 2,984 | ||||||
| Not known | 9% | 0% | 1% | 0% | 0% | 89% | 579 | ||||||
| Age group of respondent | |||||||||||||
| 18-34 years | 8% | 0% | 1% | 0% | 0% | 91% | 586 | ||||||
| 35-44 years | 7% | 0% | 1% | 0% | 0% | 92% | 1,035 | ||||||
| 45-54 years | 6% | 1% | 2% | 1% | 0% | 92% | 1,177 | ||||||
| 55-64 years | 6% | 0% | 1% | 1% | 0% | 93% | 979 | ||||||
| 65 years or over | 5% | 0% | 2% | 1% | 0% | 93% | 864 | ||||||
| Sex of respondent | |||||||||||||
| Male | 6% | 0% | 1% | 1% | 0% | 93% | 2,194 | ||||||
| Female | 7% | 0% | 1% | 1% | 0% | 92% | 2,447 | ||||||
| Working status of respondent | |||||||||||||
| Working for payment or profit | 6% | 0% | 1% | 1% | 0% | 92% | 2,939 | ||||||
| Retired from employment | 5% | 0% | 2% | 1% | 0% | 93% | 881 | ||||||
| Looking after home or family | 5% | 0% | 0% | 2% | 0% | 92% | 233 | ||||||
| Other | 9% | 0% | 0% | 0% | 0% | 90% | 588 | ||||||
| Table 6: What is the main fuel used for cooking? | |||||||||||||||
| % of weighted households | |||||||||||||||
| Electricity | Natural gas | Liquid Petroleum Gas (LPG) | Combination of electricity and gas | Oil | Other | No response | Sample Households | ||||||||
| Total | 68% | 14% | 3% | 13% | 1% | 0% | 1% | 4,641 | |||||||
| Nature of occupancy | |||||||||||||||
| Owner-occupied | 63% | 16% | 3% | 15% | 1% | 0% | 1% | 4,013 | |||||||
| Rented | 81% | 9% | 1% | 7% | 0% | 0% | 1% | 628 | |||||||
| Number of occupants | |||||||||||||||
| 1 occupant | 74% | 13% | 2% | 9% | 1% | 1% | 1% | 755 | |||||||
| 2 occupants | 73% | 12% | 2% | 11% | 1% | 0% | 1% | 1,376 | |||||||
| 3 occupants | 65% | 15% | 3% | 15% | 1% | 1% | 1% | 901 | |||||||
| 4 occupants | 64% | 17% | 3% | 15% | 1% | 0% | 1% | 975 | |||||||
| 5 or more occupants | 64% | 15% | 3% | 17% | 1% | 0% | 1% | 634 | |||||||
| Number of children | |||||||||||||||
| 1 person under 18 | 66% | 14% | 2% | 16% | 1% | 0% | 1% | 651 | |||||||
| 2 persons under 18 | 65% | 17% | 2% | 14% | 1% | 0% | 0% | 706 | |||||||
| 3 or more persons under 18 | 64% | 16% | 3% | 16% | 0% | 0% | 1% | 334 | |||||||
| Dwelling type | |||||||||||||||
| Detached house | 65% | 11% | 4% | 17% | 2% | 0% | 0% | 1,854 | |||||||
| Semi-detached house | 68% | 18% | 2% | 11% | 0% | 0% | 1% | 1,590 | |||||||
| Terraced house | 64% | 23% | 1% | 12% | 0% | 0% | 0% | 713 | |||||||
| Flat or apartment in a purpose-built block | 87% | 5% | 0% | 5% | 0% | 0% | 2% | 390 | |||||||
| Other | 82% | 8% | 0% | 4% | 5% | 0% | 1% | 94 | |||||||
| Construction date | |||||||||||||||
| Before 1961 | 60% | 20% | 2% | 14% | 2% | 0% | 1% | 891 | |||||||
| 1961-1980 | 68% | 16% | 3% | 11% | 1% | 1% | 1% | 865 | |||||||
| 1981-2000 | 71% | 12% | 3% | 12% | 0% | 0% | 1% | 1,257 | |||||||
| 2001 or later | 69% | 12% | 2% | 15% | 1% | 0% | 1% | 1,280 | |||||||
| Unknown construction period | 76% | 11% | 2% | 9% | 1% | 0% | 1% | 348 | |||||||
| Region | |||||||||||||||
| Border | 72% | 7% | 3% | 15% | 2% | 0% | 1% | 257 | |||||||
| Dublin | 66% | 22% | 1% | 11% | 0% | 0% | 1% | 1,725 | |||||||
| Mid-East | 66% | 15% | 3% | 13% | 1% | 1% | 1% | 704 | |||||||
| Mid-West | 72% | 8% | 4% | 14% | 2% | 0% | 1% | 372 | |||||||
| Midland | 68% | 9% | 4% | 16% | 2% | 1% | 1% | 196 | |||||||
| South-East | 73% | 8% | 3% | 13% | 2% | 0% | 1% | 357 | |||||||
| South-West | 68% | 16% | 2% | 12% | 1% | 0% | 1% | 668 | |||||||
| West | 70% | 8% | 4% | 14% | 1% | 1% | 1% | 362 | |||||||
| Urban/Rural | |||||||||||||||
| Rural areas | 64% | 7% | 5% | 19% | 2% | 1% | 1% | 1,078 | |||||||
| Urban areas | 68% | 18% | 2% | 11% | 0% | 0% | 1% | 2,984 | |||||||
| Not known | 76% | 10% | 2% | 11% | 1% | 0% | 0% | 579 | |||||||
| Age group of respondent | |||||||||||||||
| 18-34 years | 75% | 12% | 1% | 10% | 1% | 0% | 2% | 586 | |||||||
| 35-44 years | 72% | 14% | 1% | 12% | 0% | 0% | 0% | 1,035 | |||||||
| 45-54 years | 65% | 16% | 4% | 14% | 1% | 0% | 1% | 1,177 | |||||||
| 55-64 years | 65% | 14% | 4% | 15% | 2% | 1% | 1% | 979 | |||||||
| 65 years or over | 68% | 13% | 3% | 12% | 2% | 1% | 1% | 864 | |||||||
| Sex of respondent | |||||||||||||||
| Male | 69% | 15% | 3% | 11% | 1% | 0% | 1% | 2,194 | |||||||
| Female | 68% | 13% | 2% | 14% | 1% | 0% | 1% | 2,447 | |||||||
| Working status of respondent | |||||||||||||||
| Working for payment or profit | 68% | 15% | 2% | 13% | 1% | 0% | 1% | 2,939 | |||||||
| Retired from employment | 70% | 12% | 3% | 12% | 2% | 1% | 1% | 881 | |||||||
| Looking after home or family | 66% | 13% | 1% | 16% | 3% | 0% | 1% | 233 | |||||||
| Other | 70% | 14% | 4% | 11% | 0% | 0% | 1% | 588 | |||||||
| Table 7: Do you have any of the following installed in your home? | |||||||
| % of weighted households | |||||||
| Heat pump | Photovoltaic (PV) solar panel | Thermal solar panel | Smart heating controls | None of the above | No response | Sample Households | |
| Total | 8% | 3% | 5% | 16% | 66% | 6% | 4,641 |
| Nature of occupancy | |||||||
| Owner-occupied | 10% | 4% | 6% | 19% | 63% | 4% | 4,013 |
| Rented | 6% | 1% | 1% | 9% | 74% | 10% | 628 |
| Number of occupants | |||||||
| 1 occupant | 5% | 1% | 3% | 11% | 74% | 7% | 755 |
| 2 occupants | 8% | 3% | 4% | 14% | 69% | 6% | 1,376 |
| 3 occupants | 8% | 3% | 4% | 16% | 67% | 6% | 901 |
| 4 occupants | 10% | 3% | 6% | 20% | 62% | 5% | 975 |
| 5 or more occupants | 11% | 5% | 9% | 21% | 57% | 6% | 634 |
| Number of children | |||||||
| 1 person under 18 | 9% | 4% | 5% | 18% | 66% | 5% | 651 |
| 2 persons under 18 | 11% | 3% | 4% | 22% | 61% | 5% | 706 |
| 3 or more persons under 18 | 13% | 6% | 8% | 26% | 51% | 7% | 334 |
| Dwelling type | |||||||
| Detached house | 10% | 5% | 9% | 16% | 63% | 5% | 1,854 |
| Semi-detached house | 7% | 2% | 3% | 21% | 65% | 5% | 1,590 |
| Terraced house | 6% | 2% | 1% | 16% | 72% | 5% | 713 |
| Flat or apartment in a purpose-built block | 8% | 0% | 0% | 8% | 76% | 9% | 390 |
| Other | 6% | 1% | 1% | 8% | 66% | 20% | 94 |
| Construction date | |||||||
| Before 1961 | 7% | 3% | 5% | 16% | 70% | 3% | 891 |
| 1961-1980 | 6% | 3% | 4% | 19% | 69% | 4% | 865 |
| 1981-2000 | 7% | 3% | 5% | 16% | 67% | 5% | 1,257 |
| 2001 or later | 13% | 4% | 6% | 19% | 60% | 6% | 1,280 |
| Unknown construction period | 4% | 0% | 1% | 6% | 73% | 17% | 348 |
| Region | |||||||
| Border | 11% | 3% | 6% | 8% | 67% | 9% | 257 |
| Dublin | 7% | 2% | 2% | 19% | 68% | 5% | 1,725 |
| Mid-East | 10% | 4% | 5% | 22% | 59% | 7% | 704 |
| Mid-West | 9% | 3% | 4% | 15% | 71% | 4% | 372 |
| Midland | 12% | 2% | 6% | 13% | 65% | 7% | 196 |
| South-East | 9% | 3% | 6% | 11% | 72% | 5% | 357 |
| South-West | 8% | 2% | 7% | 20% | 63% | 6% | 668 |
| West | 7% | 4% | 7% | 11% | 68% | 7% | 362 |
| Urban/Rural | |||||||
| Rural areas | 13% | 5% | 10% | 13% | 62% | 5% | 1,078 |
| Urban areas | 6% | 2% | 3% | 18% | 69% | 6% | 2,984 |
| Not known | 12% | 2% | 4% | 16% | 64% | 7% | 579 |
| Age group of respondent | |||||||
| 18-34 years | 6% | 1% | 2% | 11% | 69% | 12% | 586 |
| 35-44 years | 10% | 3% | 4% | 20% | 63% | 6% | 1,035 |
| 45-54 years | 8% | 4% | 6% | 19% | 65% | 5% | 1,177 |
| 55-64 years | 9% | 3% | 6% | 16% | 67% | 4% | 979 |
| 65 years or over | 8% | 3% | 5% | 13% | 70% | 5% | 864 |
| Sex of respondent | |||||||
| Male | 7% | 3% | 5% | 19% | 67% | 4% | 2,194 |
| Female | 10% | 2% | 5% | 14% | 66% | 7% | 2,447 |
| Working status of respondent | |||||||
| Working for payment or profit | 8% | 3% | 5% | 18% | 65% | 6% | 2,939 |
| Retired from employment | 8% | 3% | 6% | 13% | 69% | 5% | 881 |
| Looking after home or family | 9% | 3% | 7% | 18% | 61% | 10% | 233 |
| Other | 9% | 2% | 4% | 11% | 71% | 7% | 588 |
| Table 8A: Is there an electric vehicle in the household? | ||||
| % of weighted households | ||||
| Yes | No | No response | Sample Households | |
| Total | 4% | 95% | 0% | 4,641 |
| Nature of occupancy | ||||
| Owner-occupied | 5% | 95% | 0% | 4,013 |
| Rented | 3% | 97% | 0% | 628 |
| Number of occupants | ||||
| 1 occupant | 3% | 97% | 0% | 755 |
| 2 occupants | 4% | 96% | 0% | 1,376 |
| 3 occupants | 4% | 96% | 0% | 901 |
| 4 occupants | 7% | 93% | 0% | 975 |
| 5 or more occupants | 6% | 94% | 0% | 634 |
| Number of children | ||||
| 1 person under 18 | 6% | 94% | 0% | 651 |
| 2 persons under 18 | 6% | 94% | 0% | 706 |
| 3 or more persons under 18 | 5% | 95% | 0% | 334 |
| Dwelling type | ||||
| Detached house | 5% | 95% | 0% | 1,854 |
| Semi-detached house | 5% | 95% | 0% | 1,590 |
| Terraced house | 3% | 97% | 0% | 713 |
| Flat or apartment in a purpose-built block | 3% | 97% | 0% | 390 |
| Other | 4% | 96% | 0% | 94 |
| Construction date | ||||
| Before 1961 | 5% | 94% | 1% | 891 |
| 1961-1980 | 4% | 96% | 0% | 865 |
| 1981-2000 | 5% | 94% | 0% | 1,257 |
| 2001 or later | 4% | 96% | 0% | 1,280 |
| Unknown construction period | 2% | 98% | 0% | 348 |
| Region | ||||
| Border | 2% | 98% | 0% | 257 |
| Dublin | 6% | 94% | 0% | 1,725 |
| Mid-East | 6% | 94% | 0% | 704 |
| Mid-West | 5% | 95% | 0% | 372 |
| Midland | 3% | 97% | 0% | 196 |
| South-East | 3% | 96% | 1% | 357 |
| South-West | 5% | 95% | 0% | 668 |
| West | 3% | 97% | 0% | 362 |
| Urban/Rural | ||||
| Rural areas | 3% | 97% | 0% | 1,078 |
| Urban areas | 5% | 95% | 0% | 2,984 |
| Not known | 4% | 96% | 0% | 579 |
| Age group of respondent | ||||
| 18-34 years | 3% | 97% | 0% | 586 |
| 35-44 years | 4% | 96% | 0% | 1,035 |
| 45-54 years | 5% | 95% | 0% | 1,177 |
| 55-64 years | 5% | 95% | 0% | 979 |
| 65 years or over | 5% | 95% | 0% | 864 |
| Sex of respondent | ||||
| Male | 5% | 95% | 0% | 2,194 |
| Female | 4% | 96% | 0% | 2,447 |
| Working status of respondent | ||||
| Working for payment or profit | 5% | 95% | 0% | 2,939 |
| Retired from employment | 5% | 94% | 0% | 881 |
| Looking after home or family | 6% | 94% | 0% | 233 |
| Other | 2% | 97% | 1% | 588 |
| Table 8B: Where do you charge the electric vehicle most often? | ||||||
| % of weighted households | ||||||
| At home | Public charge point | Work charge point | Other | No response | Sample Households | |
| Total | 3% | 0% | 0% | 0% | 96% | 4,641 |
| Nature of occupancy | ||||||
| Owner-occupied | 4% | 0% | 0% | 1% | 95% | 4,013 |
| Rented | 1% | 1% | 0% | 0% | 97% | 628 |
| Number of occupants | ||||||
| 1 occupant | 2% | 0% | 0% | 0% | 97% | 755 |
| 2 occupants | 3% | 0% | 0% | 0% | 97% | 1,376 |
| 3 occupants | 3% | 0% | 0% | 1% | 96% | 901 |
| 4 occupants | 4% | 1% | 1% | 0% | 93% | 975 |
| 5 or more occupants | 5% | 0% | 0% | 0% | 94% | 634 |
| Number of children | ||||||
| 1 person under 18 | 4% | 1% | 0% | 0% | 94% | 651 |
| 2 persons under 18 | 4% | 0% | 1% | 1% | 94% | 706 |
| 3 or more persons under 18 | 4% | 0% | 1% | 0% | 95% | 334 |
| Dwelling type | ||||||
| Detached house | 4% | 1% | 0% | 0% | 95% | 1,854 |
| Semi-detached house | 4% | 0% | 0% | 1% | 95% | 1,590 |
| Terraced house | 1% | 0% | 1% | 0% | 97% | 713 |
| Flat or apartment in a purpose-built block | 1% | 1% | 0% | 0% | 97% | 390 |
| Other | 4% | 0% | 0% | 0% | 96% | 94 |
| Construction date | ||||||
| Before 1961 | 4% | 1% | 0% | 0% | 95% | 891 |
| 1961-1980 | 3% | 0% | 0% | 0% | 96% | 865 |
| 1981-2000 | 4% | 0% | 0% | 1% | 95% | 1,257 |
| 2001 or later | 3% | 1% | 0% | 0% | 96% | 1,280 |
| Unknown construction period | 2% | 0% | 0% | 0% | 98% | 348 |
| Region | ||||||
| Border | 2% | 0% | 0% | 0% | 98% | 257 |
| Dublin | 3% | 1% | 1% | 1% | 94% | 1,725 |
| Mid-East | 5% | 0% | 0% | 0% | 94% | 704 |
| Mid-West | 2% | 2% | 0% | 0% | 95% | 372 |
| Midland | 2% | 0% | 0% | 1% | 97% | 196 |
| South-East | 2% | 0% | 0% | 0% | 97% | 357 |
| South-West | 4% | 0% | 0% | 0% | 95% | 668 |
| West | 2% | 0% | 0% | 0% | 97% | 362 |
| Urban/Rural | ||||||
| Rural areas | 3% | 0% | 0% | 0% | 97% | 1,078 |
| Urban areas | 3% | 1% | 0% | 1% | 95% | 2,984 |
| Not known | 3% | 0% | 1% | 0% | 96% | 579 |
| Age group of respondent | ||||||
| 18-34 years | 1% | 2% | 0% | 0% | 97% | 586 |
| 35-44 years | 2% | 0% | 1% | 0% | 96% | 1,035 |
| 45-54 years | 4% | 0% | 0% | 0% | 95% | 1,177 |
| 55-64 years | 4% | 1% | 0% | 0% | 95% | 979 |
| 65 years or over | 4% | 0% | 0% | 1% | 95% | 864 |
| Sex of respondent | ||||||
| Male | 4% | 0% | 0% | 0% | 95% | 2,194 |
| Female | 2% | 1% | 0% | 1% | 96% | 2,447 |
| Working status of respondent | ||||||
| Working for payment or profit | 3% | 1% | 0% | 0% | 96% | 2,939 |
| Retired from employment | 4% | 0% | 0% | 1% | 95% | 881 |
| Looking after home or family | 4% | 1% | 0% | 1% | 94% | 233 |
| Other | 1% | 0% | 1% | 1% | 98% | 588 |
| Table 8C: When you charge the electric vehicle at home, what rate do you mostly use? | ||||||
| % of weighted households | ||||||
| Night-rate electricity | Day-rate electricity | Standard rate | Other | Not relevant | Sample Households | |
| Total | 1% | 0% | 2% | 0% | 97% | 4,641 |
| Nature of occupancy | ||||||
| Owner-occupied | 2% | 0% | 2% | 0% | 96% | 4,013 |
| Rented | 1% | 0% | 1% | 0% | 99% | 628 |
| Number of occupants | ||||||
| 1 occupant | 1% | 0% | 1% | 0% | 98% | 755 |
| 2 occupants | 1% | 0% | 1% | 0% | 97% | 1,376 |
| 3 occupants | 2% | 0% | 1% | 0% | 97% | 901 |
| 4 occupants | 2% | 0% | 2% | 0% | 96% | 975 |
| 5 or more occupants | 2% | 1% | 2% | 0% | 95% | 634 |
| Number of children | ||||||
| 1 person under 18 | 2% | 0% | 2% | 0% | 96% | 651 |
| 2 persons under 18 | 2% | 0% | 2% | 0% | 96% | 706 |
| 3 or more persons under 18 | 2% | 0% | 2% | 0% | 96% | 334 |
| Dwelling type | ||||||
| Detached house | 2% | 0% | 2% | 0% | 96% | 1,854 |
| Semi-detached house | 1% | 0% | 2% | 0% | 96% | 1,590 |
| Terraced house | 0% | 0% | 1% | 0% | 99% | 713 |
| Flat or apartment in a purpose-built block | 1% | 0% | 0% | 0% | 99% | 390 |
| Other | 2% | 0% | 2% | 0% | 96% | 94 |
| Construction date | ||||||
| Before 1961 | 2% | 0% | 2% | 0% | 96% | 891 |
| 1961-1980 | 1% | 0% | 2% | 0% | 97% | 865 |
| 1981-2000 | 2% | 0% | 2% | 0% | 96% | 1,257 |
| 2001 or later | 1% | 0% | 1% | 0% | 97% | 1,280 |
| Unknown construction period | 0% | 0% | 1% | 0% | 98% | 348 |
| Region | ||||||
| Border | 1% | 0% | 1% | 0% | 98% | 257 |
| Dublin | 1% | 0% | 2% | 0% | 97% | 1,725 |
| Mid-East | 2% | 0% | 2% | 0% | 95% | 704 |
| Mid-West | 1% | 0% | 2% | 0% | 98% | 372 |
| Midland | 1% | 0% | 0% | 0% | 98% | 196 |
| South-East | 1% | 0% | 2% | 0% | 98% | 357 |
| South-West | 1% | 0% | 3% | 0% | 96% | 668 |
| West | 1% | 0% | 2% | 0% | 98% | 362 |
| Urban/Rural | ||||||
| Rural areas | 1% | 0% | 1% | 0% | 97% | 1,078 |
| Urban areas | 1% | 0% | 2% | 0% | 97% | 2,984 |
| Not known | 1% | 0% | 2% | 0% | 97% | 579 |
| Age group of respondent | ||||||
| 18-34 years | 0% | 0% | 1% | 0% | 99% | 586 |
| 35-44 years | 1% | 0% | 1% | 0% | 98% | 1,035 |
| 45-54 years | 2% | 0% | 2% | 0% | 96% | 1,177 |
| 55-64 years | 2% | 0% | 2% | 0% | 96% | 979 |
| 65 years or over | 2% | 0% | 2% | 0% | 96% | 864 |
| Sex of respondent | ||||||
| Male | 2% | 0% | 2% | 0% | 96% | 2,194 |
| Female | 1% | 0% | 2% | 0% | 98% | 2,447 |
| Working status of respondent | ||||||
| Working for payment or profit | 1% | 0% | 2% | 0% | 97% | 2,939 |
| Retired from employment | 2% | 0% | 2% | 0% | 96% | 881 |
| Looking after home or family | 1% | 0% | 3% | 0% | 96% | 233 |
| Other | 1% | 0% | 0% | 0% | 99% | 588 |
| Table 8D: Is your household likely to purchase an electric vehicle when next changing car? | ||||||
| % of weighted households | ||||||
| Yes | No | Don't know | Not relevant | No response | Sample Households | |
| Total | 24% | 32% | 38% | 6% | 0% | 4,641 |
| Nature of occupancy | ||||||
| Owner-occupied | 27% | 32% | 38% | 3% | 0% | 4,013 |
| Rented | 18% | 31% | 38% | 13% | 0% | 628 |
| Number of occupants | ||||||
| 1 occupant | 16% | 34% | 35% | 15% | 0% | 755 |
| 2 occupants | 23% | 31% | 39% | 7% | 0% | 1,376 |
| 3 occupants | 26% | 34% | 36% | 4% | 0% | 901 |
| 4 occupants | 29% | 30% | 38% | 2% | 0% | 975 |
| 5 or more occupants | 28% | 31% | 39% | 2% | 0% | 634 |
| Number of children | ||||||
| 1 person under 18 | 28% | 33% | 36% | 4% | 0% | 651 |
| 2 persons under 18 | 32% | 29% | 38% | 1% | 0% | 706 |
| 3 or more persons under 18 | 32% | 32% | 35% | 1% | 0% | 334 |
| Dwelling type | ||||||
| Detached house | 25% | 34% | 38% | 3% | 0% | 1,854 |
| Semi-detached house | 26% | 32% | 37% | 4% | 0% | 1,590 |
| Terraced house | 20% | 33% | 38% | 9% | 0% | 713 |
| Flat or apartment in a purpose-built block | 23% | 23% | 38% | 16% | 0% | 390 |
| Other | 17% | 34% | 33% | 16% | 0% | 94 |
| Construction date | ||||||
| Before 1961 | 29% | 29% | 33% | 9% | 0% | 891 |
| 1961-1980 | 21% | 34% | 40% | 5% | 0% | 865 |
| 1981-2000 | 27% | 33% | 37% | 4% | 0% | 1,257 |
| 2001 or later | 24% | 32% | 39% | 5% | 0% | 1,280 |
| Unknown construction period | 15% | 32% | 40% | 13% | 0% | 348 |
| Region | ||||||
| Border | 18% | 41% | 35% | 6% | 0% | 257 |
| Dublin | 30% | 24% | 36% | 10% | 0% | 1,725 |
| Mid-East | 29% | 30% | 36% | 5% | 0% | 704 |
| Mid-West | 20% | 33% | 43% | 4% | 0% | 372 |
| Midland | 20% | 39% | 38% | 3% | 0% | 196 |
| South-East | 22% | 36% | 38% | 4% | 0% | 357 |
| South-West | 20% | 36% | 39% | 5% | 0% | 668 |
| West | 19% | 35% | 41% | 5% | 0% | 362 |
| Urban/Rural | ||||||
| Rural areas | 20% | 41% | 36% | 3% | 0% | 1,078 |
| Urban areas | 26% | 28% | 39% | 8% | 0% | 2,984 |
| Not known | 25% | 31% | 38% | 6% | 0% | 579 |
| Age group of respondent | ||||||
| 18-34 years | 22% | 32% | 36% | 10% | 0% | 586 |
| 35-44 years | 26% | 31% | 39% | 5% | 0% | 1,035 |
| 45-54 years | 26% | 29% | 40% | 5% | 0% | 1,177 |
| 55-64 years | 24% | 33% | 38% | 5% | 0% | 979 |
| 65 years or over | 21% | 38% | 34% | 7% | 0% | 864 |
| Sex of respondent | ||||||
| Male | 25% | 34% | 35% | 6% | 0% | 2,194 |
| Female | 23% | 30% | 40% | 6% | 0% | 2,447 |
| Working status of respondent | ||||||
| Working for payment or profit | 27% | 31% | 37% | 5% | 0% | 2,939 |
| Retired from employment | 22% | 36% | 35% | 7% | 0% | 881 |
| Looking after home or family | 20% | 31% | 46% | 3% | 0% | 233 |
| Other | 17% | 32% | 40% | 12% | 0% | 588 |
| Table 9: Would you consider making substantial changes to your electricity consumption pattern if cheaper rates were available in off-peak times? | ||||
| % of weighted households | ||||
| Yes | No | No response | Sample Households | |
| Total | 74% | 16% | 10% | 4,641 |
| Nature of occupancy | ||||
| Owner-occupied | 75% | 16% | 9% | 4,013 |
| Rented | 73% | 14% | 13% | 628 |
| Number of occupants | ||||
| 1 occupant | 71% | 17% | 12% | 755 |
| 2 occupants | 71% | 18% | 11% | 1,376 |
| 3 occupants | 74% | 16% | 10% | 901 |
| 4 occupants | 80% | 12% | 9% | 975 |
| 5 or more occupants | 80% | 12% | 8% | 634 |
| Number of children | ||||
| 1 person under 18 | 77% | 14% | 9% | 651 |
| 2 persons under 18 | 80% | 12% | 8% | 706 |
| 3 or more persons under 18 | 82% | 10% | 8% | 334 |
| Dwelling type | ||||
| Detached house | 76% | 15% | 9% | 1,854 |
| Semi-detached house | 75% | 15% | 10% | 1,590 |
| Terraced house | 74% | 16% | 10% | 713 |
| Flat or apartment in a purpose-built block | 72% | 15% | 12% | 390 |
| Other | 59% | 26% | 15% | 94 |
| Construction date | ||||
| Before 1961 | 72% | 18% | 10% | 891 |
| 1961-1980 | 75% | 15% | 10% | 865 |
| 1981-2000 | 73% | 17% | 10% | 1,257 |
| 2001 or later | 79% | 14% | 8% | 1,280 |
| Unknown construction period | 70% | 13% | 16% | 348 |
| Region | ||||
| Border | 71% | 16% | 14% | 257 |
| Dublin | 72% | 18% | 11% | 1,725 |
| Mid-East | 77% | 14% | 9% | 704 |
| Mid-West | 81% | 13% | 7% | 372 |
| Midland | 75% | 15% | 10% | 196 |
| South-East | 75% | 16% | 9% | 357 |
| South-West | 75% | 17% | 8% | 668 |
| West | 75% | 12% | 13% | 362 |
| Urban/Rural | ||||
| Rural areas | 77% | 15% | 9% | 1,078 |
| Urban areas | 74% | 16% | 11% | 2,984 |
| Not known | 75% | 16% | 9% | 579 |
| Age group of respondent | ||||
| 18-34 years | 72% | 15% | 13% | 586 |
| 35-44 years | 77% | 14% | 9% | 1,035 |
| 45-54 years | 76% | 15% | 9% | 1,177 |
| 55-64 years | 78% | 13% | 8% | 979 |
| 65 years or over | 67% | 22% | 11% | 864 |
| Sex of respondent | ||||
| Male | 71% | 20% | 9% | 2,194 |
| Female | 78% | 12% | 11% | 2,447 |
| Working status of respondent | ||||
| Working for payment or profit | 75% | 15% | 10% | 2,939 |
| Retired from employment | 69% | 21% | 11% | 881 |
| Looking after home or family | 75% | 12% | 13% | 233 |
| Other | 80% | 12% | 9% | 588 |
The data were collected as part of the CSO General Household Survey (GHS). The GHS is a national survey that takes place three or four times each year and is part of an EU-wide programme. Each survey usually has a specific theme: for example in Quarter 3, 2021 the modules were "Personal and Work-Life Balance" and "Environment". The purpose of the Environment module was to collect information on household environmental behaviours.
The survey was planned for Quarter 3, 2021. A slight delay arose; therefore data were collected during the three months from August to October 2021.
A copy of the questionnaire is available at: Household Environmental Behaviours
The questionnaire consisted of a short series of questions on household socio-demographic characteristics and on four topics relating to the environment: opinions on environmental issues; visits to nature areas; waste management and recycling; and energy use. The CSO formed a project group consisting of representatives from the Environmental Protection Agency, the Sustainable Energy Authority of Ireland, the CSO Environment and Climate Division and the CSO Ecosystem Accounts Division to develop the questionnaire so that it would meet statistical and policy needs.
In Quarter 2 of 2014 the CSO collected data on household environment behaviours as part of the Quarterly National Household Survey (QNHS). The QNHS Environment module questionnaire contained questions on household waste and recycling and on energy use by households. A number of questions from the 2014 survey were repeated in this questionnaire. In addition, new questions on waste and recycling and on energy use were incorporated into the questionnaire, while two new sections, Household Environmental Concerns and Household Visits to Nature Areas, were also added.
The GHS Environment module was an online survey of households. Households that were selected in the sample received a letter in the post providing a link to the survey and a QR code along with an access code.
The sample was selected from the Household Sampling Frame, also known as the Ordinarily Resident Frame (ORF). The ORF dataset is produced by combining Local Property Tax (LPT) owner-occupied property data with Residential Tenancies Board (RTB) tenant-occupied property data.
The sample was selected using a Stratified Simple Random Sample, stratified by county and type of occupancy. Type of occupancy consisted of three groups: LPT owner-occupied properties, LPT local authority rental properties, and RTB private rental properties. A sample of 25,000 was selected.
In advance of finalising the sample, a data matching exercise was undertaken to enhance the Eircode coverage in the ORF. This was done in order to aid delivery of letters to correct households, thus potentially increasing response rates and enabling an improved match to Census of Population data to acquire household composition variables.
The data matching exercise was carried out on 30,000 households. Addresses were matched to the GeoDirectory, Census of Population and the Local Property Tax datasets. Eircode coverage was enhanced to 23,435 cases. The remaining 1,565 sample was randomly selected from 6,565 unmatched Eircode records, bringing the total sample to 25,000.
In order to account for unoccupied properties, households were weighted by county and type of tenure to the population totals recorded in the 2016 Census of Population. The total number of households was 1.7 million households. The population of households was defined as occupied private households on Census night 2016.
The module results are based on responses from 4,641 households. These households were weighted by county and type of occupancy (owner-occupied and rented) to represent all occupied households in the State. The data were matched to the Census of Population dataset in order to add certain Census variables such as whether the household is in an urban or a rural area.
Sample
A stratified random sample was selected from the Ordinarily Resident Frame. The original sample size was 30,000 in order to enhance Eircode coverage and hence matching to Census of Population data. All records with Eircode coverage were then selected to be part of the final sample of 25,000. As a result the final sample was not perfectly random; however the benefits in terms of improving receipt of letters by the correct households and hence response rates were considered to justify the approach.
Coverage
The ORF is updated annually with LPT data and quarterly with RTB data. The most recent update at the time of the Environment module was Quarter 4, 2020. The LPT data source identifies properties which are principal private residences of tax-resident persons. It is also possible to identify Local Authority (L.A.)-owned rental properties from the LPT. All privately-owned and Approved Housing Board-owned and rental properties are required to be registered with the RTB. Combining the LPT (taking the owner-occupied properties of tax-resident persons, plus the L.A. rental properties) and the RTB (for private rental properties and AHB rental properties) is considered to make a satisfactory household survey sampling frame.
Measurement
The questionnaire repeated a number of questions which had been included in the QHNS Environment module of Quarter 2 of 2014. The majority of the remaining questions were derived from Eurobarometer questionnaires and from the People and Nature Survey (PANS) questionnaire used in England to gather data on people’s enjoyment, access, understanding of and attitudes to the natural environment.
All questions were assessed for suitability in an Irish context and for an online survey which was to be completed on a device such as a laptop, smartphone or tablet. Each section of the questionnaire was discussed and reviewed by the relevant members of the project group.
Response
The usable response rate for the survey was 18.6%. Three reminders were issued to households in order to increase the response rate. The time taken to fill the questionnaire was kept to approximately ten minutes in order to reduce non-response.
Each table in this release contains figures showing the number of respondent households. The number of households in the population, based on the 2016 Census, was 1,666,266.
While most respondents provided responses to all questions in the questionnaire, some respondents did not answer all questions. The release tables include proportions of non-respondents to specific questions where relevant.
From respondent households who were requested to participate in the module, one person volunteered to respond on behalf of the entire household. Due to the voluntary nature of the household respondent, individual characteristics may not be representative of the population as a whole when compared to a sample survey with a random selection of a respondent.
The row percentages in the tables in this report may not add to 100% due to rounding. Cells containing zero percent include cases where the percentage of respondents in that category was less than 0.5% as well as cases where there was no respondent in that category.
The Environment module questionnaire included a section on sociodemographic characteristics of the household and the individual respondent. In addition information on type of occupancy was available from the ORF. Finally, a Census variable classifying households by whether they are located in rural or urban areas was added to the dataset. This variable was missing for a significant proportion of households due to the incomplete match between the ORF and the Census. The classification variables are outlined below.
Type of Tenure
This classification was available from the ORF. Households were classified as Owner-occupied or Rented.
Number of Occupants
Respondents were asked: Including you, how many people live in this household?
Number of Children
Respondents were asked: How many children under 18 live in this household?
Dwelling Type
Respondents were asked: What type of accommodation does your household live in? The type of dwelling the respondents lived in were categorised as follows:
Construction Date
Respondents were asked: When was your house, flat or apartment built? The responses were classified to the following categories:
NUTS 3 Regions
The regional classification used in this release is based on the NUTS (Nomenclature of Territorial Units) classification used by Eurostat. The composition of the regions is set out below.
Urban/Rural Location
Areas are classified as Urban or Rural based on Census of Population 2016. Urban refers to settlements with a total population of 1,500 or more. Rural refers to the population outside urban areas and includes towns with a population of less than 1,500 persons.
Age
Respondents were asked: What is your age? Responses were categorised as:
Sex
Respondents were asked: What is your sex? Responses were categorised as Female or Male.
Household Working Status
Respondents were asked: Which of the following categories best describes your current situation? Responses were categorised as:
Please contact environment@cso.ie with any queries or requests for further analysis.
The Central Statistics Office wishes to thank the respondent households for their participation in the survey.
 Hide Background Notes
Scan the QR code below to view this release online or go to
http://www.cso.ie/en/releasesandpublications/er/hebeu/householdenvironmentalbehaviours-energyusequarter32021/
 Show Table 1: What is the main fuel or energy source used to heat your home?
 Hide Table 1: What is the main fuel or energy source used to heat your home?