
This release was compiled during the COVID-19 crisis. The results contained in this release reflect some of the economic impacts of the COVID-19 situation. For further information see Information Note - Implications of COVID-19 on the Gross Value Added for Foreign-owned Multinational Enterprises and Other Sectors Quarter 2 2020
| GVA at constant (2018) basic prices for sectors dominated by Foreign-owned MNEs and Other Sectors - seasonally adjusted1 | ||
| Q2 2020 | ||
| Amount €m | Quarterly % change | |
| Foreign-owned MNE dominated | 40,525 | 1.1 |
| Other | 36,770 | -19.8 |
| Total GVA (MNE dominated + Other) | 77,295 | -10.1 |
| 1 Seasonally Adjusted data are non-additive, see Background Notes for further details | ||
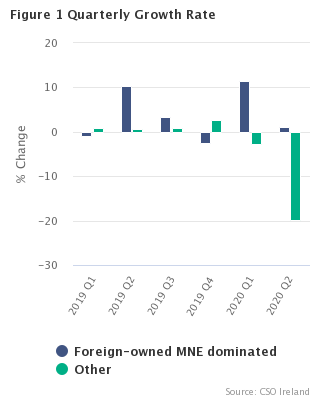
On a seasonally adjusted basis, initial estimates indicate that Gross Value Added (GVA) in volume terms for the non-MNE dominated sectors of the economy decreased by 19.8% for the second quarter of 2020. GVA in the Foreign-owned MNE dominated sector increased by 1.1% over the same period.
Real GVA for the total economy was €77 billion in the Q2 2020 reference period, a decline of 10.1% on the previous period, with GVA for MNE dominated sectors representing approximately 52.4% of Total GVA while GVA for the non-MNE dominated sectors represented approximately 47.6% of the total.
The share of total GVA at constant prices accounted for by the foreign-owned MNE dominated sectors stood at 43.4% in 2019, an increase from 42.8% in 2018.
|
The calculation methods for quarterly Gross Value Added (GVA) for Foreign-owned Multinational Enterprises and Other sectors are similar to those used in the CSO’s annual GVA for Foreign-owned Multinational Enterprises and Other Sectors release, also published today (08 October 2020). As some of the sources available quarterly are of lesser reliability than those used for the annual accounts, the quarterly estimates are subject to a greater margin of error than the equivalent annual figures. These preliminary quarterly estimates will therefore be revised when the next detailed annual results are published. Data for the reference quarters contained in the tables of this release as well as data for earlier reference quarters can be downloaded from the StatBank database service on the CSO Website. For annual data for years 1995-2019 at the more detailed 37 sectoral breakdown level, please refer to Tables 21 and 22 of the National Income & Expenditure 2019 publication issued in August 2020 (For long time series of these annual data see StatBank Tables N1921 &N1922). For information on chain linking see NIE 2019 Methodology Note. |
| Table A Gross Value Added at Current Basic Prices & Constant Basic Prices (Chain linked annually and referenced to year 2018)1 | €million | ||||||||
| CURRENT BASIC PRICES | CONSTANT BASIC PRICES | ||||||||
| Period | Foreign-owned MNE dominated | Other | Total | Foreign-owned MNE dominated | Other | Total | |||
| 2014 | 45,288 | 133,612 | 178,900 | 55,615 | 146,639 | 204,853 | |||
| 2015 | 101,101 | 143,243 | 244,344 | 102,083 | 155,520 | 257,448 | |||
| 2016 | 100,093 | 151,828 | 251,921 | 102,661 | 158,854 | 261,286 | |||
| 2017 | 114,411 | 165,476 | 279,887 | 113,099 | 167,924 | 280,832 | |||
| 2018 | 131,826 | 175,952 | 307,778 | 131,826 | 175,952 | 307,778 | |||
| 2019 | 146,540 | 188,288 | 334,828 | 140,903 | 183,836 | 324,739 | |||
| 2014 | |||||||||
| Q1 | 11,238 | 31,662 | 42,900 | 13,695 | 34,868 | 49,157 | |||
| Q2 | 12,367 | 33,119 | 45,485 | 15,099 | 36,248 | 51,920 | |||
| Q3 | 11,374 | 34,266 | 45,640 | 13,950 | 37,608 | 52,240 | |||
| Q4 | 10,309 | 34,566 | 44,875 | 12,871 | 37,916 | 51,536 | |||
| 2015 | |||||||||
| Q1 | 25,013 | 34,312 | 59,325 | 28,335 | 37,228 | 65,262 | |||
| Q2 | 24,140 | 35,405 | 59,545 | 23,471 | 38,382 | 61,931 | |||
| Q3 | 25,131 | 36,621 | 61,752 | 24,749 | 39,970 | 64,779 | |||
| Q4 | 26,817 | 36,905 | 63,722 | 25,528 | 39,940 | 65,475 | |||
| 2016 | |||||||||
| Q1 | 23,576 | 36,667 | 60,244 | 25,507 | 38,348 | 63,831 | |||
| Q2 | 22,097 | 37,828 | 59,925 | 23,174 | 39,518 | 62,532 | |||
| Q3 | 24,688 | 38,700 | 63,388 | 22,727 | 40,668 | 63,181 | |||
| Q4 | 29,732 | 38,632 | 68,364 | 31,253 | 40,320 | 71,741 | |||
| 2017 | |||||||||
| Q1 | 26,518 | 39,699 | 66,217 | 26,026 | 40,615 | 66,580 | |||
| Q2 | 23,683 | 40,795 | 64,478 | 24,603 | 41,192 | 65,713 | |||
| Q3 | 29,087 | 42,281 | 71,368 | 29,675 | 42,907 | 72,542 | |||
| Q4 | 35,123 | 42,700 | 77,823 | 32,794 | 43,210 | 75,996 | |||
| 2018 | |||||||||
| Q1 | 31,857 | 41,677 | 73,534 | 31,462 | 41,504 | 72,971 | |||
| Q2 | 29,928 | 43,449 | 73,377 | 32,348 | 43,465 | 75,809 | |||
| Q3 | 35,639 | 44,950 | 80,589 | 35,285 | 45,135 | 80,442 | |||
| Q4 | 34,401 | 45,877 | 80,278 | 32,731 | 45,849 | 78,555 | |||
| 2019 | |||||||||
| Q1 | 34,007 | 44,904 | 78,911 | 31,606 | 43,759 | 75,365 | |||
| Q2 | 33,690 | 46,077 | 79,767 | 34,777 | 44,913 | 79,691 | |||
| Q3 | 39,579 | 47,734 | 87,313 | 38,772 | 46,792 | 85,563 | |||
| Q4 | 39,265 | 49,572 | 88,837 | 35,748 | 48,372 | 84,120 | |||
| 2020 | |||||||||
| Q1 | 41,773 | 46,610 | 88,383 | 38,998 | 44,289 | 83,287 | |||
| Q2 | 40,282 | 38,719 | 79,000 | 39,870 | 36,284 | 76,154 | |||
| Annual Percentage Changes | |||||||||
| 2014 | 11.7 | 7.9 | 8.8 | 12.4 | 6.1 | 7.6 | |||
| 2015 | 123.2 | 7.2 | 36.6 | 83.6 | 6.1 | 25.7 | |||
| 2016 | -1.0 | 6.0 | 3.1 | 0.6 | 2.1 | 1.5 | |||
| 2017 | 14.3 | 9.0 | 11.1 | 10.2 | 5.7 | 7.5 | |||
| 2018 | 15.2 | 6.3 | 10.0 | 16.6 | 4.8 | 9.6 | |||
| 2019 | 11.2 | 7.0 | 8.8 | 6.9 | 4.5 | 5.5 | |||
| Percentage change on corresponding period of previous year | |||||||||
| 2014 | |||||||||
| Q1 | 8.5 | 7.7 | 7.9 | 7.2 | 6.5 | 6.7 | |||
| Q2 | 17.5 | 7.7 | 10.2 | 17.7 | 5.8 | 8.8 | |||
| Q3 | 12.8 | 8.5 | 9.5 | 13.7 | 6.4 | 8.1 | |||
| Q4 | 7.5 | 7.6 | 7.5 | 10.9 | 5.7 | 6.9 | |||
| 2015 | |||||||||
| Q1 | 122.6 | 8.4 | 38.3 | 106.9 | 6.8 | 32.8 | |||
| Q2 | 95.2 | 6.9 | 30.9 | 55.4 | 5.9 | 19.3 | |||
| Q3 | 121.0 | 6.9 | 35.3 | 77.4 | 6.3 | 24.0 | |||
| Q4 | 160.1 | 6.8 | 42.0 | 98.3 | 5.3 | 27.0 | |||
| 2016 | |||||||||
| Q1 | -5.7 | 6.9 | 1.5 | -10.0 | 3.0 | -2.2 | |||
| Q2 | -8.5 | 6.8 | 0.6 | -1.3 | 3.0 | 1.0 | |||
| Q3 | -1.8 | 5.7 | 2.6 | -8.2 | 1.7 | -2.5 | |||
| Q4 | 10.9 | 4.7 | 7.3 | 22.4 | 1.0 | 9.6 | |||
| 2017 | |||||||||
| Q1 | 12.5 | 8.3 | 9.9 | 2.0 | 5.9 | 4.3 | |||
| Q2 | 7.2 | 7.8 | 7.6 | 6.2 | 4.2 | 5.1 | |||
| Q3 | 17.8 | 9.3 | 12.6 | 30.6 | 5.5 | 14.8 | |||
| Q4 | 18.1 | 10.5 | 13.8 | 4.9 | 7.2 | 5.9 | |||
| 2018 | |||||||||
| Q1 | 20.1 | 5.0 | 11.0 | 20.9 | 2.2 | 9.6 | |||
| Q2 | 26.4 | 6.5 | 13.8 | 31.5 | 5.5 | 15.4 | |||
| Q3 | 22.5 | 6.3 | 12.9 | 18.9 | 5.2 | 10.9 | |||
| Q4 | -2.1 | 7.4 | 3.2 | -0.2 | 6.1 | 3.4 | |||
| 2019 | |||||||||
| Q1 | 6.7 | 7.7 | 7.3 | 0.5 | 5.4 | 3.3 | |||
| Q2 | 12.6 | 6.0 | 8.7 | 7.5 | 3.3 | 5.1 | |||
| Q3 | 11.1 | 6.2 | 8.3 | 9.9 | 3.7 | 6.4 | |||
| Q4 | 14.1 | 8.1 | 10.7 | 9.2 | 5.5 | 7.1 | |||
| 2020 | |||||||||
| Q1 | 22.8 | 3.8 | 12.0 | 23.4 | 1.2 | 10.5 | |||
| Q2 | 19.6 | -16.0 | -1.0 | 14.6 | -19.2 | -4.4 | |||
| 1Chain linked series not additive | |||||||||
| Table B Gross Value Added at Current Basic Prices & Constant Basic Prices (Chain linked annually and referenced to year 2018)1 - Seasonally Adjusted | €million | ||||||||
| CURRENT BASIC PRICES | CONSTANT BASIC PRICES | ||||||||
| Period | Foreign-owned MNE dominated | Other | Total | Foreign-owned MNE dominated | Other | Total | |||
| 2014 | |||||||||
| Q1 | 10,825 | 32,295 | 43,120 | 13,118 | 35,792 | 48,910 | |||
| Q2 | 12,223 | 33,109 | 45,332 | 14,963 | 36,469 | 51,433 | |||
| Q3 | 11,440 | 33,872 | 45,312 | 13,994 | 36,983 | 50,977 | |||
| Q4 | 10,598 | 34,306 | 44,904 | 13,340 | 37,367 | 50,706 | |||
| 2015 | |||||||||
| Q1 | 24,288 | 34,985 | 59,273 | 27,387 | 38,177 | 65,564 | |||
| Q2 | 24,506 | 35,440 | 59,945 | 23,736 | 38,699 | 62,435 | |||
| Q3 | 25,003 | 36,146 | 61,148 | 24,586 | 39,231 | 63,817 | |||
| Q4 | 26,912 | 36,635 | 63,547 | 25,877 | 39,364 | 65,241 | |||
| 2016 | |||||||||
| Q1 | 23,062 | 37,395 | 60,456 | 25,005 | 39,544 | 64,550 | |||
| Q2 | 23,058 | 37,887 | 60,946 | 23,831 | 39,676 | 63,507 | |||
| Q3 | 24,266 | 38,201 | 62,468 | 22,289 | 39,905 | 62,194 | |||
| Q4 | 29,257 | 38,281 | 67,537 | 31,186 | 39,662 | 70,848 | |||
| 2017 | |||||||||
| Q1 | 26,162 | 40,525 | 66,686 | 25,946 | 41,710 | 67,656 | |||
| Q2 | 25,207 | 40,916 | 66,123 | 25,496 | 41,637 | 67,132 | |||
| Q3 | 28,256 | 41,741 | 69,996 | 28,703 | 42,092 | 70,794 | |||
| Q4 | 34,269 | 42,165 | 76,433 | 32,604 | 42,364 | 74,968 | |||
| 2018 | |||||||||
| Q1 | 31,591 | 42,636 | 74,226 | 31,798 | 42,974 | 74,772 | |||
| Q2 | 32,190 | 43,639 | 75,829 | 33,482 | 43,739 | 77,221 | |||
| Q3 | 34,308 | 44,399 | 78,707 | 33,757 | 44,275 | 78,032 | |||
| Q4 | 33,531 | 45,115 | 78,645 | 32,659 | 44,785 | 77,444 | |||
| 2019 | |||||||||
| Q1 | 33,885 | 46,025 | 79,910 | 32,315 | 45,195 | 77,510 | |||
| Q2 | 36,231 | 46,367 | 82,598 | 35,657 | 45,492 | 81,149 | |||
| Q3 | 37,888 | 47,160 | 85,048 | 36,877 | 45,881 | 82,758 | |||
| Q4 | 38,467 | 48,571 | 87,038 | 35,966 | 47,113 | 83,079 | |||
| 2020 | |||||||||
| Q1 | 41,695 | 47,877 | 89,572 | 40,080 | 45,854 | 85,935 | |||
| Q2 | 43,154 | 38,988 | 82,142 | 40,525 | 36,770 | 77,295 | |||
| Percentage change on previous quarter | |||||||||
| 2014 | |||||||||
| Q1 | 6.9 | 1.4 | 2.7 | 6.6 | 1.4 | 2.7 | |||
| Q2 | 12.9 | 2.5 | 5.1 | 14.1 | 1.9 | 5.2 | |||
| Q3 | -6.4 | 2.3 | -0.0 | -6.5 | 1.4 | -0.9 | |||
| Q4 | -7.4 | 1.3 | -0.9 | -4.7 | 1.0 | -0.5 | |||
| 2015 | |||||||||
| Q1 | 129.2 | 2.0 | 32.0 | 105.3 | 2.2 | 29.3 | |||
| Q2 | 0.9 | 1.3 | 1.1 | -13.3 | 1.4 | -4.8 | |||
| Q3 | 2.0 | 2.0 | 2.0 | 3.6 | 1.4 | 2.2 | |||
| Q4 | 7.6 | 1.4 | 3.9 | 5.3 | 0.3 | 2.2 | |||
| 2016 | |||||||||
| Q1 | -14.3 | 2.1 | -4.9 | -3.4 | 0.5 | -1.1 | |||
| Q2 | -0.0 | 1.3 | 0.8 | -4.7 | 0.3 | -1.6 | |||
| Q3 | 5.2 | 0.8 | 2.5 | -6.5 | 0.6 | -2.1 | |||
| Q4 | 20.6 | 0.2 | 8.1 | 39.9 | -0.6 | 13.9 | |||
| 2017 | |||||||||
| Q1 | -10.6 | 5.9 | -1.3 | -16.8 | 5.2 | -4.5 | |||
| Q2 | -3.7 | 1.0 | -0.8 | -1.7 | -0.2 | -0.8 | |||
| Q3 | 12.1 | 2.0 | 5.9 | 12.6 | 1.1 | 5.5 | |||
| Q4 | 21.3 | 1.0 | 9.2 | 13.6 | 0.6 | 5.9 | |||
| 2018 | |||||||||
| Q1 | -7.8 | 1.1 | -2.9 | -2.5 | 1.4 | -0.3 | |||
| Q2 | 1.9 | 2.4 | 2.2 | 5.3 | 1.8 | 3.3 | |||
| Q3 | 6.6 | 1.7 | 3.8 | 0.8 | 1.2 | 1.0 | |||
| Q4 | -2.3 | 1.6 | -0.1 | -3.3 | 1.2 | -0.8 | |||
| 2019 | |||||||||
| Q1 | 1.1 | 2.0 | 1.6 | -1.1 | 0.9 | 0.1 | |||
| Q2 | 6.9 | 0.7 | 3.4 | 10.3 | 0.7 | 4.7 | |||
| Q3 | 4.6 | 1.7 | 3.0 | 3.4 | 0.9 | 2.0 | |||
| Q4 | 1.5 | 3.0 | 2.3 | -2.5 | 2.7 | 0.4 | |||
| 2020 | |||||||||
| Q1 | 8.4 | -1.4 | 2.9 | 11.4 | -2.7 | 3.4 | |||
| Q2 | 3.5 | -18.6 | -8.3 | 1.1 | -19.8 | -10.1 | |||
| 1Chain linked series not additive | |||||||||
This release provides gross value added at current basic prices and constant basic prices (chain linked and referenced to 2018) for the economy divided into two sectors, namely
(a) the economic sectors dominated by Foreign-owned Multi National Enterprises (MNEs)
and
(b) all other remaining sectors.
Gross value added at basic prices is measured as the difference between output at basic prices and intermediate consumption at purchasers’ prices.
The sectoral data underlying the aggregates in the release are the same as those used for
The correspondence with the relevant A10 sections of NACE Rev.2 is as follows:
|
Agriculture, forestry and fishing |
Section A |
|
Industry (excluding Construction) |
Sections B,C,D,E |
|
Of which: Manufacturing |
Section C |
|
Construction |
Section F |
|
Distribution, transport, hotels and restaurants |
Sections G,H,I |
|
Information and communication |
Section J |
|
Financial and insurance activities |
Section K |
|
Real estate activities |
Section L |
|
Professional, admin and support services |
Sections M,N |
|
Public admin, education and health |
Sections O,P,Q |
|
Arts, entertainment and other services |
Sections R,S,T |
National accounts are compiled in the EU according to the European System of National and Regional Accounts (ESA) framework. In 2014, the new ESA 2010 framework replaced the ESA 95 version and all EU member states were required to adopt ESA 2010 by September 2014. ESA 2010 is the European version of the current UN mandated international standards for national accounts statistics, the System of National Accounts (SNA) 2008. The results for all years in this release are published on an ESA 2010 basis.
Nace classification
In compliance with EU regulations the contents of the sectors in this release conform to the Nace Rev. 2 system which corresponds with the UN International Standard Industrial Classification (ISIC Rev 4).
For the Foreign-owned MNE dominated sector and ‘Other’ sector variables set out in Tables A and B of this release, the following is the correspondence with the relevant NIE and Nace Rev. 2 sectors:
|
NIE Sectors |
Nace 2 Sections |
Foreign-owned |
Other (Nace codes) |
|
Agriculture, forestry and fishing |
Section A |
|
01-03 |
|
Industry (excluding Construction) |
Sections B to E |
18.2, 20, 21, 26, |
05-18.1, |
|
Of which: Manufacturing |
Section C |
18.2, 20, 21, 26, |
10-18.1, |
|
Construction |
Section F |
|
41-43 |
|
Distribution, transport, hotels and restaurants |
Sections G to I |
|
45-56 |
|
Information and communication |
Section J |
58-63 |
n.a. |
|
Financial and insurance activities |
Section K |
|
64-66 |
|
Real estate activities |
Section L |
|
68 |
|
Professional, admin and support services |
Sections M to N |
69-82 |
|
|
Public admin, education and health |
Sections O to Q |
|
84-88 |
|
Arts, entertainment and other services |
Sections R to T |
|
90-98 |
For further information on the Nace Rev. 2 classification of industrial activity, please click here.
Seasonal Adjustment
Seasonal adjustment is conducted using the indirect seasonal adjustment approach. This approach is in line with CSO’s Policy on Seasonal Adjustment and Eurostat’s Recommendations on Seasonal Adjustment. Under this indirect approach, individual time series are independently adjusted at the component level. These individual series are then aggregated to compute seasonally adjusted results for Total Gross Value Added at Current Prices or Constant Prices respectively. This indirect approach is applied to the Foreign-owned MNE dominated sector, the combination of all other remaining non-MNE dominated NACE sectors (i.e. the ‘Other’ sector) and the seasonally adjusted values for the total economy are then derived as the sum of the seasonally adjusted components. On this account, the sum of the seasonally adjusted components of the Foreign-owned MNE dominated and ‘Other’ sectors add to the respective seasonally adjusted total economy series. As part of the seasonal adjustment process, ARIMA models have been identified for each series based on unadjusted data spanning Q1 1995 to Q1 2020. These models are then applied to the entire series (Q1 1995 to Q2 2020). Seasonal factors and the parameters of the ARIMA models will be updated each quarter.
COVID-19 note
Seasonally adjusting the Gross Value Added for the Foreign-owned Multinational Enterprises and Other Sectors will continue to be challenging until the full scale and shape of the impact COVID-19 has on the time series is better understood. Based on Eurostat guidance, Q1 and Q2 2020 have been modelled as additive outliers (AO) which will be reviewed as required. This treatment for seasonal adjustment reflects the volatile nature of economic sectors experiencing a greater COVID impact, such as the retail and wholesale sectors, and will be kept under review going forward as required. Users should be aware that as further data observations become available in the months and quarters ahead, revisions to the seasonal adjustment models may result in revisions to the quarterly seasonally adjusted series.
The adjustments are completed by applying the X-13-ARIMA model, developed by the U.S. Census Bureau to the unadjusted data. This methodology estimates seasonal factors while also taking into consideration factors that impact on the quality of the seasonal adjustment such as:
For additional information on the use of X-13-ARIMA see here.
 Hide Background Notes
Scan the QR code below to view this release online or go to
http://www.cso.ie/en/releasesandpublications/er/gvafmq/grossvalueaddedforforeign-ownedmultinationalenterprisesandothersectorsquarter22020/
 Show Table A Gross Value Added at Current Basic Prices & Constant Basic Prices (Chain linked annually and referenced to year 2018)
 Hide Table A Gross Value Added at Current Basic Prices & Constant Basic Prices (Chain linked annually and referenced to year 2018)