
This release has been compiled during the COVID-19 crisis. The results contained in this release reflect some of the economic impacts of the COVID-19 situation. For further information see Background notes.
| General Government Finances | ||||||
| Period | Deficit/Surplus | Gross Debt | Net Debt | |||
| €bn | % of quarterly GDP | €bn | % of annualised GDP | €bn | % of annualised GDP | |
| 2019 Q1 | -2.1 | -2.5 | 215.0 | 64.6 | 178.4 | 53.6 |
| 2019 Q2 | 0.7 | 0.8 | 213.8 | 63.0 | 175.3 | 51.6 |
| 2019 Q3 | -1.2 | -1.3 | 213.1 | 61.2 | 175.1 | 50.3 |
| 2019 Q4 | 3.7 | 4.0 | 204.0 | 57.2 | 175.3 | 49.2 |
| 2020 Q1 | -3.6 | -3.9 | 213.7 | 58.8 | 178.2 | 49.0 |
| 2020 Q2 | -6.2 | -7.4 | 225.8 | 62.1 | 178.7 | 49.2 |
| 2020 Q3 | -6.7 | -6.6 | 227.2 | 61.2 | 183.2 | 49.3 |
| 2020 Q4 | -2.3 | -2.4 | 217.9 | 58.4 | 186.8 | 50.1 |
| 2021 Q1 | -6.8 | -6.7 | 230.5 | 60.5 | 192.2 | 50.5 |
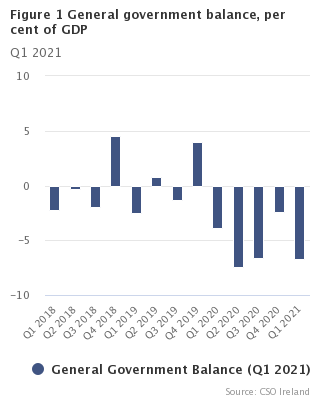
General government recorded a deficit of €6.8bn (6.7% of quarterly GDP) in the first quarter of 2021 and is the fifth consecutive deficit. While the first quarter position is generally a deficit, due to the timing of revenue and expenditure flows over the course of the year, the scale of the deficit this quarter reflects the ongoing pandemic supports. The level of expenditure rose by €4.8bn compared with Q1 2020 while revenue has increased by €1.6bn. Excluding c.€3.7bn of COVID-19 related expenditure leaves an underlying deficit of approximately €3.1bn. It should be noted that support measures were introduced towards the end of Q1 2020 and this can influence year-on-year comparisons.
In Q1 2021, government revenue of €19.5bn was 8.7% higher than the same period of 2020. This is mainly due to tax revenue which was 13.7% higher than Q1 2020 on a par with pre-pandemic levels. Within this, indirect taxes were up 23.7%, predominantly due to VAT receipts, with direct taxes (including corporation tax and income tax) up 5.7%. On the other hand sale of goods and services (reduced receipts across health, transport and local government) was down 16.4% which can be attributed to the ongoing level of restrictions, while investment income was down 10.6%.
Expenditure in Q1 2021 increased significantly reflecting the supports put in place by Government. Subsidies (mainly the Employment Wage Subsidy Scheme) and social transfers (Pandemic Unemployment Payment) increased by €3.8bn compared to the same period last year. Intermediate consumption increased by €0.8bn, mostly related to increase spending in the health sector, while current transfers are up €0.4bn. As a result, government expenditure rose to €26.3bn in Q1 2021. For further details of COVID-19 related expenditure in Q1 2021 see background notes.
Financing the deficit - general government debt at €230.5bn at end of Q1 2021
Gross general government debt increased by €12.6bn in the quarter to €230.5bn. The increase was due primarily to the issuance of short term (€2.8bn) and long term (€6.8bn) debt securities and an increase in long term loan liabilities (€2.1bn) with a draw down from the European Commission’s Support to mitigate Unemployment Risks in an Emergency (SURE) instrument. There were also small movements in the other debt instrument liabilities, with currency and deposits rising by €0.6bn and short term loans by €0.3bn. The debt to GDP ratio stood at 60.5% at the end of the first quarter.
While EDP debt instrument assets increased by €7.2bn in the quarter, this was offset by the rise of €12.6bn in liabilities resulting in net general government debt increasing by €5.4bn. The increase in assets is due entirely to a rise in currency and deposits - the proceeds of the issuance of debt securities and borrowing under the SURE facility.
|
Government accounts are compiled in the EU according to the European System of National Accounts 2010 (ESA2010) framework. This release contains quarterly Government Finance Statistics (GFS) and is aligned to the National Income and Expenditure 2020 (NIE) published on 15 July 2021 and the Government Income and Expenditure 2020 (GIE) published on 16 July 2021. A full description of the concepts and definitions used in the production of these statistics is provided in the Background notes. |
| GG Gross Debt | GG Net Debt | |
| Q1 2018 | 68.5 | 57.7 |
| Q2 2018 | 68 | 56 |
| Q3 2018 | 66.8 | 55 |
| Q4 2018 | 63.1 | 54.4 |
| Q1 2019 | 64.6 | 53.6 |
| Q2 2019 | 63 | 51.6 |
| Q3 2019 | 61.2 | 50.3 |
| Q4 2019 | 57.2 | 49.2 |
| Q1 2020 | 58.8 | 49 |
| Q2 2020 | 62.1 | 49.2 |
| Q3 2020 | 61.2 | 49.3 |
| Q4 2020 | 58.4 | 50.1 |
| Q1 2021 | 60.5 | 50.5 |
| GG Debt per Capita | |
| 2009 Q1 | 19962 |
| 2010 Q1 | 27419 |
| 2011 Q1 | 34213 |
| 2012 Q1 | 42468 |
| 2013 Q1 | 47517 |
| 2014 Q1 | 46607 |
| 2015 Q1 | 43827 |
| 2016 Q1 | 44202 |
| 2017 Q1 | 44013 |
| 2018 Q1 | 43863 |
| 2019 Q1 | 44273 |
| 2020 Q1 | 43421 |
| 2021 Q1 | 46303 |
| Table 1 General Government transactions: revenue, expenditure, financing and deficit | |||||||||||||||||
| €million | |||||||||||||||||
| Description | ESA2010 code | 2018 Q1 | 2018 Q2 | 2018 Q3 | 2018 Q4 | 2019 Q1 | 2019 Q2 | 2019 Q3 | 2019 Q4 | 2020 Q1 | 2020 Q2 | 2020 Q3 | 2020 Q4 | 2021 Q1 | |||
| General Government transactions | |||||||||||||||||
| Revenue | TR | 17,903 | 20,229 | 18,872 | 26,081 | 18,884 | 21,656 | 20,526 | 27,066 | 17,920 | 21,129 | 19,992 | 25,486 | 19,478 | |||
| Taxes and social contributions | D2 + D5 + D91 + D61 | 16,424 | 17,622 | 17,211 | 23,918 | 17,557 | 18,980 | 18,846 | 25,128 | 16,510 | 19,045 | 18,459 | 23,948 | 18,218 | |||
| Taxes | D2 + D5 + D91 | 12,785 | 14,088 | 13,715 | 19,961 | 13,617 | 15,147 | 15,076 | 20,838 | 12,511 | 15,514 | 14,513 | 19,751 | 14,230 | |||
| Social contributions | D61 | 3,639 | 3,534 | 3,495 | 3,957 | 3,940 | 3,833 | 3,770 | 4,290 | 3,999 | 3,531 | 3,946 | 4,198 | 3,988 | |||
| Sales of goods and services | P1O | 1,055 | 1,216 | 1,224 | 1,433 | 1,051 | 1,212 | 1,219 | 1,428 | 1,115 | 917 | 1,073 | 1,075 | 934 | |||
| Investment income | D4 | 110 | 1,076 | 87 | 271 | 57 | 1,233 | 119 | 198 | 47 | 880 | 156 | 76 | 42 | |||
| Current transfer revenue (excluding taxes) | D7 | 170 | 184 | 219 | 293 | 110 | 120 | 218 | 196 | 148 | 176 | 191 | 174 | 185 | |||
| Capital transfer revenue (excluding taxes) | D9N | 144 | 131 | 133 | 165 | 109 | 112 | 124 | 115 | 100 | 111 | 113 | 213 | 100 | |||
| Expenditure | TE | 19,667 | 20,494 | 20,551 | 22,310 | 21,015 | 20,942 | 21,743 | 23,360 | 21,529 | 27,357 | 26,646 | 27,755 | 26,304 | |||
| Expense | Expense | 19,028 | 19,779 | 20,086 | 21,538 | 20,053 | 20,064 | 20,981 | 22,364 | 20,639 | 26,482 | 25,229 | 26,895 | 25,438 | |||
| Compensation of employees | D1 | 5,453 | 5,544 | 5,532 | 5,596 | 5,727 | 5,930 | 5,750 | 6,027 | 6,032 | 6,122 | 5,983 | 6,508 | 6,091 | |||
| Use of goods and services plus taxes payable | P2 + D5 + D29 | 2,485 | 2,727 | 3,037 | 2,967 | 2,817 | 3,034 | 3,430 | 3,353 | 3,000 | 3,734 | 4,083 | 4,087 | 3,771 | |||
| Depreciation (Consumption of fixed capital) | P51c | 1,094 | 1,094 | 1,094 | 1,094 | 1,184 | 1,184 | 1,184 | 1,184 | 1,262 | 1,262 | 1,262 | 1,262 | 1,262 | |||
| Interest (excluding FISIM) | D41 | 1,392 | 1,333 | 1,348 | 1,244 | 1,201 | 1,228 | 1,120 | 1,083 | 1,040 | 950 | 977 | 872 | 828 | |||
| Subsidies | D3 | 418 | 436 | 458 | 635 | 374 | 392 | 413 | 554 | 471 | 2,185 | 1,719 | 1,713 | 1,604 | |||
| Social benefits | D62 + D632 | 6,805 | 6,919 | 7,485 | 8,188 | 7,067 | 7,202 | 7,814 | 8,561 | 7,277 | 10,456 | 9,780 | 10,619 | 9,964 | |||
| Other current transfers | D7 | 982 | 985 | 793 | 1,037 | 1,300 | 669 | 959 | 824 | 1,080 | 1,256 | 897 | 1,133 | 1,442 | |||
| Capital transfers | D9 | 399 | 741 | 339 | 778 | 383 | 424 | 311 | 777 | 478 | 517 | 528 | 702 | 476 | |||
| Net operating balance | NOB | -1,125 | 450 | -1,213 | 4,542 | -1,169 | 1,592 | -455 | 4,702 | -2,719 | -5,353 | -5,237 | -1,409 | -5,959 | |||
| Net acquisition of non-financial assets | P5 + NP - P51c | 639 | 715 | 465 | 772 | 962 | 879 | 762 | 996 | 890 | 875 | 1,417 | 861 | 866 | |||
| General Government Surplus/Deficit | B9 | -1,765 | -266 | -1,679 | 3,770 | -2,131 | 714 | -1,217 | 3,705 | -3,608 | -6,228 | -6,654 | -2,269 | -6,826 | |||
| equals | |||||||||||||||||
| Net acquisition of financial assets | ΔFA | 7,063 | 8,131 | 10,501 | -8,417 | 7,859 | -177 | -415 | -7,118 | 3,299 | 7,977 | -2,620 | -11,798 | 4,893 | |||
| Debt instruments | F2 + F3 + F4 | 7,528 | 4,777 | 429 | -9,740 | 8,128 | 1,818 | -575 | -9,232 | 6,925 | 8,255 | -2,977 | -12,951 | 7,150 | |||
| Equity and Investment Fund Shares | F5 | 240 | -1,359 | 3 | -122 | -14 | -2,465 | -87 | 215 | -17 | -1,153 | -138 | 15 | 242 | |||
| Other financial assets | F6 + F7 + F8 | -705 | 4,713 | 10,069 | 1,445 | -255 | 470 | 247 | 1,899 | -3,609 | 875 | 495 | 1,138 | -2,499 | |||
| less | |||||||||||||||||
| Net incurrence of liabilities | ΔL | 8,828 | 8,397 | 12,180 | -12,187 | 9,990 | -891 | 802 | -10,823 | 6,907 | 14,205 | 4,034 | -9,529 | 11,719 | |||
| Debt instruments | F2 + F3 + F4 | 8,864 | 3,673 | 2,529 | -12,462 | 10,009 | -906 | 702 | -11,082 | 6,729 | 13,811 | 3,843 | -9,918 | 11,850 | |||
| Other liabilities | F5 + F6 + F7 + F8 | -36 | 4,724 | 9,651 | 275 | -19 | 15 | 100 | 259 | 178 | 394 | 191 | 389 | -131 | |||
| Memo: Net derivative flows on debt interest swap contracts | -55 | -52 | -48 | -45 | -38 | -37 | -42 | -21 | -21 | -26 | -17 | -17 | -11 | ||||
| General Government Surplus/Deficit (% of quarterly GDP) | -2.2 | -0.3 | -2.0 | 4.5 | -2.5 | 0.8 | -1.3 | 4.0 | -3.9 | -7.4 | -6.6 | -2.4 | -6.7 | ||||
| Quarterly GDP at current market prices | 79,310 | 78,151 | 84,578 | 84,003 | 86,107 | 84,701 | 93,185 | 92,532 | 93,183 | 84,562 | 100,960 | 94,164 | 101,164 | ||||
| Table 2 General Government Net Worth, Gross and Net Debt | |||||||||||||||||||
| €million | |||||||||||||||||||
| Description | ESA2010 code | 2018 Q1 | 2018 Q2 | 2018 Q3 | 2018 Q4 | 2019 Q1 | 2019 Q2 | 2019 Q3 | 2019 Q4 | 2020 Q1 | 2020 Q2 | 2020 Q3 | 2020 Q4 | 2021 Q1 | |||||
| General Government net worth | |||||||||||||||||||
| Net worth at market value, excluding pension liabilities | NW | -27,515 | -27,154 | -26,690 | -23,041 | -21,812 | -19,331 | -19,818 | -9,692 | -18,639 | -19,786 | -23,507 | -24,081 | -24,385 | |||||
| equals | |||||||||||||||||||
| Non-financial assets at market value | NFA | 122,204 | 124,473 | 126,491 | 128,816 | 132,012 | 135,124 | 138,120 | 141,350 | 143,401 | 145,437 | 148,015 | 150,036 | 150,902 | |||||
| plus | |||||||||||||||||||
| Financial net worth at market value, excluding pension liabilities | FNW | -149,719 | -151,627 | -153,181 | -151,857 | -153,824 | -154,455 | -157,938 | -151,042 | -162,040 | -165,223 | -171,522 | -174,117 | -175,287 | |||||
| equals | |||||||||||||||||||
| Financial assets at market value | FA | 86,572 | 93,082 | 101,917 | 91,817 | 102,830 | 101,950 | 99,382 | 94,555 | 93,412 | 104,856 | 102,103 | 92,858 | 99,842 | |||||
| EDP debt instruments | F2 + F3 + F4 | 32,980 | 37,802 | 38,236 | 28,483 | 36,657 | 38,502 | 37,927 | 28,637 | 35,503 | 47,087 | 44,080 | 31,107 | 38,267 | |||||
| Equity and Investment Fund Shares | F5 | 43,253 | 40,153 | 38,462 | 36,627 | 39,890 | 36,567 | 34,696 | 37,417 | 32,972 | 31,675 | 31,282 | 33,894 | 35,953 | |||||
| Other financial assets | F6 + F7 + F8 | 10,339 | 15,127 | 25,219 | 26,707 | 26,283 | 26,881 | 26,759 | 28,501 | 24,937 | 26,094 | 26,741 | 27,857 | 25,622 | |||||
| less | |||||||||||||||||||
| Liabilities at market value | L | 236,291 | 244,709 | 255,098 | 243,674 | 256,654 | 256,405 | 257,320 | 245,597 | 255,452 | 270,079 | 273,625 | 266,975 | 275,129 | |||||
| EDP debt instruments | F2 + F3 + F4 | 226,309 | 229,943 | 230,771 | 219,158 | 232,230 | 232,047 | 233,081 | 221,235 | 231,007 | 245,187 | 248,573 | 241,562 | 249,353 | |||||
| Other liabilities | F5 + F6 + F7 + F8 | 9,982 | 14,766 | 24,327 | 24,516 | 24,424 | 24,358 | 24,239 | 24,362 | 24,445 | 24,892 | 25,052 | 25,413 | 25,776 | |||||
| Memo: Estimated pension liabilities of government | 114,500 | 114,500 | 114,500 | 149,600 | 149,600 | 149,600 | 149,600 | 149,600 | 149,600 | 149,600 | 149,600 | 149,600 | 149,600 | ||||||
| Memo: Net worth, including pension liabilities | -142,015 | -141,654 | -141,190 | -172,641 | -171,412 | -168,931 | -169,418 | -159,292 | -168,239 | -169,386 | -173,107 | -173,681 | -173,985 | ||||||
| Contingent liabilities | 5,066 | 5,066 | 5,066 | 5,066 | 5,314 | 5,314 | 5,314 | 5,314 | 6,182 | 6,182 | 6,182 | 6,182 | 6,182 | ||||||
| Memo: Net worth, including pension liabilities and contingent liabilities | -147,080 | -146,720 | -146,256 | -177,707 | -176,726 | -174,245 | -174,732 | -164,606 | -174,421 | -175,569 | -179,290 | -179,863 | -180,167 | ||||||
| General Government: changes in net worth | |||||||||||||||||||
| Opening net worth | -28,886 | -27,515 | -27,154 | -26,690 | -23,041 | -21,812 | -19,331 | -19,818 | -9,692 | -18,639 | -19,786 | -23,507 | -24,081 | ||||||
| Change in net worth due to transactions | -1,125 | 450 | -1,213 | 4,542 | -1,169 | 1,592 | -455 | 4,702 | -2,719 | -5,353 | -5,237 | -1,409 | -5,959 | ||||||
| Net acquisition of non-financial assets | P5 + NP - P51c | 639 | 715 | 465 | 772 | 962 | 879 | 762 | 996 | 890 | 875 | 1,417 | 861 | 866 | |||||
| Net lending/net borrowing | B9 | -1,765 | -266 | -1,679 | 3,770 | -2,131 | 714 | -1,217 | 3,705 | -3,608 | -6,228 | -6,654 | -2,269 | -6,826 | |||||
| Change in net worth due to other economic flows | Kx | 2,497 | -89 | 1,678 | -893 | 2,398 | 889 | -32 | 5,425 | -6,229 | 4,206 | 1,516 | 835 | 5,656 | |||||
| Other changes in non-financial assets | 1,553 | 1,553 | 1,553 | 1,553 | 2,234 | 2,234 | 2,234 | 2,234 | 1,161 | 1,161 | 1,161 | 1,161 | 0 | ||||||
| Other changes in financial assets | 116 | -1,621 | -1,666 | -1,683 | 3,154 | -703 | -2,153 | 2,291 | -4,442 | 3,467 | -133 | 2,553 | 2,091 | ||||||
| Other changes in liabilities | 828 | -21 | 1,791 | -763 | -2,990 | -642 | -113 | 900 | -2,948 | -422 | 488 | -2,879 | 3,565 | ||||||
| Closing net worth | -27,515 | -27,154 | -26,690 | -23,041 | -21,812 | -19,331 | -19,818 | -9,692 | -18,639 | -19,786 | -23,507 | -24,081 | -24,385 | ||||||
| General Government Debt (GGDebt) | |||||||||||||||||||
| Debt instrument liabilities at market value | F2 + F3 + F4 | 226,309 | 229,943 | 230,771 | 219,158 | 232,230 | 232,047 | 233,081 | 221,235 | 231,007 | 245,187 | 248,573 | 241,562 | 249,353 | |||||
| + Difference between EDP face value and market value | -16,094 | -15,444 | -15,096 | -13,311 | -17,198 | -18,259 | -20,017 | -17,254 | -17,311 | -19,354 | -21,328 | -23,650 | -18,886 | ||||||
| Gross General Government Debt (EDP face value) | GGDebt | 210,215 | 214,499 | 215,675 | 205,847 | 215,032 | 213,788 | 213,064 | 203,981 | 213,696 | 225,833 | 227,245 | 217,912 | 230,467 | |||||
| less EDP debt instrument assets | F2 + F3 + F4 | -32,980 | -37,802 | -38,236 | -28,483 | -36,657 | -38,502 | -37,927 | -28,637 | -35,503 | -47,087 | -44,080 | -31,107 | -38,267 | |||||
| Net General Government Debt | GGNetDebt | 177,235 | 176,697 | 177,439 | 177,364 | 178,375 | 175,286 | 175,137 | 175,344 | 178,193 | 178,746 | 183,165 | 186,805 | 192,200 | |||||
| Closing Net Worth (% of annualised GDP) | -9.0 | -8.6 | -8.3 | -7.1 | -6.6 | -5.7 | -5.7 | -2.7 | -5.1 | -5.4 | -6.3 | -6.5 | -6.4 | ||||||
| Gross General Government Debt (% of annualised GDP) | 68.5 | 68.0 | 66.8 | 63.1 | 64.6 | 63.0 | 61.2 | 57.2 | 58.8 | 62.1 | 61.2 | 58.4 | 60.5 | ||||||
| Net General Government Debt (% of annualised GDP) | 57.7 | 56.0 | 55.0 | 54.4 | 53.6 | 51.6 | 50.3 | 49.2 | 49.0 | 49.2 | 49.3 | 50.1 | 50.5 | ||||||
| Annualised GDP | 306,964 | 315,436 | 322,718 | 326,043 | 332,840 | 339,390 | 347,997 | 356,526 | 363,602 | 363,463 | 371,237 | 372,869 | 380,849 | ||||||
| Table 3 General Government: detailed classification of revenue and output | ||||||||||||||||||
| €million | ||||||||||||||||||
| Description | ESA2010 code | 2018 Q1 | 2018 Q2 | 2018 Q3 | 2018 Q4 | 2019 Q1 | 2019 Q2 | 2019 Q3 | 2019 Q4 | 2020 Q1 | 2020 Q2 | 2020 Q3 | 2020 Q4 | 2021 Q1 | ||||
| Total Revenue | TR | 17,903 | 20,229 | 18,872 | 26,081 | 18,884 | 21,656 | 20,526 | 27,066 | 17,920 | 21,129 | 19,992 | 25,486 | 19,478 | ||||
| Taxes and social contributions | 16,424 | 17,622 | 17,211 | 23,918 | 17,557 | 18,980 | 18,846 | 25,128 | 16,510 | 19,045 | 18,459 | 23,948 | 18,218 | |||||
| Taxes | D2 + D5 + D91 | 12,785 | 14,088 | 13,715 | 19,961 | 13,617 | 15,147 | 15,076 | 20,838 | 12,511 | 15,514 | 14,513 | 19,751 | 14,230 | ||||
| Indirect taxes (taxes on production and imports) | D2 | 6,784 | 5,247 | 7,381 | 6,332 | 7,332 | 5,734 | 7,754 | 6,700 | 5,586 | 5,313 | 7,269 | 6,049 | 6,908 | ||||
| Taxes on products | D21 | 5,832 | 4,423 | 6,578 | 5,318 | 6,376 | 4,908 | 6,893 | 5,737 | 4,692 | 4,747 | 6,638 | 5,277 | 6,175 | ||||
| of which Value-Added Tax | D211 | 4,090 | 2,416 | 4,619 | 3,050 | 4,440 | 2,602 | 4,912 | 3,327 | 2,805 | 2,269 | 4,659 | 2,897 | 4,321 | ||||
| Other taxes on production | D29 | 953 | 824 | 803 | 1,014 | 956 | 826 | 861 | 964 | 893 | 566 | 631 | 772 | 733 | ||||
| Direct taxes | D5 | 5,967 | 8,789 | 6,248 | 13,283 | 6,238 | 9,360 | 7,241 | 13,787 | 6,872 | 10,147 | 7,148 | 13,399 | 7,261 | ||||
| Taxes on income, profits and capital gains | D51 | 5,689 | 8,539 | 6,009 | 13,055 | 5,961 | 9,114 | 7,001 | 13,570 | 6,615 | 9,909 | 6,900 | 13,178 | 6,997 | ||||
| Other current direct taxes | D59 | 278 | 250 | 240 | 228 | 277 | 246 | 240 | 217 | 258 | 238 | 249 | 221 | 264 | ||||
| Capital taxes | D91 | 34 | 52 | 86 | 346 | 47 | 52 | 81 | 350 | 53 | 53 | 96 | 303 | 61 | ||||
| Social contributions | D61 | 3,639 | 3,534 | 3,495 | 3,957 | 3,940 | 3,833 | 3,770 | 4,290 | 3,999 | 3,531 | 3,946 | 4,198 | 3,988 | ||||
| Actual social contributions | D611 + D613 | 3,013 | 2,897 | 2,860 | 3,314 | 3,250 | 3,172 | 3,089 | 3,629 | 3,273 | 2,822 | 3,219 | 3,508 | 3,260 | ||||
| PRSI receipts | D611 + D613(pt) | 2,659 | 2,537 | 2,501 | 2,951 | 2,901 | 2,803 | 2,743 | 3,255 | 2,908 | 2,452 | 2,863 | 3,111 | 2,893 | ||||
| Government employees' pension contributions | D613(pt) | 354 | 360 | 359 | 363 | 349 | 369 | 346 | 374 | 365 | 369 | 356 | 398 | 367 | ||||
| Employers' imputed social contributions | D612 | 626 | 637 | 635 | 643 | 690 | 661 | 681 | 662 | 726 | 710 | 727 | 689 | 727 | ||||
| Sales of goods and services | P1O | 1,055 | 1,216 | 1,224 | 1,433 | 1,051 | 1,212 | 1,219 | 1,428 | 1,115 | 917 | 1,073 | 1,075 | 934 | ||||
| Sales of market establishments (= market output) | P11 | 0 | 0 | 0 | 0 | 0 | 0 | 0 | 0 | 0 | 0 | 0 | 0 | 0 | ||||
| Imputed sales related to production of own-use capital assets (= output for own final use) | P12 | 5 | 5 | 5 | 5 | 6 | 6 | 6 | 6 | 6 | 6 | 6 | 6 | 6 | ||||
| Incidental sales and fees of non-market establishments | P131 | 1,049 | 1,211 | 1,218 | 1,428 | 1,045 | 1,206 | 1,214 | 1,422 | 1,110 | 911 | 1,067 | 1,069 | 928 | ||||
| Investment income | D4 | 110 | 1,076 | 87 | 271 | 57 | 1,233 | 119 | 198 | 47 | 880 | 156 | 76 | 42 | ||||
| Interest (excluding FISIM) | D41 | 50 | 41 | 36 | 52 | 32 | 38 | 34 | 34 | 19 | 25 | 11 | 29 | 13 | ||||
| Dividends / Other investment income | D42 + D44 | 32 | 1,007 | 23 | 191 | 7 | 1,176 | 67 | 146 | 11 | 838 | 128 | 30 | 11 | ||||
| Rent of land and subsoil assets | D45 | 28 | 28 | 28 | 28 | 18 | 18 | 18 | 18 | 17 | 17 | 17 | 17 | 17 | ||||
| Current transfer revenue | D39 + D7 | 170 | 184 | 219 | 293 | 110 | 120 | 218 | 196 | 148 | 176 | 191 | 174 | 185 | ||||
| Subsidies | D39 | 0 | 0 | 0 | 0 | 0 | 0 | 0 | 0 | 0 | 0 | 0 | 0 | 0 | ||||
| Other current transfers | D7 | 170 | 184 | 219 | 293 | 110 | 120 | 218 | 196 | 148 | 176 | 191 | 174 | 185 | ||||
| Non-life insurance claims | D72 | 4 | 4 | 4 | 4 | 4 | 4 | 4 | 4 | 4 | 4 | 4 | 4 | 4 | ||||
| Other Domestic - Current | D7N_S1 | 89 | 99 | 132 | 88 | 103 | 112 | 146 | 104 | 140 | 149 | 183 | 142 | 178 | ||||
| From Rest of World - Current | D7N_S2 | 76 | 81 | 82 | 200 | 3 | 4 | 68 | 88 | 3 | 22 | 3 | 28 | 3 | ||||
| Capital transfer revenue | D9N | 144 | 131 | 133 | 165 | 109 | 112 | 124 | 115 | 100 | 111 | 113 | 213 | 100 | ||||
| Output | P1 | 9,031 | 9,365 | 9,663 | 9,656 | 9,728 | 10,149 | 10,365 | 10,564 | 10,293 | 11,118 | 11,327 | 11,856 | 11,123 | ||||
| Market output (sales of market establishments) | P11 | 0 | 0 | 0 | 0 | 0 | 0 | 0 | 0 | 0 | 0 | 0 | 0 | 0 | ||||
| Output for own final use | P12 | 5 | 5 | 5 | 5 | 6 | 6 | 6 | 6 | 6 | 6 | 6 | 6 | 6 | ||||
| Non-market output | P13 | 9,026 | 9,359 | 9,658 | 9,651 | 9,722 | 10,143 | 10,359 | 10,558 | 10,287 | 11,112 | 11,322 | 11,851 | 11,118 | ||||
| = Non-market compensation of employees | D1_nonmarket | 5,447 | 5,539 | 5,526 | 5,590 | 5,721 | 5,925 | 5,745 | 6,022 | 6,026 | 6,116 | 5,977 | 6,502 | 6,085 | ||||
| = Total compensation of employees | D1 | 5,453 | 5,544 | 5,532 | 5,596 | 5,727 | 5,930 | 5,750 | 6,027 | 6,032 | 6,122 | 5,983 | 6,508 | 6,091 | ||||
| - Compensation of employees of market establishments | D1_market | 0 | 0 | 0 | 0 | 0 | 0 | 0 | 0 | 0 | 0 | 0 | 0 | 0 | ||||
| - Compensation related to production of own-use capital assets | D1_own-use | -5 | -5 | -5 | -5 | -6 | -6 | -6 | -6 | -6 | -6 | -6 | -6 | -6 | ||||
| + Non-market intermediate consumption | P2_nonmarket | 2,485 | 2,727 | 3,037 | 2,967 | 2,817 | 3,034 | 3,430 | 3,353 | 3,000 | 3,734 | 4,083 | 4,087 | 3,771 | ||||
| = Total intermediate consumption | P2 | 2,485 | 2,727 | 3,037 | 2,967 | 2,817 | 3,034 | 3,430 | 3,353 | 3,000 | 3,734 | 4,083 | 4,087 | 3,771 | ||||
| - Intermediate consumption of market establishments | P2_market | 0 | 0 | 0 | 0 | 0 | 0 | 0 | 0 | 0 | 0 | 0 | 0 | 0 | ||||
| - Intermediate consumption related to production of own-use capital assets | P2_own-use | 0 | 0 | 0 | 0 | 0 | 0 | 0 | 0 | 0 | 0 | 0 | 0 | 0 | ||||
| + Non-market consumption of fixed capital | P51c_nonmarket | 1,094 | 1,094 | 1,094 | 1,094 | 1,184 | 1,184 | 1,184 | 1,184 | 1,262 | 1,262 | 1,262 | 1,262 | 1,262 | ||||
| = Total consumption of fixed capital | P51c | 1,094 | 1,094 | 1,094 | 1,094 | 1,184 | 1,184 | 1,184 | 1,184 | 1,262 | 1,262 | 1,262 | 1,262 | 1,262 | ||||
| - Consumption of fixed capital by market establishments | P51c_market | 0 | 0 | 0 | 0 | 0 | 0 | 0 | 0 | 0 | 0 | 0 | 0 | 0 | ||||
| - Consumption of fixed capital related to production of own-use capital assets | P51c_own-use | 0 | 0 | 0 | 0 | 0 | 0 | 0 | 0 | 0 | 0 | 0 | 0 | 0 | ||||
| + Other taxes on production, payable | D29_pay | 0 | 0 | 0 | 0 | 0 | 0 | 0 | 0 | 0 | 0 | 0 | 0 | 0 | ||||
| - Other subsidies on production, receivable | D39_rec | 0 | 0 | 0 | 0 | 0 | 0 | 0 | 0 | 0 | 0 | 0 | 0 | 0 | ||||
| Table 4 General Government: detailed classification of expenditure and consumption | ||||||||||||||||||
| €million | ||||||||||||||||||
| Description | ESA2010 code | 2018 Q1 | 2018 Q2 | 2018 Q3 | 2018 Q4 | 2019 Q1 | 2019 Q2 | 2019 Q3 | 2019 Q4 | 2020 Q1 | 2020 Q2 | 2020 Q3 | 2020 Q4 | 2021 Q1 | ||||
| Total Expenditure | TE | 19,667 | 20,494 | 20,551 | 22,310 | 21,015 | 20,942 | 21,743 | 23,360 | 21,529 | 27,357 | 26,646 | 27,755 | 26,304 | ||||
| Expense | 19,028 | 19,779 | 20,086 | 21,538 | 20,053 | 20,064 | 20,981 | 22,364 | 20,639 | 26,482 | 25,229 | 26,895 | 25,438 | |||||
| Compensation of employees | D1 | 5,453 | 5,544 | 5,532 | 5,596 | 5,727 | 5,930 | 5,750 | 6,027 | 6,032 | 6,122 | 5,983 | 6,508 | 6,091 | ||||
| Of which: Related to production of own-use capital assets | 5 | 5 | 5 | 5 | 6 | 6 | 6 | 6 | 6 | 6 | 6 | 6 | 6 | |||||
| Use of goods and services plus taxes payable | P2 + D5 + D29 | 2,485 | 2,727 | 3,037 | 2,967 | 2,817 | 3,034 | 3,430 | 3,353 | 3,000 | 3,734 | 4,083 | 4,087 | 3,771 | ||||
| Use of goods and services [Intermediate consumption] | P2 | 2,485 | 2,727 | 3,037 | 2,967 | 2,817 | 3,034 | 3,430 | 3,353 | 3,000 | 3,734 | 4,083 | 4,087 | 3,771 | ||||
| Of which: Intermediate consumption of market establishments | 0 | 0 | 0 | 0 | 0 | 0 | 0 | 0 | 0 | 0 | 0 | 0 | 0 | |||||
| Taxes, payable | D5 | 0 | 0 | 0 | 0 | 0 | 0 | 0 | 0 | 0 | 0 | 0 | 0 | 0 | ||||
| Depreciation (Consumption of fixed capital) | P51c | 1,094 | 1,094 | 1,094 | 1,094 | 1,184 | 1,184 | 1,184 | 1,184 | 1,262 | 1,262 | 1,262 | 1,262 | 1,262 | ||||
| Of which: Depreciation by market establishments | 0 | 0 | 0 | 0 | 0 | 0 | 0 | 0 | 0 | 0 | 0 | 0 | 0 | |||||
| Interest (excluding FISIM) | D41 | 1,392 | 1,333 | 1,348 | 1,244 | 1,201 | 1,228 | 1,120 | 1,083 | 1,040 | 950 | 977 | 872 | 828 | ||||
| Other domestic interest payable | D41_S1 | 528 | 459 | 482 | 454 | 398 | 434 | 363 | 434 | 484 | 424 | 503 | 414 | 153 | ||||
| Interest payable to rest of world | D41_S2 | 864 | 875 | 865 | 790 | 803 | 793 | 757 | 650 | 557 | 527 | 474 | 458 | 675 | ||||
| Subsidies | D3 | 418 | 436 | 458 | 635 | 374 | 392 | 413 | 554 | 471 | 2,185 | 1,719 | 1,713 | 1,604 | ||||
| Product subsidies | D31 | 221 | 240 | 261 | 271 | 220 | 239 | 259 | 270 | 280 | 306 | 289 | 311 | 242 | ||||
| Other subsidies on production | D39 | 197 | 196 | 197 | 364 | 154 | 153 | 154 | 284 | 191 | 1,879 | 1,430 | 1,402 | 1,362 | ||||
| Social benefits | D62 + D632 | 6,805 | 6,919 | 7,485 | 8,188 | 7,067 | 7,202 | 7,814 | 8,561 | 7,277 | 10,456 | 9,780 | 10,619 | 9,964 | ||||
| Social benefits in cash | D62 | 5,805 | 5,596 | 5,547 | 6,423 | 6,006 | 5,792 | 5,742 | 6,638 | 6,156 | 8,980 | 7,642 | 8,616 | 8,856 | ||||
| Social benefits in kind (via market producers) | D632 | 1,000 | 1,323 | 1,938 | 1,765 | 1,061 | 1,410 | 2,072 | 1,924 | 1,121 | 1,477 | 2,138 | 2,003 | 1,108 | ||||
| Other current transfers | D7 | 982 | 985 | 793 | 1,037 | 1,300 | 669 | 959 | 824 | 1,080 | 1,256 | 897 | 1,133 | 1,442 | ||||
| Net non-life insurance premiums | D71 | 17 | 17 | 17 | 17 | 19 | 19 | 19 | 19 | 21 | 21 | 21 | 21 | 21 | ||||
| Current international cooperation | D74 | 88 | 124 | 136 | 193 | 113 | 122 | 127 | 168 | 86 | 168 | 141 | 115 | 96 | ||||
| Miscellaneous current transfers | D75 | 215 | 236 | 163 | 198 | 207 | 202 | 200 | 261 | 165 | 415 | 340 | 245 | 296 | ||||
| VAT and GNI based EU budget contribution | D76 | 661 | 608 | 477 | 629 | 961 | 325 | 612 | 375 | 809 | 653 | 396 | 752 | 1,030 | ||||
| VAT-based EU own resources | D761 | 75 | 43 | 62 | 65 | 109 | 54 | 69 | 46 | 91 | 77 | 48 | 59 | 98 | ||||
| GNI-based EU own resources | D762 | 585 | 565 | 414 | 565 | 851 | 271 | 543 | 330 | 718 | 575 | 348 | 694 | 932 | ||||
| Capital transfers | D9 | 399 | 741 | 339 | 778 | 383 | 424 | 311 | 777 | 478 | 517 | 528 | 702 | 476 | ||||
| Investment grants | D92 | 391 | 521 | 332 | 770 | 378 | 419 | 306 | 772 | 478 | 500 | 450 | 702 | 476 | ||||
| Other capital transfers | D99 | 8 | 220 | 7 | 7 | 6 | 5 | 5 | 5 | 0 | 17 | 79 | 0 | 0 | ||||
| Net acquisition of non-financial assets | P5 + NP - P51c | 639 | 715 | 465 | 772 | 962 | 879 | 762 | 996 | 890 | 875 | 1,417 | 861 | 866 | ||||
| = Gross investment in non-financial assets | P5 + NP | 1,733 | 1,809 | 1,559 | 1,865 | 2,146 | 2,063 | 1,946 | 2,181 | 2,151 | 2,137 | 2,679 | 2,122 | 2,128 | ||||
| Gross fixed capital formation | P51 | 1,718 | 1,794 | 1,544 | 1,850 | 2,131 | 2,048 | 2,071 | 2,166 | 2,136 | 2,122 | 2,664 | 2,107 | 2,113 | ||||
| Net acquisition of stocks | P52 | 15 | 15 | 15 | 15 | 15 | 15 | 15 | 15 | 15 | 15 | 15 | 15 | 15 | ||||
| Net acquisition of unproduced assets | NP | 0 | 0 | 0 | 0 | 0 | 0 | -140 | 0 | 0 | 0 | 0 | 0 | 0 | ||||
| - Consumption of fixed capital | P51c | -1,094 | -1,094 | -1,094 | -1,094 | -1,184 | -1,184 | -1,184 | -1,184 | -1,262 | -1,262 | -1,262 | -1,262 | -1,262 | ||||
| Net expenditure on current goods and services | P3 excl. D632 | 7,977 | 8,148 | 8,439 | 8,223 | 8,677 | 8,937 | 9,146 | 9,136 | 9,178 | 10,201 | 10,255 | 10,781 | 10,190 | ||||
| = Output | P1 | 9,031 | 9,365 | 9,663 | 9,656 | 9,728 | 10,149 | 10,365 | 10,564 | 10,293 | 11,118 | 11,327 | 11,856 | 11,123 | ||||
| - Sales of goods and services | P11+P12+P131 | -1,055 | -1,216 | -1,224 | -1,433 | -1,051 | -1,212 | -1,219 | -1,428 | -1,115 | -917 | -1,073 | -1,075 | -934 | ||||
| Market output (sales of market establishments) | P11 | 0 | 0 | 0 | 0 | 0 | 0 | 0 | 0 | 0 | 0 | 0 | 0 | 0 | ||||
| Output for own final use | P12 | -5 | -5 | -5 | -5 | -6 | -6 | -6 | -6 | -6 | -6 | -6 | -6 | -6 | ||||
| Incidental sales and fees of non-market establishments | P131 | -1,049 | -1,211 | -1,218 | -1,428 | -1,045 | -1,206 | -1,214 | -1,422 | -1,110 | -911 | -1,067 | -1,069 | -928 | ||||
| Final consumption expenditure | P3 | 8,977 | 9,471 | 10,377 | 9,988 | 9,738 | 10,348 | 11,217 | 11,060 | 10,299 | 11,678 | 12,393 | 12,785 | 11,298 | ||||
| = Net expenditure on current goods and services | P3 excl. D632 | 7,977 | 8,148 | 8,439 | 8,223 | 8,677 | 8,937 | 9,146 | 9,136 | 9,178 | 10,201 | 10,255 | 10,781 | 10,190 | ||||
| + Social transfers in kind via market producers | D632 | 1,000 | 1,323 | 1,938 | 1,765 | 1,061 | 1,410 | 2,072 | 1,924 | 1,121 | 1,477 | 2,138 | 2,003 | 1,108 | ||||
| made up of | ||||||||||||||||||
| Individual consumption (= social transfers in kind) | P31 (= D63) | 5,987 | 6,413 | 6,927 | 6,664 | 6,528 | 6,951 | 7,528 | 7,442 | 7,267 | 7,737 | 8,380 | 8,283 | 6,859 | ||||
| Social transfers in kind (via market producers) | D632 | 1,000 | 1,323 | 1,938 | 1,765 | 1,061 | 1,410 | 2,072 | 1,924 | 1,121 | 1,477 | 2,138 | 2,003 | 1,108 | ||||
| Social transfers in kind (provided directly by government) | D631 | 4,986 | 5,089 | 4,990 | 4,900 | 5,467 | 5,541 | 5,456 | 5,518 | 6,146 | 6,260 | 6,242 | 6,280 | 5,751 | ||||
| Collective consumption (= actual final consumption of government) | P32 | 2,990 | 3,059 | 3,449 | 3,323 | 3,210 | 3,397 | 3,689 | 3,618 | 3,032 | 3,941 | 4,013 | 4,502 | 4,439 | ||||
| Total social transfers | D62 + D63 | 11,792 | 12,008 | 12,474 | 13,088 | 12,534 | 12,743 | 13,270 | 14,080 | 13,423 | 16,717 | 16,022 | 16,899 | 15,714 | ||||
| Social benefits in cash | D62 | 5,805 | 5,596 | 5,547 | 6,423 | 6,006 | 5,792 | 5,742 | 6,638 | 6,156 | 8,980 | 7,642 | 8,616 | 8,856 | ||||
| Social transfers in kind (= individual consumption) | D63 | 5,987 | 6,413 | 6,927 | 6,664 | 6,528 | 6,951 | 7,528 | 7,442 | 7,267 | 7,737 | 8,380 | 8,283 | 6,859 | ||||
| Table 5 General Government financial transactions | ||||||||||||||||||
| €million | ||||||||||||||||||
| Description | 2018Q1 | 2018Q2 | 2018Q3 | 2018Q4 | 2019Q1 | 2019Q2 | 2019Q3 | 2019Q4 | 2020Q1 | 2020Q2 | 2020Q3 | 2020Q4 | 2021Q1 | |||||
| Net lending (+) / net borrowing (-) | B.9 | -1,765 | -266 | -1,679 | 3,770 | -2,131 | 714 | -1,217 | 3,705 | -3,608 | -6,228 | -6,654 | -2,269 | -6,826 | ||||
| equals | ||||||||||||||||||
| Net acquisition of financial assets | ΔA | 7,063 | 8,131 | 10,501 | -8,417 | 7,859 | -177 | -415 | -7,118 | 3,299 | 7,977 | -2,620 | -11,798 | 4,893 | ||||
| EDP debt instruments | F2 + F3 + F4 | 7528 | 4777 | 429 | -9740 | 8128 | 1818 | -575 | -9232 | 6925 | 8255 | -2977 | -12951 | 7150 | ||||
| Currency and deposits | F2 | 7,535 | 5,011 | 165 | -8,387 | 8,247 | 1,942 | -95 | -7,819 | 7,265 | 8,525 | -2,948 | -13,019 | 8,353 | ||||
| Debt securities | F3 | -43 | 2 | 247 | -341 | 235 | -130 | -178 | -80 | -55 | -85 | -29 | 50 | -913 | ||||
| Short-term | F31 | -44 | -89 | 70 | -32 | 44 | -63 | 120 | -209 | -27 | -52 | -44 | -50 | -16 | ||||
| Long-term | F32 | 1 | 91 | 177 | -309 | 191 | -67 | -298 | 129 | -28 | -33 | 15 | 100 | -897 | ||||
| Loans | F4 | 36 | -236 | 17 | -1,012 | -354 | 6 | -302 | -1,333 | -285 | -185 | 0 | 18 | -290 | ||||
| Short-term loans | F41 | -107 | -117 | 2 | -4 | -215 | 57 | -196 | -162 | 79 | 96 | -68 | -6 | -180 | ||||
| Long-term loans | F42 | 143 | -119 | 15 | -1,008 | -139 | -51 | -106 | -1,171 | -364 | -281 | 68 | 24 | -110 | ||||
| Equity and Investment Fund Shares | F5 | 240 | -1,359 | 3 | -122 | -14 | -2,465 | -87 | 215 | -17 | -1,153 | -138 | 15 | 242 | ||||
| Other financial assets | F6 + F7 + F8 | -705 | 4,713 | 10,069 | 1,445 | -255 | 470 | 247 | 1,899 | -3,609 | 875 | 495 | 1,138 | -2,499 | ||||
| Insurance, Pensions and Standardised Guarantees | F6 | 0 | 0 | 0 | 0 | 0 | 0 | 0 | 1 | 0 | 0 | 0 | 1 | 0 | ||||
| Financial derivatives and Employee Stock Options | F7 | -67 | -34 | -28 | -36 | -29 | -37 | -39 | -22 | -20 | -41 | -142 | -100 | -18 | ||||
| Other accounts receivable/payable | F8 | -638 | 4,747 | 10,097 | 1,481 | -226 | 507 | 286 | 1,920 | -3,589 | 916 | 637 | 1,237 | -2,481 | ||||
| less | ||||||||||||||||||
| Net incurrence of liabilities | ΔL | 8,828 | 8,397 | 12,180 | -12,187 | 9,990 | -891 | 802 | -10,823 | 6,907 | 14,205 | 4,034 | -9,529 | 11,719 | ||||
| EDP debt instruments | F2 + F3 + F4 | 8,864 | 3,673 | 2,529 | -12,462 | 10,009 | -906 | 702 | -11,082 | 6,729 | 13,811 | 3,843 | -9,918 | 11,850 | ||||
| Currency and deposits | F2 | 18 | -32 | 21 | 41 | 164 | 152 | 106 | 150 | 293 | 388 | 368 | 453 | 564 | ||||
| Debt securities | F3 | 8,233 | 3,652 | 2,468 | -12,275 | 9,333 | -659 | 1,467 | -10,394 | 6,526 | 13,912 | 4,082 | -9,931 | 8,541 | ||||
| Short-term | F31 | 3,256 | 417 | -492 | -3,089 | 3,658 | 1,191 | -817 | -3,741 | 5,242 | 8,931 | -1,488 | -6,346 | 2,664 | ||||
| Long-term | F32 | 4,977 | 3,235 | 2,960 | -9,186 | 5,675 | -1,850 | 2,284 | -6,653 | 1,284 | 4,981 | 5,570 | -3,585 | 5,877 | ||||
| Loans | F4 | 613 | 53 | 40 | -228 | 512 | -399 | -871 | -838 | -90 | -489 | -607 | -440 | 2,745 | ||||
| Short-term loans | F41 | 396 | 364 | -338 | -248 | 241 | 58 | -265 | -377 | 209 | -57 | -58 | 25 | 322 | ||||
| Long-term loans | F42 | 217 | -311 | 378 | 20 | 271 | -457 | -606 | -461 | -299 | -432 | -549 | -465 | 2,423 | ||||
| Other liabilities | F5 + F6 + F7 + F8 | -36 | 4,724 | 9,651 | 275 | -19 | 15 | 100 | 259 | 178 | 394 | 191 | 389 | -131 | ||||
| Equity and Investment Fund Shares | F5 | 0 | 0 | 0 | 0 | 0 | 0 | 0 | 0 | 0 | 0 | 0 | 0 | 0 | ||||
| Insurance, Pensions and Standardised Guarantees | F6 | 0 | 0 | 0 | 1 | 0 | 0 | 0 | 1 | 0 | 0 | 0 | 92 | 0 | ||||
| Financial derivatives and Employee Stock Options | F7 | -2 | 4 | -1 | 1 | 3 | -2 | 3 | -1 | 1 | -3 | -4 | -1 | 2 | ||||
| Other accounts receivable/payable | F8 | -34 | 4,720 | 9,652 | 273 | -22 | 17 | 97 | 259 | 177 | 397 | 195 | 298 | -133 | ||||
| Table 6 General Government: detailed breakdown of net worth | ||||||||||||||||||||
| €million | ||||||||||||||||||||
| Description | ESA2010 code | 2018 Q1 | 2018 Q2 | 2018 Q3 | 2018 Q4 | 2019 Q1 | 2019 Q2 | 2019 Q3 | 2019 Q4 | 2020 Q1 | 2020 Q2 | 2020 Q3 | 2020 Q4 | 2021 Q1 | ||||||
| General Government balance sheet | ||||||||||||||||||||
| Net worth at market value, excluding pension liabilities | NW | -27,515 | -27,154 | -26,690 | -23,041 | -21,812 | -19,331 | -19,818 | -9,692 | -18,639 | -19,786 | -23,507 | -24,081 | -24,385 | ||||||
| equals | ||||||||||||||||||||
| Non-financial assets at market value | NFA | 122,204 | 124,473 | 126,491 | 128,816 | 132,012 | 135,124 | 138,120 | 141,350 | 143,401 | 145,437 | 148,015 | 150,036 | 150,902 | ||||||
| plus | ||||||||||||||||||||
| Financial net worth at market value, excluding pension liabilities | FNW | -149,719 | -151,627 | -153,181 | -151,857 | -153,824 | -154,455 | -157,938 | -151,042 | -162,040 | -165,223 | -171,522 | -174,117 | -175,287 | ||||||
| equals | ||||||||||||||||||||
| Financial assets at market value | FA | 86,572 | 93,082 | 101,917 | 91,817 | 102,830 | 101,950 | 99,382 | 94,555 | 93,412 | 104,856 | 102,103 | 92,858 | 99,842 | ||||||
| EDP debt instruments | F2 + F3 + F4 | 32,980 | 37,802 | 38,236 | 28,483 | 36,657 | 38,502 | 37,927 | 28,637 | 35,503 | 47,087 | 44,080 | 31,107 | 38,267 | ||||||
| Currency and deposits | F2 | 24,711 | 29,739 | 29,907 | 21,524 | 29,776 | 31,717 | 31,629 | 23,806 | 31,073 | 41,841 | 38,873 | 25,843 | 34,219 | ||||||
| Debt securities | F3 | 1,611 | 1,638 | 1,879 | 1,525 | 1,809 | 1,686 | 1,539 | 1,431 | 1,347 | 1,294 | 1,269 | 1,327 | 388 | ||||||
| Short-term | F31 | 383 | 288 | 355 | 318 | 359 | 291 | 414 | 196 | 166 | 115 | 77 | 38 | 4 | ||||||
| Long-term | F32 | 1,229 | 1,350 | 1,524 | 1,207 | 1,450 | 1,395 | 1,125 | 1,234 | 1,181 | 1,178 | 1,192 | 1,289 | 384 | ||||||
| Loans | F4 | 6,658 | 6,425 | 6,450 | 5,434 | 5,072 | 5,099 | 4,759 | 3,400 | 3,083 | 3,952 | 3,938 | 3,937 | 3,660 | ||||||
| Short-term loans | F41 | 803 | 686 | 688 | 684 | 469 | 526 | 330 | 168 | 247 | 343 | 276 | 269 | 89 | ||||||
| Long-term loans | F42 | 5,855 | 5,739 | 5,762 | 4,750 | 4,603 | 4,573 | 4,428 | 3,232 | 2,836 | 3,609 | 3,662 | 3,668 | 3,571 | ||||||
| Equity and Investment Fund Shares | F5 | 43,253 | 40,153 | 38,462 | 36,627 | 39,890 | 36,567 | 34,696 | 37,417 | 32,972 | 31,675 | 31,282 | 33,894 | 35,953 | ||||||
| Other financial assets | F6 + F7 + F8 | 10,339 | 15,127 | 25,219 | 26,707 | 26,283 | 26,881 | 26,759 | 28,501 | 24,937 | 26,094 | 26,741 | 27,857 | 25,622 | ||||||
| Insurance, Pensions and Standardised Guarantees | F6 | 0 | 0 | 0 | 0 | 0 | 0 | 0 | 1 | 1 | 1 | 1 | 2 | 2 | ||||||
| Financial derivatives and Employee Stock Options | F7 | 317 | 358 | 353 | 387 | 213 | 278 | 91 | 6 | 94 | 269 | 279 | 201 | 0 | ||||||
| Other accounts receivable/payable | F8 | 10,022 | 14,769 | 24,866 | 26,320 | 26,070 | 26,603 | 26,668 | 28,494 | 24,842 | 25,824 | 26,461 | 27,654 | 25,620 | ||||||
| less | ||||||||||||||||||||
| Liabilities at market value | L | 236,291 | 244,709 | 255,098 | 243,674 | 256,654 | 256,405 | 257,320 | 245,597 | 255,452 | 270,079 | 273,625 | 266,975 | 275,129 | ||||||
| EDP debt instruments | F2 + F3 + F4 | 226,309 | 229,943 | 230,771 | 219,158 | 232,230 | 232,047 | 233,081 | 221,235 | 231,007 | 245,187 | 248,573 | 241,562 | 249,353 | ||||||
| Currency and deposits | F2 | 21,618 | 21,586 | 21,607 | 21,648 | 21,812 | 21,965 | 22,070 | 22,220 | 22,513 | 22,901 | 23,269 | 23,721 | 24,285 | ||||||
| Debt securities | F3 | 153,927 | 157,542 | 158,388 | 146,997 | 159,122 | 159,236 | 160,983 | 149,903 | 159,488 | 173,767 | 177,431 | 170,347 | 174,889 | ||||||
| Short-term | F31 | 6,210 | 6,755 | 6,251 | 3,092 | 6,751 | 7,823 | 7,096 | 3,348 | 8,602 | 17,365 | 15,696 | 9,305 | 12,132 | ||||||
| Long-term | F32 | 147,717 | 150,787 | 152,137 | 143,904 | 152,371 | 151,413 | 153,886 | 146,555 | 150,886 | 156,402 | 161,735 | 161,042 | 162,757 | ||||||
| Loans | F4 | 50,764 | 50,815 | 50,776 | 50,513 | 51,296 | 50,846 | 50,028 | 49,112 | 49,006 | 48,519 | 47,873 | 47,494 | 50,179 | ||||||
| Short-term loans | F41 | 941 | 1,345 | 972 | 681 | 983 | 1,099 | 808 | 335 | 582 | 533 | 432 | 502 | 820 | ||||||
| Long-term loans | F42 | 49,822 | 49,470 | 49,804 | 49,831 | 50,312 | 49,747 | 49,220 | 48,778 | 48,424 | 47,987 | 47,442 | 46,992 | 49,359 | ||||||
| Other liabilities | F5 + F6 + F7 + F8 | 9,982 | 14,766 | 24,327 | 24,516 | 24,424 | 24,358 | 24,239 | 24,362 | 24,445 | 24,892 | 25,052 | 25,413 | 25,776 | ||||||
| Equity and Investment Fund Shares | F5 | 0 | 0 | 0 | 0 | 0 | 0 | 0 | 0 | 0 | 0 | 0 | 0 | 0 | ||||||
| Insurance, Pensions and Standardised Guarantees | F6 | 4 | 4 | 4 | 4 | 4 | 4 | 4 | 5 | 5 | 5 | 5 | 97 | 97 | ||||||
| Financial derivatives and Employee Stock Options | F7 | 515 | 579 | 489 | 405 | 359 | 250 | 255 | 178 | 147 | 122 | 88 | 68 | 93 | ||||||
| Other accounts receivable/payable | F8 | 9,463 | 14,183 | 23,834 | 24,107 | 24,061 | 24,104 | 23,980 | 24,179 | 24,293 | 24,765 | 24,959 | 25,248 | 25,586 | ||||||
| Memo: Estimated pension liabilities of government | 114,500 | 114,500 | 114,500 | 149,600 | 149,600 | 149,600 | 149,600 | 149,600 | 149,600 | 149,600 | 149,600 | 149,600 | 149,600 | |||||||
| Memo: Net worth, including pension liabilities | -142,015 | -141,654 | -141,190 | -172,641 | -171,412 | -168,931 | -169,418 | -159,292 | -168,239 | -169,386 | -173,107 | -173,681 | -173,985 | |||||||
| Contingent liabilities | 5,066 | 5,066 | 5,066 | 5,066 | 5,314 | 5,314 | 5,314 | 5,314 | 6,182 | 6,182 | 6,182 | 6,182 | 6,182 | |||||||
| Guarantees | 7 | 7 | 7 | 7 | 7 | 7 | 7 | 7 | 656 | 656 | 656 | 656 | 656 | |||||||
| Off-balance sheet PPPs and concessions | 5,059 | 5,059 | 5,059 | 5,059 | 5,307 | 5,307 | 5,307 | 5,307 | 5,526 | 5,526 | 5,526 | 5,526 | 5,526 | |||||||
| Memo: Net worth, including pension liabilities and contingent liabilities | -147,080 | -146,720 | -146,256 | -177,707 | -176,726 | -174,245 | -174,732 | -164,606 | -174,421 | -175,569 | -179,290 | -179,863 | -180,167 | |||||||
| Change in net worth of government | ||||||||||||||||||||
| Opening net worth | -28,886 | -27,515 | -27,154 | -26,690 | -23,041 | -21,812 | -19,331 | -19,818 | -9,692 | -18,639 | -19,786 | -23,507 | -24,081 | |||||||
| Change in net worth due to transactions | -1,125 | 450 | -1,213 | 4,542 | -1,169 | 1,592 | -455 | 4,702 | -2,719 | -5,353 | -5,237 | -1,409 | -5,959 | |||||||
| Net acquisition of non-financial assets | P5 + NP - P51c | 639 | 715 | 465 | 772 | 962 | 879 | 762 | 996 | 890 | 875 | 1,417 | 861 | 866 | ||||||
| Net lending/net borrowing | B9 | -1,765 | -266 | -1,679 | 3,770 | -2,131 | 714 | -1,217 | 3,705 | -3,608 | -6,228 | -6,654 | -2,269 | -6,826 | ||||||
| = Net acquisition of financial assets | 7,063 | 8,131 | 10,501 | -8,417 | 7,859 | -177 | -415 | -7,118 | 3,299 | 7,977 | -2,620 | -11,798 | 4,893 | |||||||
| - Net incurrence of liabilities | -8,828 | -8,397 | -12,180 | 12,187 | -9,990 | 891 | -802 | 10,823 | -6,907 | -14,205 | -4,034 | 9,529 | -11,719 | |||||||
| Change in net worth due to other economic flows | Kx | 2,497 | -89 | 1,678 | -893 | 2,398 | 889 | -32 | 5,425 | -6,229 | 4,206 | 1,516 | 835 | 5,656 | ||||||
| Other changes in non-financial assets | 1,553 | 1,553 | 1,553 | 1,553 | 2,234 | 2,234 | 2,234 | 2,234 | 1,161 | 1,161 | 1,161 | 1,161 | 0 | |||||||
| Other changes in financial net worth | 944 | -1,642 | 125 | -2,446 | 164 | -1,345 | -2,266 | 3,191 | -7,390 | 3,045 | 355 | -326 | 5,656 | |||||||
| = Other changes in financial assets | 116 | -1,621 | -1,666 | -1,683 | 3,154 | -703 | -2,153 | 2,291 | -4,442 | 3,467 | -133 | 2,553 | 2,091 | |||||||
| EDP debt instruments | -120 | 45 | 5 | -13 | 46 | 27 | 0 | -58 | -59 | 3,329 | -30 | -22 | 10 | |||||||
| Equity and Investment Fund Shares | 260 | -1,741 | -1,694 | -1,713 | 3,277 | -858 | -1,784 | 2,506 | -4,428 | -144 | -255 | 2,597 | 1,817 | |||||||
| Other financial assets | -24 | 75 | 23 | 43 | -169 | 128 | -369 | -157 | 45 | 282 | 152 | -22 | 264 | |||||||
| - Other changes in liabilities | 828 | -21 | 1,791 | -763 | -2,990 | -642 | -113 | 900 | -2,948 | -422 | 488 | -2,879 | 3,565 | |||||||
| EDP debt instruments | 788 | 39 | 1,701 | -849 | -3,063 | -723 | -332 | 764 | -3,043 | -369 | 457 | -2,907 | 4,059 | |||||||
| Other liabilities | 40 | -60 | 90 | 86 | 73 | 81 | 219 | 136 | 95 | -53 | 31 | 28 | -494 | |||||||
| Closing net worth | -27,515 | -27,154 | -26,690 | -23,041 | -21,812 | -19,331 | -19,818 | -9,692 | -18,639 | -19,786 | -23,507 | -24,081 | -24,385 | |||||||
| Table 7 General Government Gross and Net Debt | |||||||||||||||||
| €million | |||||||||||||||||
| Description | ESA2010 code | 2018 Q1 | 2018 Q2 | 2018 Q3 | 2018 Q4 | 2019 Q1 | 2019 Q2 | 2019 Q3 | 2019 Q4 | 2020 Q1 | 2020 Q2 | 2020 Q3 | 2020 Q4 | 2021 Q1 | |||
| General Government Debt | |||||||||||||||||
| Debt instrument liabilities at market value | 226,309 | 229,943 | 230,771 | 219,158 | 232,230 | 232,047 | 233,081 | 221,235 | 231,007 | 245,187 | 248,573 | 241,562 | 249,353 | ||||
| + Difference between face value and market value | -16,094 | -15,444 | -15,096 | -13,311 | -17,198 | -18,259 | -20,017 | -17,254 | -17,311 | -19,354 | -21,328 | -23,650 | -18,886 | ||||
| Gross General Government Debt (face value) | GGDebt | 210,215 | 214,499 | 215,675 | 205,847 | 215,032 | 213,788 | 213,064 | 203,981 | 213,696 | 225,833 | 227,245 | 217,912 | 230,467 | |||
| By category: | |||||||||||||||||
| Currency and deposits | F2 | 21,618 | 21,586 | 21,607 | 21,648 | 21,812 | 21,965 | 22,070 | 22,220 | 22,513 | 22,901 | 23,269 | 23,721 | 24,285 | |||
| Debt securities | F3 | 138,277 | 142,638 | 143,813 | 134,231 | 142,569 | 141,546 | 141,820 | 133,566 | 143,178 | 155,026 | 156,766 | 147,425 | 157,014 | |||
| Short-term | F31 | 6,206 | 6,749 | 6,235 | 3,084 | 6,743 | 7,903 | 7,098 | 3,352 | 8,605 | 17,357 | 15,694 | 9,299 | 12,132 | |||
| Long-term | F32 | 132,070 | 135,889 | 137,578 | 131,147 | 135,827 | 133,643 | 134,722 | 130,214 | 134,573 | 137,669 | 141,072 | 138,126 | 144,883 | |||
| Loans | F4 | 50,321 | 50,275 | 50,255 | 49,968 | 50,651 | 50,278 | 49,174 | 48,195 | 48,005 | 47,907 | 47,211 | 46,766 | 49,167 | |||
| Short-term | F41 | 941 | 1,345 | 972 | 681 | 983 | 1,099 | 808 | 334 | 582 | 533 | 432 | 502 | 820 | |||
| Long-term | F42 | 49,380 | 48,930 | 49,284 | 49,287 | 49,668 | 49,179 | 48,366 | 47,861 | 47,423 | 47,374 | 46,779 | 46,264 | 48,346 | |||
| less EDP debt instrument assets | F2 + F3 + F4 | 32,980 | 37,802 | 38,236 | 28,483 | 36,657 | 38,502 | 37,927 | 28,637 | 35,503 | 47,087 | 44,080 | 31,107 | 38,267 | |||
| By category: | |||||||||||||||||
| Currency and deposits | F2 | 24,711 | 29,739 | 29,907 | 21,524 | 29,776 | 31,717 | 31,629 | 23,806 | 31,073 | 41,841 | 38,873 | 25,843 | 34,219 | |||
| Debt securities | F3 | 1,611 | 1,638 | 1,879 | 1,525 | 1,809 | 1,686 | 1,539 | 1,431 | 1,347 | 1,294 | 1,269 | 1,327 | 388 | |||
| Short-term | F31 | 383 | 288 | 355 | 318 | 359 | 291 | 414 | 196 | 166 | 115 | 77 | 38 | 4 | |||
| Long-term | F32 | 1,229 | 1,350 | 1,524 | 1,207 | 1,450 | 1,395 | 1,125 | 1,234 | 1,181 | 1,178 | 1,192 | 1,289 | 384 | |||
| Loans | F4 | 6,658 | 6,425 | 6,450 | 5,434 | 5,072 | 5,099 | 4,759 | 3,400 | 3,083 | 3,952 | 3,938 | 3,937 | 3,660 | |||
| Short-term | F41 | 803 | 686 | 688 | 684 | 469 | 526 | 330 | 168 | 247 | 343 | 276 | 269 | 89 | |||
| Long-term | F42 | 5,855 | 5,739 | 5,762 | 4,750 | 4,603 | 4,573 | 4,428 | 3,232 | 2,836 | 3,609 | 3,662 | 3,668 | 3,571 | |||
| Net General Government Debt (face value) | GGNetDebt | 177,235 | 176,697 | 177,439 | 177,364 | 178,375 | 175,286 | 175,137 | 175,344 | 178,193 | 178,746 | 183,165 | 186,805 | 192,200 | |||
| By category: | |||||||||||||||||
| Currency and deposits | F2 | -3,093 | -8,153 | -8,300 | 124 | -7,964 | -9,752 | -9,559 | -1,586 | -8,560 | -18,940 | -15,604 | -2,122 | -9,934 | |||
| Debt securities | F3 | 136,666 | 141,000 | 141,934 | 132,706 | 140,760 | 139,860 | 140,281 | 132,135 | 141,831 | 153,732 | 155,497 | 146,098 | 156,626 | |||
| Short-term | F31 | 5,823 | 6,461 | 5,880 | 2,766 | 6,384 | 7,612 | 6,684 | 3,156 | 8,439 | 17,242 | 15,617 | 9,261 | 12,128 | |||
| Long-term | F32 | 130,841 | 134,539 | 136,054 | 129,940 | 134,377 | 132,248 | 133,597 | 128,980 | 133,392 | 136,491 | 139,880 | 136,837 | 144,499 | |||
| Loans | F4 | 43,663 | 43,850 | 43,805 | 44,534 | 45,579 | 45,179 | 44,415 | 44,795 | 44,922 | 43,955 | 43,273 | 42,829 | 45,507 | |||
| Short-term | F41 | 138 | 659 | 284 | -3 | 514 | 573 | 478 | 166 | 335 | 190 | 156 | 233 | 731 | |||
| Long-term | F42 | 43,525 | 43,191 | 43,522 | 44,537 | 45,065 | 44,606 | 43,938 | 44,629 | 44,587 | 43,765 | 43,117 | 42,596 | 44,775 | |||
This release comprises the latest official publication by CSO of quarterly Government Finance Statistics (GFS) for the period Q1 2018 to Q1 2021. The tables provide detailed revenue, expenditure and balance sheet data for general government. The full time series is available on CSO PxStat.
The data published in this series is aligned to the National Income and Expenditure 2020 (NIE) published on 15 July 2021 and the annual Government Income and Expenditure release, published on 16 July 2021.
The full suite of GFS publications is also available on the CSO Website.
Data for all EU Member States are available on Eurostat's database.
Social contributions (D.61):
The presentation of the components has been updated, with ‘Government employees' social contributions’ (D.613)(pt) re-labelled as ‘Government employee pension contributions’. This had previously included an element of PRSI contributions and has now been amended.
Depreciation (P.51c):
Revisions have been made to the P.51c data in line with the latest National Income and Expenditure Accounts published on 15 July 2021.
Reclassification of local authority housing rent as non market output
To date the provision of local authority housing was treated as a market output. This meant that the difference between the differential rent paid by the tenant and a market rent was calculated and included as P.11 (market output), with a corresponding imputed expenditure D.632 (social benefit in kind). However, Approved Housing Bodies (AHB) reclassified into the local government sector are considered as non-market producers, with no imputed rent calculation made.
On review, this approach was not appropriate and thus a decision has been made to treat the local authority housing output as non-market. This ensures consistency with AHBs. This determination means that there is no longer an imputed D.632 expenditure related to local authority rent. Local authority rent payments are now recorded as P.131 (incidental sales and fees of non-market establishments). This methodology has been applied from 1995.
COVID-19
A preliminary estimate of the full year impact of COVID-19 supports on expenditure for 2020 was published in the annual Government Finance Statistics, Table A. See the annual Government Income and Expenditure release of 16 July for details. Provisional details of Q1 COVID-19 expenditure are below:
| ESA 2010 Code | Measure | € billion |
|---|---|---|
| P2 | Health sector expenditure | 0.4 |
| D.39 | Employment Wage Subsidy Scheme | 1.2 |
| D.62 | Pandemic Unemployment Payment | 1.8 |
| D.7 | Covid Restrictions Support Scheme | 0.2 |
| D.7 | Education | 0.1 |
| Total Expenditure | 3.7 |
The value of the State's assets in Equity and Investment Fund Shares (AF.5, Table 6) stood at €36.0 billion, representing a net quarterly increase of €2.0 billion since Q4 2020. Over this period the rise in value was composed of further net acquisition of these assets of €0.2 billion (Table 5), together with holding gains of €1.8 billion (Tables 5 and 6), the majority of which were as a result of increases in the market value of Irish banks. The State’s cash holdings rose by €8.4 billion in Q1 2021 largely following increased debt security issuance and borrowing from the European Commission’s SURE facility.
The GDP and GNI* figures used in the current publication are consistent with those published in the latest National Income and Expenditure Accounts 2020 on 15 July 2021.
The population estimates used in calculating the debt per capita data in Figure 3 are the previous year's mid-April estimates of population except for the year 2017 where the 2016 census of population figure is used (see PXStat table PEA15: Annual Population Change by Component and Year).
GFS form the basis for fiscal monitoring in Europe, in particular in relation to the Excessive Deficit Procedure (EDP).
In addition to the legally binding accounting rules set out in ESA2010 the Manual on Government Debt and Deficit (MGDD) provides further implementation guidance in the context of GFS.
EU Member States are required to report government deficit/surplus and debt data biannually under the EDP - before 1 April and 1 October in year N, for years N-4 to N-1 calendar years, as well as a forecast for the current year. The data are reported in harmonised tables, which provide a consistent framework for the presentation of this data by Member States. The tables provide a structure for linking national budgetary aggregates with government deficit and debt.
In addition to the EDP transmission programme, detailed statistics on government revenue and expenditure are also provided to Eurostat under the ESA transmission programme. For quarterly data the main tables reported are:
Table 0801 Quarterly non-financial accounts by sector
Table 2500 Quarterly short term statistics (revenue and expenditure) for general government
Table 2700 Quarterly financial accounts for general government
Table 2800 Quarterly government debt (Maastricht debt) for general government
These data are available on the Eurostat website.
The general government sector of the economy, is defined in ESA2010 paragraph 2.111: as “institutional units which are non-market producers whose output is intended for individual and collective consumption, and are financed by compulsory payments made by units belonging to other sectors, and institutional units principally engaged in the redistribution of national income and wealth.” General government comprises the sub-sectors central government (S.1311), state government (S.1312 – which does not apply in Ireland), local government (S.1313), and social security funds (S.1314 – which does not apply in Ireland)
General government balance is the standard European measure of the fiscal balance, which is used to monitor compliance with the Stability and Growth Pact obligations.
This measure is by definition equal to both Total Revenue (TR) less Total Expenditure (TE), and Net Acquisition of Financial Assets less Net Incurrence of Liabilities as shown in the GFS release.
A listing of some of the main items included in this release is shown below.
General government gross debt (GG debt) is defined in the EU regulations implementing the Maastricht Treaty as the gross debt liabilities of the consolidated general government sector, at nominal value.
‘Gross’ means that the value of any financial assets held by general government cannot be deducted from the GG debt. In Ireland’s case, this means that the liquid assets which are deducted from the ‘Gross’ national debt in arriving at the audited national debt cannot be deducted from the GG debt.
‘Debt liabilities’ are defined as the ESA 2010 categories AF.2 (Currency and deposits), AF.3 (Debt securities), and AF.4 (Loans).
This definition excludes liabilities in derivatives, equity liabilities, pension and insurance liabilities and accounts payable.
‘Consolidated’ means that any money owed by one entity within general government to another is excluded from the total GG Debt.
‘Nominal value’ is defined in the governing regulation as face value. If debt is sold at a discount, it is the undiscounted value of the instrument, rather than the amount actually received, that is shown in the GG debt. In other statistical contexts, ‘nominal value’ means face value plus any interest accrued but not paid; however, such interest is excluded from GG Debt by definition.
General government net debt is a measure produced in accordance with the methodology of the IMF/World Bank Public Sector Debt Statistics Guide, by subtracting from the GG gross debt figure the value of the financial assets corresponding to the categories of financial liabilities which comprise GG gross debt.
General government net worth is calculated as the sum of financial and non-financial assets of general government less financial liabilities.
Detailed codes and technical definitions can be seen in the ESA 2010 manual.
A listing of some of the main items included in this release is shown below.
P.2 Intermediate consumption – value of goods and services used in the process of production, excluding fixed assets
P.5 Gross capital formation
P.51g Gross fixed capital formation - acquisitions, less disposals, of fixed assets during a given period plus certain additions to the value of non-produced assets realised by productive activity. Fixed assets are tangible or intangible assets produced as outputs from processes of production that are themselves used repeatedly, or continuously, in processes of production for more than one year
P.51c Consumption of fixed capital - the amount of fixed assets used up, during the period under consideration, as a result of normal wear and tear and foreseeable obsolescence, including a provision for losses of fixed assets as a result of accidental damage which can be insured against.
P.52 Changes in inventories
P.53 Acquisitions less disposals of valuables
D.1 Compensation of employees – the total remuneration of government employees
D.21 Taxes on products are taxes that are payable per unit of a given good or service produced or transacted. Included in this is customs and excise taxes and VAT. To accrue this data the cash receipts are time adjusted. Customs and excise taxes are time adjusted by 1 month and VAT is time adjusted by 2 months. For example Q1 VAT is March, April, May cash receipts.
D.29 Other taxes on production (payable) all taxes that enterprises incur as a result of engaging in production, independently of the quantity or value of the goods and services produced or sold. These include taxes on use or ownership of land or buildings, taxes on use of fixed assets, taxes on total wage bill and payroll, taxes on international transactions related to production.
D.3 Subsidies (payable) - current unrequited payments which general government or the institutions of the European Union make to resident producers, with the objective of influencing their levels of production, their prices or the remuneration of the factors of production
D.4 Property income accrues when the owners of financial assets and natural resources put them at the disposal of other units of the economy. The income payable for the use of financial assets is called investment income, while that payable for the use of a natural resource is called rent. Property income is the sum of investment income and rent.
D.41 Interest receivable by the owners of a financial asset for putting it at the disposal of another institutional unit - applies to deposits (AF.2), debt securities (AF.3), loans (AF.4) and other accounts payable (AF.8)
D.42 Dividends receivable by the owners of share equities. Dividends exclude "super dividends" which arise where the dividend paid is large relative to the recent level of dividends and earnings. Super dividends are recorded as withdrawal of equity (F.5). This arises, for example, in the case of dividends paid by the Central Bank in 2015.
D.45 Rent of a natural resource – income receivable by the owner of a natural resource for putting the resource at the disposal of another party.
D.5 Current taxes on income, wealth, etc., (payable) - all compulsory, unrequited payments, in cash or in kind, levied periodically by general government and by the rest of the world on the income and wealth of units in the economy, and some periodic taxes which are assessed neither on income nor wealth
D.6 Social contributions - transfers to households, in cash or in kind, intended to relieve them from the financial burden of a number of risks or needs.
D.7 Other current transfers – includes VAT and GNI based EU budget contributions, current transfers between subsectors of government, current international co-operation and current transfers to households and non-profit institutions.
D.9 Capital transfers - involve the acquisition or disposal of an asset, or assets, by at least one of the parties to the transaction. Includes capital taxes and investment grants.
P.1 Total output of Government is equal to market output, own account capital formation, and non-market output (i.e. the sum of D.1+P.2+P51c). The market output referred to in this publication is the imputed market value of social housing rented dwellings. See Table 3.
P.3 Final consumption expenditure of Government is equal to the total of its output (P.1) plus the expenditure on products/services supplied to households via market producers minus the sales of goods and services (at both market and non-market prices). This is made up of individual non-market services plus collective non-market services (P.31 and P.32). See Table 4.
F.1 Monetary gold and special drawing rights (SDRs)
F.11 Monetary gold
F.12 Special drawing rights (SDRs)
F.2 Currency and deposits
F.21 Currency
F.22 Transferable deposits
F.29 Other deposits
F.3 Debt securities
F.31 Short-term
F.32 Long-term
F.4 Loans
F.41 - Short-term loans
F.42 - Long-term loans
F.5 Equity and investment fund shares
F.51 Equity
F.52 Investment fund shares/units
F.6 Insurance pension and standardised guarantee schemes
F.7 Financial derivatives and employee stock options
F.71 Financial derivatives
F.72 Employee stock options
F.8 Other accounts receivable/payable
F.81 Trade credits and advances
F.89 Other trade credits
 Hide Background Notes
Scan the QR code below to view this release online or go to
http://www.cso.ie/en/releasesandpublications/er/gfsq/governmentfinancestatisticsquarter12021/
 Show Table 1 General Government Transactions: Revenue, Expenditure, Financing and Deficit Q1 2018 to Q1 2021
 Hide Table 1 General Government Transactions: Revenue, Expenditure, Financing and Deficit Q1 2018 to Q1 2021