
| € million | ||||
| Equity | Bonds and Notes | Money Market Instruments | Total | |
| 2020 | ||||
| Total | 1,531,880 | 1,621,287 | 484,302 | 3,637,469 |
| of which: | ||||
| United States | 614,838 | 426,268 | 145,475 | 1,186,581 |
| United Kingdom | 152,408 | 486,079 | 76,350 | 714,837 |
| France | 46,897 | 99,133 | 79,318 | 225,348 |
| Luxembourg | 108,236 | 29,202 | 8,245 | 145,683 |
| Germany | 43,865 | 61,198 | 23,617 | 128,680 |
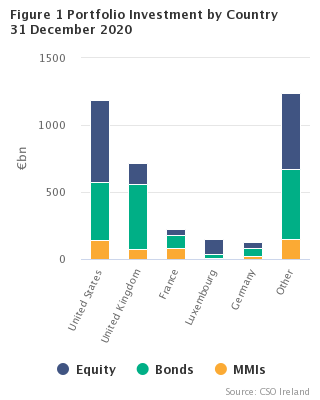
The value of Irish residents’ holdings of foreign securities at end-December 2020 amounted to €3,637bn, up €235bn on the 2019 level of €3,402bn. The increase is largely accounted for by increases in equity and money market instruments assets.
Combined investment in US-issued and UK-issued instruments (€1,901bn) accounted for 52.3% of the total stock, up from 51.8% on 2019.
Other points of note from the end-2020 results are:
This release also provides analysis by country of issuer and sector of holder (Table 2). Corresponding data for 2019 are shown including revisions resulting from more recent information. Overall, the data are compatible in form and content with the data being submitted to the International Monetary Fund (IMF) as part of Ireland’s on-going participation in the IMF’s world-wide annual Coordinated Portfolio Investment Survey. They are also consistent with the portfolio investment stock statistics published on the 2nd September 2021 in the International Accounts Quarter 2 2021 – see Background Notes. More detailed geographical analysis is available on PxStat.
| Debt | Equity | |
| Central Bank | 17.695244759 | 0 |
| Banks | 51.545371 | 0.44372 |
| Money Market Funds | 425.236783 | 0 |
| Investments Funds | 1211.339869 | 1237.218023526 |
| Insurance and Pensions | 78.024493682 | 219.492349954 |
| Government | 1.085792809 | 4.079269864 |
| Other | 320.66125064 | 70.646732219 |
Central Bank: S121
Banks: S122
Money Market Funds: S123
Investment Funds: S124
Insurance & Pensions: S128/S129
Government: S13
Other: S125/S126/S127/S11/S14/S15
| Debt | Equity | |
| 2018 | 1651.959 | 1094.649 |
| 2019 | 2013.049 | 1389.059 |
| 2020 | 2105.589 | 1531.88 |
| Table 1 Resident Holdings of Foreign Portfolio Securities1 - by Country of Issuer | € million | |||||||||||
| Country | Equity | Bonds and Notes | Money Market Instruments | Total | ||||||||
| 31 Dec 20192 | 31 Dec 2020 | 31 Dec 20192 | 31 Dec 2020 | 31 Dec 20192 | 31 Dec 2020 | 31 Dec 20192 | 31 Dec 2020 | |||||
| Australia | 15,106 | 16,636 | 13,928 | 14,113 | 13,974 | 8,306 | 43,008 | 39,055 | ||||
| Austria | 1,592 | 2,015 | 6,809 | 6,832 | 1,588 | 3,830 | 9,989 | 12,677 | ||||
| Belgium | 5,731 | 4,887 | 14,626 | 16,157 | 12,836 | 13,312 | 33,193 | 34,356 | ||||
| Bermuda | 9,368 | 9,104 | 3,986 | 4,863 | 10 | 1 | 13,364 | 13,968 | ||||
| Brazil | 9,519 | 7,690 | 6,026 | 5,002 | 65 | 27 | 15,610 | 12,719 | ||||
| Canada | 15,432 | 17,162 | 17,947 | 18,090 | 26,325 | 15,692 | 59,704 | 50,944 | ||||
| Cayman Islands | 63,751 | 81,149 | 19,666 | 20,888 | 1,513 | 1,747 | 84,930 | 103,784 | ||||
| China | 22,909 | 26,596 | 3,194 | 13,877 | 2,155 | 1,769 | 28,258 | 42,242 | ||||
| Denmark | 6,921 | 10,065 | * | 9,354 | * | 2,990 | 15,885 | 22,409 | ||||
| Finland | 6,744 | 7,171 | 4,823 | 5,105 | 15,775 | 14,579 | 27,342 | 26,855 | ||||
| France | 44,234 | 46,897 | 91,985 | 99,133 | 61,248 | 79,318 | 197,467 | 225,348 | ||||
| Germany | 45,823 | 43,865 | 54,719 | 61,198 | 33,746 | 23,617 | 134,288 | 128,680 | ||||
| Hong Kong | 13,188 | 11,792 | 1,811 | 1,942 | 586 | 2,335 | 15,585 | 16,069 | ||||
| India | 17,190 | 20,043 | 1,511 | 1,574 | 0 | 0 | 18,701 | 21,617 | ||||
| Indonesia | 3,609 | 3,189 | 8,481 | 8,250 | 0 | 0 | 12,090 | 11,439 | ||||
| Italy | 42,659 | 44,976 | 71,111 | 72,647 | 1,335 | 1,262 | 115,105 | 118,885 | ||||
| Japan | 70,662 | 74,404 | 18,294 | 19,080 | 20,120 | 21,593 | 109,076 | 115,077 | ||||
| Jersey | 7,436 | 8,259 | * | 4,174 | * | 28 | 11,899 | 12,461 | ||||
| Korea, Republic of | 18,321 | 25,438 | 3,165 | 3,659 | 476 | 171 | 21,962 | 29,268 | ||||
| Luxembourg | 102,927 | 108,236 | 30,686 | 29,202 | 5,484 | 8,245 | 139,097 | 145,683 | ||||
| Mexico | 3,578 | 3,268 | 13,309 | 12,730 | 235 | 39 | 17,122 | 16,037 | ||||
| Netherlands | 41,714 | 40,780 | 66,046 | 70,619 | 19,500 | 10,953 | 127,260 | 122,352 | ||||
| Norway | 5,110 | 5,647 | 5,955 | 5,909 | 1,420 | 2,522 | 12,485 | 14,078 | ||||
| Poland | 1,269 | 971 | 4,497 | 3,398 | 0 | 0 | 5,766 | 4,369 | ||||
| Portugal | 1,509 | 1,285 | 5,583 | 5,257 | 123 | 176 | 7,215 | 6,718 | ||||
| Russian Federation | 11,984 | 10,583 | 15,546 | 14,665 | 0 | 0 | 27,530 | 25,248 | ||||
| Singapore | 4,528 | 3,882 | 2,297 | 2,482 | 9,375 | 5,663 | 16,200 | 12,027 | ||||
| South Africa | 6,187 | 5,755 | 6,286 | 6,055 | 306 | 48 | 12,779 | 11,858 | ||||
| Spain | 15,463 | 14,185 | 43,982 | 46,159 | 3,124 | 1,357 | 62,569 | 61,701 | ||||
| Sweden | 13,862 | 17,019 | 14,431 | 12,804 | 10,689 | 14,879 | 38,982 | 44,702 | ||||
| Switzerland | 28,789 | 29,672 | 6,217 | 7,034 | 12,483 | 12,348 | 47,489 | 49,054 | ||||
| Taiwan, Province of China | 18,044 | 23,391 | 23 | 23 | 0 | 0 | 18,067 | 23,414 | ||||
| Turkey | 1,448 | 1,173 | 4,549 | 3,983 | 4 | 3 | 6,001 | 5,159 | ||||
| United Kingdom | 156,527 | 152,408 | 454,423 | 486,079 | 81,962 | 76,350 | 692,912 | 714,837 | ||||
| United States | 515,942 | 614,838 | 443,882 | 426,268 | 109,289 | 145,475 | 1,069,113 | 1,186,581 | ||||
| Other countries 3 | 39,983 | 37,449 | 67,480 | 85,656 | 8,190 | 9,097 | 115,653 | 132,202 | ||||
| International Organisations | 0 | 0 | 17,344 | 17,026 | 1,069 | 6,570 | 18,413 | 23,596 | ||||
| Total | 1,389,059 | 1,531,880 | 1,557,331 | 1,621,287 | 455,719 | 484,302 | 3,402,109 | 3,637,469 | ||||
| 1The figures exclude Reserve Assets (see Background Notes). | ||||||||||||
| 2Revised | ||||||||||||
| 3This category includes data supplied by respondents without a geographical breakdown. | ||||||||||||
| *Suppressed for confidentiality reasons. | ||||||||||||
| Table 2 Resident Holdings of Foreign Portfolio Securities1 - by Country of Issuer and Sector of Holder | € million | |||||||||||||||||||||||
| Country | Central Bank | Banks | Money Market Funds | Investment Funds | Insurance & Pensions | Government | Other | Total | ||||||||||||||||
| S121 | S122 | S123 | S124 | S128/9 | S13 | S125/6/7/11/14/15 | ||||||||||||||||||
| 31 Dec 20192 | 31 Dec 2020 | 31 Dec 20192 | 31 Dec 2020 | 31 Dec 20192 | 31 Dec 2020 | 31 Dec 20192 | 31 Dec 2020 | 31 Dec 20192 | 31 Dec 2020 | 31 Dec 20192 | 31 Dec 2020 | 31 Dec 20192 | 31 Dec 2020 | 31 Dec 20192 | 31 Dec 2020 | |||||||||
| Australia | 0 | 0 | * | * | 14,956 | 8,259 | * | 26,905 | 1,884 | * | 63 | 56 | * | 787 | 43,008 | 39,055 | ||||||||
| Austria | 469 | 212 | 299 | 271 | 1,153 | 3,485 | 5,090 | 6,288 | 1,721 | 1,510 | 1 | 1 | 1,256 | 910 | 9,989 | 12,677 | ||||||||
| Belgium | 1,042 | 906 | 1,351 | 1,522 | 12,243 | 12,602 | * | * | * | * | 22 | 19 | * | * | 33,193 | 34,356 | ||||||||
| Bermuda | 0 | 0 | * | * | 0 | 0 | * | 13,578 | 515 | * | 1 | 1 | * | 0 | 13,364 | 13,968 | ||||||||
| Brazil | 0 | 0 | 0 | 0 | 0 | 0 | 15,414 | 12,562 | 196 | 157 | 0 | 0 | 0 | 0 | 15,610 | 12,719 | ||||||||
| Canada | 781 | 672 | 904 | 1,278 | 26,360 | 14,250 | * | * | * | * | 23 | 16 | * | * | 59,704 | 50,944 | ||||||||
| Cayman Islands | 0 | 0 | 242 | * | 1,420 | 1,635 | * | 99,174 | * | * | 64 | 44 | * | 1,114 | 84,930 | 103,784 | ||||||||
| China | 0 | 0 | * | * | 2,106 | 1,640 | * | 39,475 | 806 | * | 70 | 45 | * | 189 | 28,258 | 42,242 | ||||||||
| Denmark | 196 | 181 | 520 | 488 | 0 | 2,179 | * | 17,549 | * | 906 | 13 | 7 | * | 1,099 | 15,885 | 22,409 | ||||||||
| Finland | 141 | 121 | 381 | 549 | 15,413 | 13,893 | * | * | * | * | 14 | 16 | * | * | 27,342 | 26,855 | ||||||||
| France | 5,337 | 4,790 | 6,648 | 7,449 | 55,779 | 74,039 | 88,265 | * | * | * | 360 | 349 | * | * | 197,467 | 225,348 | ||||||||
| Germany | 945 | 431 | * | * | 31,286 | 20,525 | 68,056 | 71,849 | 19,348 | * | 75 | 85 | * | 12,329 | 134,288 | 128,680 | ||||||||
| Hong Kong | 0 | 0 | 0 | 0 | 549 | 2,282 | * | 12,617 | * | 1,166 | 5 | 4 | * | 0 | 15,585 | 16,069 | ||||||||
| India | 0 | 0 | 0 | 0 | 0 | 0 | 18,263 | * | 438 | * | 0 | 0 | 0 | 0 | 18,701 | 21,617 | ||||||||
| Indonesia | 0 | 0 | 0 | 0 | 0 | 0 | * | 11,277 | * | 162 | 0 | 0 | * | 0 | 12,090 | 11,439 | ||||||||
| Italy | 2,109 | 1,901 | 13,867 | 11,433 | 160 | 252 | 42,355 | 44,164 | * | * | 93 | 73 | * | * | 115,105 | 118,885 | ||||||||
| Japan | 0 | 0 | 2,419 | * | 15,986 | 16,628 | 83,982 | 89,508 | 4,068 | * | 46 | 37 | 2,575 | 2,809 | 109,076 | 115,077 | ||||||||
| Jersey | 0 | 0 | * | * | 0 | 0 | * | * | 454 | 674 | 0 | 0 | * | * | 11,899 | 12,461 | ||||||||
| Luxembourg | 0 | 0 | 1,175 | * | 4,672 | 5,327 | * | 59,252 | 70,400 | 68,317 | 116 | 118 | * | * | 139,097 | 145,683 | ||||||||
| Mexico | 0 | 0 | * | 0 | 41 | 0 | * | * | 355 | * | 4 | 3 | * | * | 17,122 | 16,037 | ||||||||
| Netherlands | 298 | 253 | 2,321 | 2,263 | 19,678 | 10,789 | 66,635 | 68,047 | * | * | 135 | 134 | * | * | 127,260 | 122,352 | ||||||||
| Norway | 137 | 136 | 913 | 1,061 | 1,546 | 2,536 | * | * | * | * | 2 | 2 | * | * | 12,485 | 14,078 | ||||||||
| Poland | 178 | 154 | 486 | 438 | 0 | 0 | * | * | * | * | 0 | 1 | * | * | 5,766 | 4,369 | ||||||||
| Portugal | 255 | 129 | 1,312 | * | 59 | 121 | 2,661 | 2,266 | 336 | * | 10 | 9 | 2,582 | * | 7,215 | 6,718 | ||||||||
| Korea, Republic of | 211 | 184 | 0 | 0 | 475 | 176 | 20,134 | * | 992 | * | 0 | 0 | 150 | * | 21,962 | 29,268 | ||||||||
| Russian Federation | 0 | 0 | * | 0 | 0 | 0 | 12,490 | 10,247 | 167 | * | 0 | 0 | * | * | 27,530 | 25,248 | ||||||||
| Singapore | 0 | 0 | * | * | 8,907 | 5,466 | * | * | 322 | 324 | 2 | 2 | * | * | 16,200 | 12,027 | ||||||||
| South Africa | 0 | 0 | * | 0 | 0 | 0 | * | * | * | * | 0 | 0 | * | * | 12,779 | 11,858 | ||||||||
| Spain | 2,679 | 2,305 | 5,275 | 4,996 | 2,170 | 810 | 31,002 | 29,461 | * | * | 81 | 70 | * | * | 62,569 | 61,701 | ||||||||
| Sweden | 20 | 0 | 1,626 | 1,574 | 10,175 | 13,780 | * | * | * | * | 14 | 13 | * | * | 38,982 | 44,702 | ||||||||
| Switzerland | 0 | 0 | * | * | 11,597 | 11,841 | 31,712 | * | * | 3,750 | 33 | 13 | 483 | * | 47,489 | 49,054 | ||||||||
| Taiwan Province of China | 0 | 0 | 0 | 0 | 0 | 0 | 17,342 | 22,468 | 723 | 944 | 2 | 2 | 0 | 0 | 18,067 | 23,414 | ||||||||
| Turkey | 0 | 0 | 0 | * | 0 | 0 | 5,931 | 5,107 | 70 | * | 0 | 0 | 0 | 0 | 6,001 | 5,159 | ||||||||
| United Kingdom | 0 | 0 | 6,577 | 4,001 | 74,172 | 74,451 | 472,577 | 485,838 | * | * | 1,638 | 1,466 | * | * | 692,912 | 714,837 | ||||||||
| United States | 0 | 0 | * | 1,425 | 93,031 | 114,902 | 828,260 | 906,660 | * | 46,206 | 2,432 | 2,468 | * | 114,920 | 1,069,113 | 1,186,581 | ||||||||
| Other countries3 | 160 | 153 | * | * | 5,202 | 6,628 | 93,325 | 108,588 | * | * | 98 | 111 | * | * | 115,653 | 132,202 | ||||||||
| International Organisations | 5,938 | 5,167 | 2,740 | 3,535 | 1,328 | 6,741 | 5,881 | 6,708 | 722 | 478 | 0 | 0 | 1,804 | 967 | 18,413 | 23,596 | ||||||||
| Total | 20,896 | 17,695 | 57,207 | 51,989 | 410,464 | 425,237 | 2,268,734 | 2,448,558 | 288,361 | 297,517 | 5,417 | 5,165 | 351,030 | 391,308 | 3,402,109 | 3,637,469 | ||||||||
| 1The figures exclude Reserve Assets (see Background Notes). | ||||||||||||||||||||||||
| 2Revised. | ||||||||||||||||||||||||
| 3This category includes data supplied by respondents without a geographical breakdown. | ||||||||||||||||||||||||
| *Suppressed for confidentiality reasons. | ||||||||||||||||||||||||
This release updates the annual (end-December) series on foreign portfolio asset stock statistics introduced in October 2003. These figures result from the CSO’s ongoing participation in the annual Co-ordinated Portfolio Investment Survey (CPIS) conducted by the IMF. The information is compiled on the basis of the IMF’s methodological recommendations described in its Co-ordinated Portfolio Investment Survey Guide. This methodology is designed to harmonise the timing and valuation conventions used by all countries participating in the survey. The results are conceptually consistent with the International Investment Position (IIP) statistics on foreign assets published by the CSO. Therefore, the compilation methodology, which is designed to meet the recommendations of the IMF’s Balance of Payments Manual - 6th Edition (BPM6) concerning compilation of international investment position statistics, is essentially the same for both series.
The CPIS is concerned with portfolio investment stock statistics for equities and long-term (i.e. bonds and notes) and short-term (i.e. money market instruments) debt securities. The results are classified by country of issue of the securities and are also cross-classified by type of financial instrument, and by sector of holder.
For more detailed information see Resident Holdings Of Foreign Portfolio Securities
 Hide Background Notes
Scan the QR code below to view this release online or go to
http://www.cso.ie/en/releasesandpublications/er/fps/residentholdingsofforeignportfoliosecurities2020/
 Show Table 1 Resident Holdings of Foreign Portfolio Securities - by Country
 Hide Table 1 Resident Holdings of Foreign Portfolio Securities - by Country