
| Year PPSN allocated | Allocations to foreign nationals aged 15 & over | Number with no employment activity 2011-2016 | Employment activity by year | |||||
| 2011 | 2012 | 2013 | 2014 | 2015 | 2016 | |||
| 2011 | 57,946 | 26,364 | 21,730 | 22,417 | 17,906 | 15,686 | 14,461 | 13,759 |
| 2012 | 64,054 | 28,621 | 33 | 24,806 | 26,039 | 20,841 | 18,372 | 17,007 |
| 2013 | 75,780 | 34,593 | 75 | 28,896 | 31,565 | 25,513 | 22,692 | |
| 2014 | 85,696 | 38,097 | 62 | 35,172 | 37,921 | 30,710 | ||
| 2015 | 82,779 | 32,807 | 52 | 41,855 | 41,620 | |||
| 2016 | 94,978 | 43,037 | 200 | 51,914 | ||||
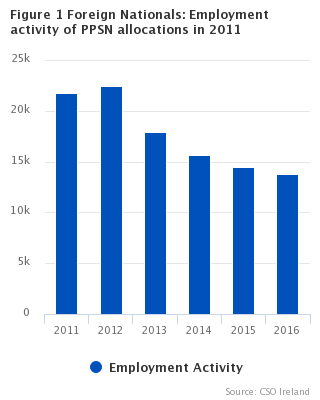
Of the 57,946 foreign nationals aged 15 years and over who were assigned PPSNs (Personal Public Service Numbers) in 2011, 13,759 (23.7%) had employment activity at any time during 2016. See table 2.
This data is based upon an annual analysis of records of the Revenue Commissioners, the Department of Employment Affairs and Social Protection, and the CSO, based on foreign nationals who were allocated PPSNs during the period 2002-2016.
Note: Unless otherwise indicated, the term “activity” in this release means any PAYE employment or any engagement with the social welfare system.
The analysis also shows that:
Activity rate in the year of allocation is 63.5% in 2016
Employment and social welfare activity rates for foreign nationals in 2016 ranged from a low of 40.6% for 2011 allocations, where 23,539 of the 57,946 allocations had employment or interacted with the social welfare system in the year, to a high of 64.9%, where 53,763 of the 82,779 allocations were active, for 2015 allocations. In 2016, 63.5% or 60,443 of 94,978 allocations were recorded as active.
For 2016, foreign nationals from the EU15 to EU25 states had the highest activity rate in 2016, with 79.8% (10,760) of allocations recording employment or engagement with the social welfare system in the year. This was followed by nationals from the EU25 to EU28 with 74.9% (11,786) of allocations having activity in the year. The Rest of the World had 16,772 allocations in 2016, with a 61.2% activity rate in the year. See table 1.
Employment activity rate in year of allocation shows a 4.1 percentage point increase in 2016
Employment activity for PPSN allocations to foreign nationals in the year of arrival increased from 41,855 in 2015 to 51,914 in 2016. The employment activity rate in year of allocation has increased by 4.1 percentage points from 50.6% in 2015 to 54.7% in 2016.
The nationality group with the highest employment activity rate in the year of allocation is the EU15 to EU25 states in 2016 at 69.4%. The Rest of the World had the largest annual increase in the 2016 employment activity rate, increasing by 9.9 percentage points from 40.3% for 2015 allocations to 50.2% for 2016 allocations. See table 2.
Social Welfare activity rate in year of allocation decreased to 8.9% in 2016
In 2016 the social welfare activity rate in the year of allocation was 8.9%, representing a decrease of 1.9 percentage points from the 2015 rate of 10.8%. The social welfare activity rate in the year of allocation in 2011 was also 8.9%. In 2016, 9,780 (16.9%) of the 57,946 PPSN allocations from 2011 recorded social welfare activity. The comparable figure for 2011 allocations in 2015 was marginally less at 16.3% (9,474).
Across the nationality groups the largest percentage of 2011 allocations to have social welfare activity in 2016 was the EU25 to EU28 states with 1,008 (27.2%), of the 3,704 allocations to those countries in 2011 recording social welfare activity in 2016. This is followed by the EU15 to EU25 states which have a social welfare activity rate of 26.0% in 2016 for 2011 allocations. See table 3.
| It should be noted that there are several possible reasons for increases in social welfare activity by allocation year over time; the birth of a child leading to a child benefit claim, jobseekers claims, and the fact that some benefits depend on habitual residence requirements or on having sufficient social insurance benefits. |
| Year PPSN allocated | PPSN Allocations |
|---|---|
| 2011 | 67015 |
| 2012 | 72788 |
| 2013 | 85134 |
| 2014 | 96140 |
| 2015 | 94701 |
| 2016 | 107767 |
PPSN allocations to foreign nationals increased by 13.8% in 2016
Overall, PPSN allocations to foreign nationals across all age groups were 107,767 in 2016. This is an increase of 13,066 (+13.8%) when compared with allocations in 2015. See table 5 and graph above.
Other main points which can be noted include:
| Table 1 Foreign Nationals aged 15 years and over: Employment and Social Welfare activity by broad nationality group and year of activity | |||||||||
| Numbers | |||||||||
| Year PPSN allocated | Allocations to foreign nationals aged 15 years and over | Number with no activity 2011–2016 | Activity1 by year | ||||||
| Broad nationality group | 2011 | 2012 | 2013 | 2014 | 2015 | 2016 | |||
| United Kingdom | 2011 | 10,935 | 5,946 | 4,077 | 4,066 | 3,532 | 3,184 | 3,004 | 2,900 |
| 2012 | 10,754 | 5,887 | 95 | 3,964 | 4,039 | 3,344 | 3,090 | 2,961 | |
| 2013 | 11,193 | 6,324 | 65 | 120 | 3,902 | 4,070 | 3,425 | 3,301 | |
| 2014 | 11,973 | 6,844 | 44 | 47 | 111 | 4,087 | 4,301 | 3,834 | |
| 2015 | 13,954 | 8,350 | 30 | 32 | 37 | 71 | 4,835 | 5,360 | |
| 2016 | 13,774 | 9,082 | 65 | 66 | 68 | 70 | 117 | 5,036 | |
| EU15 excl. Ireland and the UK | 2011 | 12,002 | 3,411 | 7,204 | 6,868 | 5,505 | 4,765 | 4,273 | 3,872 |
| 2012 | 14,407 | 4,265 | 24 | 8,463 | 8,446 | 6,756 | 5,825 | 5,187 | |
| 2013 | 16,902 | 5,496 | 4 | 38 | 9,520 | 9,477 | 7,475 | 6,509 | |
| 2014 | 18,884 | 5,868 | 7 | 8 | 30 | 10,958 | 11,101 | 8,900 | |
| 2015 | 17,718 | 4,310 | 4 | 4 | 4 | 34 | 12,064 | 11,795 | |
| 2016 | 21,352 | 7,000 | 8 | 9 | 12 | 13 | 58 | 14,831 | |
| EU15 to EU25 states | 2011 | 14,200 | 3,899 | 8,204 | 9,153 | 8,631 | 8,434 | 8,291 | 8,213 |
| 2012 | 14,569 | 3,907 | 58 | 8,832 | 9,720 | 8,957 | 8,641 | 8,563 | |
| 2013 | 14,944 | 3,867 | 6 | 62 | 9,521 | 10,275 | 9,287 | 9,171 | |
| 2014 | 14,084 | 3,195 | 6 | 7 | 62 | 9,951 | 10,266 | 9,148 | |
| 2015 | 13,274 | 2,236 | 3 | 4 | 12 | 62 | 10,828 | 10,714 | |
| 2016 | 13,476 | 3,464 | – | – | * | 4 | 73 | 10,760 | |
| EU25 to EU28 states | 2011 | 3,704 | 1,296 | 1,132 | 1,802 | 2,090 | 2,296 | 2,452 | 2,525 |
| 2012 | 5,204 | 1,602 | 3 | 1,990 | 3,236 | 3,266 | 3,394 | 3,494 | |
| 2013 | 8,132 | 2,383 | * | 3 | 4,057 | 5,467 | 5,321 | 5,386 | |
| 2014 | 10,836 | 2,791 | * | * | 12 | 6,306 | 7,911 | 7,581 | |
| 2015 | 12,449 | 2,107 | * | * | * | 7 | 9,389 | 10,645 | |
| 2016 | 15,734 | 4,737 | * | – | – | – | 36 | 11,786 | |
| USA | 2011 | 2,176 | 1,292 | 606 | 691 | 590 | 500 | 488 | 459 |
| 2012 | 2,203 | 1,269 | 9 | 633 | 716 | 585 | 511 | 477 | |
| 2013 | 2,503 | 1,475 | 4 | 6 | 698 | 849 | 680 | 605 | |
| 2014 | 2,759 | 1,572 | * | * | 11 | 846 | 973 | 786 | |
| 2015 | 2,765 | 1,621 | * | * | * | 12 | 930 | 1,034 | |
| 2016 | 3,249 | 2,117 | 3 | 3 | 4 | 4 | 21 | 1,149 | |
| Rest of the world | 2011 | 14,929 | 5,829 | 5,671 | 6,984 | 5,814 | 5,486 | 5,427 | 5,570 |
| 2012 | 16,917 | 6,830 | 42 | 6,255 | 7,758 | 6,798 | 6,475 | 6,413 | |
| 2013 | 22,106 | 9,397 | 6 | 55 | 7,645 | 10,362 | 9,188 | 8,763 | |
| 2014 | 27,160 | 11,487 | 4 | 6 | 79 | 10,362 | 13,488 | 11,958 | |
| 2015 | 22,619 | 6,757 | 9 | 13 | 13 | 69 | 12,759 | 14,215 | |
| 2016 | 27,393 | 10,890 | 8 | 9 | 12 | 13 | 151 | 16,772 | |
| Total foreign nationals | 2011 | 57,946 | 21,673 | 26,894 | 29,564 | 26,162 | 24,665 | 23,935 | 23,539 |
| 2012 | 64,054 | 23,760 | 231 | 30,137 | 33,915 | 29,706 | 27,936 | 27,095 | |
| 2013 | 75,780 | 28,942 | 86 | 284 | 35,343 | 40,500 | 35,376 | 33,735 | |
| 2014 | 85,696 | 31,757 | 64 | 71 | 305 | 42,510 | 48,040 | 42,207 | |
| 2015 | 82,779 | 25,381 | 48 | 55 | 68 | 255 | 50,805 | 53,763 | |
| 2016 | 94,978 | 37,290 | 85 | 87 | 97 | 104 | 456 | 60,334 | |
| 1 Activity means any PAYE employment or any engagement with the social welfare system. | |||||||||
| * Confidential | |||||||||
| – No Data | |||||||||
| Table 2 Foreign Nationals aged 15 years and over: Employment activity by broad nationality group and year of activity | |||||||||
| Numbers | |||||||||
| Year PPSN allocated | Allocations to foreign nationals aged 15 years and over | Number with no employment activity 2011–2016 | Employment activity by year | ||||||
| Broad nationality group | 2011 | 2012 | 2013 | 2014 | 2015 | 2016 | |||
| United Kingdom | 2011 | 10,935 | 7,333 | 2,610 | 2,595 | 2,091 | 1,765 | 1,576 | 1,455 |
| 2012 | 10,754 | 7,097 | 10 | 2,711 | 2,693 | 2,064 | 1,782 | 1,598 | |
| 2013 | 11,193 | 7,549 | – | 23 | 2,709 | 2,771 | 2,116 | 1,809 | |
| 2014 | 11,973 | 8,149 | – | – | 13 | 2,881 | 2,909 | 2,213 | |
| 2015 | 13,954 | 9,514 | – | – | – | 10 | 3,564 | 3,641 | |
| 2016 | 13,774 | 9,997 | – | – | – | – | 15 | 3,775 | |
| EU15 excl. Ireland and the UK | 2011 | 12,002 | 3,952 | 6,528 | 5,987 | 4,511 | 3,729 | 3,165 | 2,798 |
| 2012 | 14,407 | 4,881 | 7 | 7,597 | 7,308 | 5,561 | 4,599 | 3,947 | |
| 2013 | 16,902 | 6,342 | – | 22 | 8,311 | 8,244 | 6,255 | 5,214 | |
| 2014 | 18,884 | 6,676 | – | – | 10 | 9,714 | 9,824 | 7,545 | |
| 2015 | 17,718 | 4,983 | – | – | – | 16 | 11,035 | 10,518 | |
| 2016 | 21,352 | 7,621 | – | – | – | * | 39 | 13,725 | |
| EU15 to EU25 states | 2011 | 14,200 | 4,762 | 6,785 | 6,633 | 5,508 | 4,989 | 4,714 | 4,524 |
| 2012 | 14,569 | 4,757 | 6 | 7,381 | 7,125 | 5,822 | 5,269 | 5,037 | |
| 2013 | 14,944 | 4,814 | – | 17 | 7,834 | 7,517 | 6,129 | 5,629 | |
| 2014 | 14,084 | 4,099 | – | – | 15 | 8,276 | 7,589 | 6,176 | |
| 2015 | 13,274 | 3,053 | – | – | – | 10 | 9,081 | 8,056 | |
| 2016 | 13,476 | 4,129 | – | – | – | – | 31 | 9,347 | |
| EU25 to EU28 states | 2011 | 3,704 | 1,549 | 973 | 1,393 | 1,459 | 1,477 | 1,501 | 1,517 |
| 2012 | 5,204 | 1,953 | * | 1,723 | 2,501 | 2,303 | 2,248 | 2,206 | |
| 2013 | 8,132 | 2,871 | – | * | 3,446 | 4,196 | 3,817 | 3,624 | |
| 2014 | 10,836 | 3,388 | – | – | 8 | 5,454 | 6,244 | 5,509 | |
| 2015 | 12,449 | 2,651 | – | – | – | 5 | 8,299 | 8,489 | |
| 2016 | 15,734 | 5,390 | – | – | – | – | 32 | 10,342 | |
| USA | 2011 | 2,176 | 1,442 | 498 | 529 | 401 | 310 | 280 | 241 |
| 2012 | 2,203 | 1,428 | 4 | 536 | 554 | 405 | 310 | 271 | |
| 2013 | 2,503 | 1,658 | – | – | 582 | 664 | 481 | 365 | |
| 2014 | 2,759 | 1,768 | – | – | 3 | 732 | 789 | 549 | |
| 2015 | 2,765 | 1,812 | – | – | – | 5 | 765 | 788 | |
| 2016 | 3,249 | 2,267 | – | – | – | – | 9 | 975 | |
| Rest of the world | 2011 | 14,929 | 7,326 | 4,336 | 5,280 | 3,936 | 3,416 | 3,225 | 3,224 |
| 2012 | 16,917 | 8,505 | 4 | 4,858 | 5,858 | 4,686 | 4,164 | 3,948 | |
| 2013 | 22,106 | 11,359 | – | 11 | 6,014 | 8,173 | 6,715 | 6,051 | |
| 2014 | 27,160 | 14,017 | – | – | 13 | 8,115 | 10,566 | 8,718 | |
| 2015 | 22,619 | 10,794 | – | – | – | 6 | 9,111 | 10,128 | |
| 2016 | 27,393 | 13,633 | – | – | – | – | 74 | 13,750 | |
| Total foreign nationals | 2011 | 57,946 | 26,364 | 21,730 | 22,417 | 17,906 | 15,686 | 14,461 | 13,759 |
| 2012 | 64,054 | 28,621 | 33 | 24,806 | 26,039 | 20,841 | 18,372 | 17,007 | |
| 2013 | 75,780 | 34,593 | – | 75 | 28,896 | 31,565 | 25,513 | 22,692 | |
| 2014 | 85,696 | 38,097 | – | – | 62 | 35,172 | 37,921 | 30,710 | |
| 2015 | 82,779 | 32,807 | – | – | – | 52 | 41,855 | 41,620 | |
| 2016 | 94,978 | 43,037 | – | – | – | * | 200 | 51,914 | |
| * Confidential | |||||||||
| – No Data | |||||||||
| Table 3 Foreign Nationals aged 15 years and over: Social Welfare activity by broad nationality group and year of activity | |||||||||
| Numbers | |||||||||
| Year PPSN allocated | Allocations to foreign nationals aged 15 years and over | Number with no S/W activity 2011–2016 | Social Welfare activity by year | ||||||
| Broad nationality group | 2011 | 2012 | 2013 | 2014 | 2015 | 2016 | |||
| United Kingdom | 2011 | 10,935 | 8,390 | 1,467 | 1,471 | 1,441 | 1,419 | 1,428 | 1,445 |
| 2012 | 10,754 | 8,442 | 85 | 1,253 | 1,346 | 1,280 | 1,308 | 1,363 | |
| 2013 | 11,193 | 8,956 | 65 | 97 | 1,193 | 1,299 | 1,309 | 1,492 | |
| 2014 | 11,973 | 9,737 | 44 | 47 | 98 | 1,206 | 1,392 | 1,621 | |
| 2015 | 13,954 | 11,981 | 30 | 32 | 37 | 61 | 1,271 | 1,719 | |
| 2016 | 13,774 | 12,514 | 65 | 66 | 68 | 70 | 102 | 1,261 | |
| EU15 excl. Ireland and the UK | 2011 | 12,002 | 9,701 | 676 | 881 | 994 | 1,036 | 1,108 | 1,074 |
| 2012 | 14,407 | 11,829 | 17 | 866 | 1,138 | 1,195 | 1,226 | 1,240 | |
| 2013 | 16,902 | 14,252 | 4 | 16 | 1,209 | 1,233 | 1,220 | 1,295 | |
| 2014 | 18,884 | 16,501 | 7 | 8 | 20 | 1,244 | 1,277 | 1,355 | |
| 2015 | 17,718 | 16,043 | 4 | 4 | 4 | 18 | 1,029 | 1,277 | |
| 2016 | 21,352 | 20,246 | 8 | 9 | 12 | 12 | 19 | 1,106 | |
| EU15 to EU25 states | 2011 | 14,200 | 8,999 | 1,419 | 2,520 | 3,123 | 3,445 | 3,577 | 3,689 |
| 2012 | 14,569 | 9,623 | 52 | 1,451 | 2,595 | 3,135 | 3,372 | 3,526 | |
| 2013 | 14,944 | 10,311 | 6 | 45 | 1,687 | 2,758 | 3,158 | 3,542 | |
| 2014 | 14,084 | 10,350 | 6 | 7 | 47 | 1,675 | 2,677 | 2,972 | |
| 2015 | 13,274 | 10,358 | 3 | 4 | 12 | 52 | 1,747 | 2,658 | |
| 2016 | 13,476 | 12,063 | – | – | * | 4 | 42 | 1,413 | |
| EU25 to EU28 states | 2011 | 3,704 | 2,438 | 159 | 409 | 631 | 819 | 951 | 1,008 |
| 2012 | 5,204 | 3,508 | * | 267 | 735 | 963 | 1,146 | 1,288 | |
| 2013 | 8,132 | 5,864 | * | * | 611 | 1,271 | 1,504 | 1,762 | |
| 2014 | 10,836 | 8,326 | * | * | 4 | 852 | 1,667 | 2,072 | |
| 2015 | 12,449 | 10,152 | * | * | * | * | 1,090 | 2,156 | |
| 2016 | 15,734 | 14,290 | * | – | – | – | 4 | 1,444 | |
| USA | 2011 | 2,176 | 1,890 | 108 | 162 | 189 | 190 | 208 | 218 |
| 2012 | 2,203 | 1,923 | 5 | 97 | 162 | 180 | 201 | 206 | |
| 2013 | 2,503 | 2,206 | 4 | 6 | 116 | 185 | 199 | 240 | |
| 2014 | 2,759 | 2,488 | * | * | 8 | 114 | 184 | 237 | |
| 2015 | 2,765 | 2,503 | * | * | * | 7 | 165 | 246 | |
| 2016 | 3,249 | 3,075 | 3 | 3 | 4 | 4 | 12 | 174 | |
| Rest of the world | 2011 | 14,929 | 11,800 | 1,335 | 1,704 | 1,878 | 2,070 | 2,202 | 2,346 |
| 2012 | 16,917 | 13,742 | 38 | 1,397 | 1,900 | 2,112 | 2,311 | 2,465 | |
| 2013 | 22,106 | 18,727 | 6 | 44 | 1,631 | 2,189 | 2,473 | 2,712 | |
| 2014 | 27,160 | 23,198 | 4 | 6 | 66 | 2,247 | 2,922 | 3,240 | |
| 2015 | 22,619 | 17,700 | 9 | 13 | 13 | 63 | 3,648 | 4,087 | |
| 2016 | 27,393 | 24,371 | 8 | 9 | 12 | 13 | 77 | 3,022 | |
| Total foreign nationals | 2011 | 57,946 | 43,218 | 5,164 | 7,147 | 8,256 | 8,979 | 9,474 | 9,780 |
| 2012 | 64,054 | 49,067 | 198 | 5,331 | 7,876 | 8,865 | 9,564 | 10,088 | |
| 2013 | 75,780 | 60,316 | 86 | 209 | 6,447 | 8,935 | 9,863 | 11,043 | |
| 2014 | 85,696 | 70,600 | 64 | 71 | 243 | 7,338 | 10,119 | 11,497 | |
| 2015 | 82,779 | 68,737 | 48 | 55 | 68 | 203 | 8,950 | 12,143 | |
| 2016 | 94,978 | 86,559 | 85 | 87 | 97 | 103 | 256 | 8,420 | |
| * Confidential | |||||||||
| – No Data | |||||||||
| Table 4 Foreign Nationals aged 15 years and over: Employment activity by economic sector and broad nationality group, 20161 | ||||||||
| Numbers | ||||||||
| Broad nationality group | ||||||||
| Economic Sector (NACE Rev.2) | United Kingdom | EU15 excl Ireland & the UK | EU15 to EU25 states | EU25 to EU28 states | USA | Rest of the world | Total foreign nationals | |
| A | Agriculture, forestry and fishing | 297 | 275 | 4,733 | 1,495 | 17 | 461 | 7,278 |
| B | Mining and quarrying | 48 | 10 | 215 | 8 | * | 44 | 326 |
| C | Manufacturing | 2,848 | 5,242 | 29,000 | 3,766 | 327 | 4,377 | 45,560 |
| D | Electricity, gas, steam and air conditioning supply | 151 | 82 | 58 | 23 | 6 | 103 | 423 |
| E | Water supply; sewerage, waste management and remediation activities | 129 | 64 | 1,493 | 340 | 6 | 118 | 2,150 |
| F | Construction | 1,247 | 584 | 6,797 | 3,661 | 42 | 1,085 | 13,416 |
| G | Wholesale and retail trade; repair of motor vehicles and motorcycles | 5,837 | 4,620 | 33,356 | 4,952 | 624 | 10,757 | 60,146 |
| H | Transportation and storage | 1,367 | 3,966 | 7,764 | 1,157 | 56 | 925 | 15,235 |
| I | Accommodation and food service activities | 3,565 | 7,896 | 29,913 | 10,030 | 516 | 19,944 | 71,864 |
| J | Information and communication | 2,788 | 11,346 | 4,203 | 1,303 | 701 | 7,767 | 28,108 |
| K | Financial and insurance activities excluding activities of holding companies | 2,650 | 4,399 | 3,332 | 512 | 436 | 2,458 | 13,787 |
| L | Real estate activities | 321 | 256 | 1,653 | 501 | 35 | 939 | 3,705 |
| M | Professional, scientific and technical activities | 2,957 | 4,856 | 4,768 | 1,228 | 506 | 4,561 | 18,876 |
| N | Administrative and support service activities | 3,190 | 10,762 | 23,099 | 8,547 | 488 | 11,312 | 57,398 |
| O | Public administration and defence; compulsory social security | 1,834 | 558 | 1,102 | 321 | 139 | 3,472 | 7,426 |
| P | Education | 2,139 | 2,872 | 1,813 | 333 | 597 | 2,990 | 10,744 |
| Q | Human health and social work actvities | 3,547 | 2,394 | 8,116 | 1,804 | 319 | 11,442 | 27,622 |
| R | Arts, entertainment and recreation | 800 | 391 | 1,287 | 408 | 104 | 919 | 3,909 |
| S | Other service activities | 656 | 358 | 3,793 | 1,505 | 67 | 1,410 | 7,789 |
| T | Activities of households as employers | 17 | 33 | 61 | 16 | – | 82 | 209 |
| U | Activities of extra territorial organisations and bodies | 3 | 7 | 12 | * | – | 19 | 43 |
| Unknown | 1,819 | 1,828 | 5,893 | 1,720 | 286 | 3,379 | 14,925 | |
| Total | 38,210 | 62,799 | 172,461 | 43,632 | 5,273 | 88,564 | 410,939 | |
| 1 This table relates to those foreign nationals assigned PPSNs during the period 2002 to 2016 inclusive and employed during 2016. | ||||||||
| * Confidential | ||||||||
| – No Data | ||||||||
| Table 5 Foreign Nationals: PPSN allocations by age group and broad nationality group | ||||||||
| Numbers | ||||||||
| Year PPSN allocated | Age at allocation | UK | EU15 excl Ireland & the UK | EU15 to EU25 states | EU25 to EU28 states | USA | Rest of world | Total foreign nationals1 |
| 2011 | 0-14 | 2,142 | 931 | 3,179 | 459 | 515 | 1,843 | 9,069 |
| 15-24 | 1,800 | 4,683 | 6,333 | 1,331 | 375 | 5,942 | 20,464 | |
| 25-44 | 3,853 | 6,244 | 6,320 | 2,057 | 808 | 8,008 | 27,290 | |
| 45-64 | 3,863 | 865 | 1,419 | 293 | 657 | 793 | 7,890 | |
| 65+ | 1,419 | 210 | 128 | 23 | 336 | 186 | 2,302 | |
| Total | 13,077 | 12,933 | 17,379 | 4,163 | 2,691 | 16,772 | 67,015 | |
| 2012 | 0-14 | 1,968 | 1,015 | 2,805 | 635 | 482 | 1,829 | 8,734 |
| 15-24 | 1,785 | 5,566 | 6,204 | 1,706 | 394 | 6,607 | 22,262 | |
| 25-44 | 3,966 | 7,718 | 6,710 | 3,016 | 825 | 9,205 | 31,440 | |
| 45-64 | 3,646 | 911 | 1,492 | 450 | 659 | 858 | 8,016 | |
| 65+ | 1,357 | 212 | 163 | 32 | 325 | 247 | 2,336 | |
| Total | 12,722 | 15,422 | 17,374 | 5,839 | 2,685 | 18,746 | 72,788 | |
| 2013 | 0-14 | 1,980 | 1,378 | 2,419 | 948 | 537 | 2,092 | 9,354 |
| 15-24 | 1,598 | 6,143 | 6,199 | 2,452 | 421 | 8,412 | 25,225 | |
| 25-44 | 3,954 | 9,339 | 7,046 | 4,950 | 910 | 12,238 | 38,437 | |
| 45-64 | 4,138 | 1,153 | 1,547 | 684 | 792 | 1,098 | 9,412 | |
| 65+ | 1,503 | 267 | 152 | 46 | 380 | 358 | 2,706 | |
| Total | 13,173 | 18,280 | 17,363 | 9,080 | 3,040 | 24,198 | 85,134 | |
| 2014 | 0-14 | 1,842 | 1,527 | 2,609 | 1,347 | 637 | 2,482 | 10,444 |
| 15-24 | 1,758 | 7,238 | 5,714 | 3,193 | 524 | 9,475 | 27,902 | |
| 25-44 | 4,310 | 10,181 | 6,794 | 6,570 | 991 | 15,735 | 44,581 | |
| 45-64 | 4,345 | 1,206 | 1,410 | 1,005 | 827 | 1,378 | 10,171 | |
| 65+ | 1,560 | 259 | 166 | 68 | 417 | 572 | 3,042 | |
| Total | 13,815 | 20,411 | 16,693 | 12,183 | 3,396 | 29,642 | 96,140 | |
| 2015 | 0-14 | 2,178 | 1,520 | 2,473 | 1,628 | 565 | 3,558 | 11,922 |
| 15-24 | 1,840 | 6,549 | 5,245 | 3,404 | 485 | 6,539 | 24,062 | |
| 25-44 | 5,646 | 9,655 | 6,565 | 7,948 | 968 | 14,278 | 45,060 | |
| 45-64 | 4,845 | 1,231 | 1,325 | 1,020 | 904 | 1,272 | 10,597 | |
| 65+ | 1,623 | 283 | 139 | 77 | 408 | 530 | 3,060 | |
| Total | 16,132 | 19,238 | 15,747 | 14,077 | 3,330 | 26,177 | 94,701 | |
| 2016 | 0-14 | 2,143 | 1,784 | 2,205 | 2,086 | 620 | 3,951 | 12,789 |
| 15-24 | 1,815 | 8,217 | 5,076 | 4,469 | 645 | 6,833 | 27,055 | |
| 25-44 | 5,399 | 11,425 | 6,743 | 9,645 | 1,243 | 18,498 | 52,953 | |
| 45-64 | 4,882 | 1,438 | 1,473 | 1,547 | 938 | 1,487 | 11,765 | |
| 65+ | 1,678 | 272 | 184 | 73 | 423 | 575 | 3,205 | |
| Total | 15,917 | 23,136 | 15,681 | 17,820 | 3,869 | 31,344 | 107,767 | |
| 1 This table includes PPSN allocations to foreign nationals of all ages. | ||||||||
| Table 6 Foreign Nationals: PPSN allocations by sex and broad nationality group | ||||||||
| Numbers | ||||||||
| Year PPSN allocated | Sex | UK | EU15 excl Ireland & the UK | EU15 to EU25 states | EU25 to EU28 states | USA | Rest of world | Total foreign nationals1 |
| 2011 | Male | 7,150 | 6,964 | 8,256 | 2,231 | 1,204 | 8,571 | 34,376 |
| Female | 5,927 | 5,969 | 9,123 | 1,932 | 1,487 | 8,201 | 32,639 | |
| Total | 13,077 | 12,933 | 17,379 | 4,163 | 2,691 | 16,772 | 67,015 | |
| 2012 | Male | 7,022 | 8,279 | 8,217 | 3,199 | 1,261 | 9,342 | 37,320 |
| Female | 5,700 | 7,143 | 9,157 | 2,640 | 1,424 | 9,404 | 35,468 | |
| Total | 12,722 | 15,422 | 17,374 | 5,839 | 2,685 | 18,746 | 72,788 | |
| 2013 | Male | 7,348 | 9,677 | 8,379 | 5,139 | 1,405 | 12,515 | 44,463 |
| Female | 5,825 | 8,603 | 8,984 | 3,941 | 1,635 | 11,683 | 40,671 | |
| Total | 13,173 | 18,280 | 17,363 | 9,080 | 3,040 | 24,198 | 85,134 | |
| 2014 | Male | 7,727 | 10,617 | 8,551 | 7,098 | 1,540 | 15,404 | 50,937 |
| Female | 6,088 | 9,794 | 8,142 | 5,085 | 1,856 | 14,238 | 45,203 | |
| Total | 13,815 | 20,411 | 16,693 | 12,183 | 3,396 | 29,642 | 96,140 | |
| 2015 | Male | 9,298 | 10,154 | 8,073 | 8,526 | 1,527 | 14,177 | 51,755 |
| Female | 6,834 | 9,084 | 7,674 | 5,551 | 1,803 | 12,000 | 42,946 | |
| Total | 16,132 | 19,238 | 15,747 | 14,077 | 3,330 | 26,177 | 94,701 | |
| 2016 | Male | 9,079 | 12,190 | 8,567 | 10,943 | 1,769 | 16,066 | 58,614 |
| Female | 6,838 | 10,946 | 7,114 | 6,877 | 2,100 | 15,278 | 49,153 | |
| Total | 15,917 | 23,136 | 15,681 | 17,820 | 3,869 | 31,344 | 107,767 | |
| 1 This table includes PPSN allocations to foreign nationals of all ages. | ||||||||
| Table 7 - Foreign Nationals: PPSN allocations by nationality1 | ||||||
| Numbers | ||||||
| Nationality | 2011 | 2012 | 2013 | 2014 | 2015 | 2016 |
| United Kingdom | 13,077 | 12,722 | 13,173 | 13,815 | 16,132 | 15,917 |
| Romania | 3,825 | 5,284 | 7,714 | 9,077 | 8,636 | 11,206 |
| Poland | 8,080 | 8,659 | 9,235 | 9,119 | 8,585 | 8,017 |
| Brazil | 4,843 | 5,448 | 6,211 | 7,712 | 5,022 | 7,270 |
| Italy | 2,169 | 2,754 | 3,601 | 4,310 | 4,157 | 5,535 |
| Spain | 2,607 | 3,936 | 5,011 | 5,195 | 4,355 | 5,439 |
| Croatia | 60 | 86 | 488 | 2,224 | 4,342 | 5,312 |
| India | 1,448 | 1,849 | 2,613 | 3,056 | 3,129 | 4,959 |
| France | 2,673 | 2,914 | 3,174 | 3,740 | 3,743 | 4,381 |
| USA | 2,691 | 2,685 | 3,040 | 3,396 | 3,330 | 3,869 |
| Lithuania | 3,552 | 2,861 | 2,518 | 2,316 | 2,337 | 2,837 |
| Germany | 2,164 | 2,144 | 2,161 | 2,409 | 2,458 | 2,484 |
| Pakistan | 790 | 727 | 888 | 1,614 | 3,166 | 2,215 |
| Portugal | 719 | 1,144 | 1,589 | 1,958 | 1,626 | 2,143 |
| China | 941 | 1,139 | 1,113 | 1,430 | 1,143 | 1,472 |
| Hungary | 1,575 | 1,993 | 1,882 | 1,725 | 1,616 | 1,433 |
| Latvia | 2,189 | 1,760 | 1,569 | 1,310 | 1,172 | 1,316 |
| Bulgaria | 278 | 469 | 878 | 882 | 1,099 | 1,302 |
| Australia | 554 | 589 | 638 | 882 | 1,038 | 1,157 |
| Canada | 607 | 610 | 742 | 841 | 886 | 1,037 |
| Slovakia | 1,017 | 1,139 | 1,096 | 1,083 | 958 | 996 |
| Netherlands | 710 | 659 | 823 | 886 | 826 | 959 |
| Philippines | 402 | 400 | 425 | 414 | 427 | 919 |
| South Africa | 338 | 339 | 348 | 446 | 482 | 804 |
| Nigeria | 461 | 452 | 542 | 646 | 614 | 766 |
| All Other Countries | 9,245 | 10,026 | 13,662 | 15,654 | 13,422 | 14,022 |
| Total | 67,015 | 72,788 | 85,134 | 96,140 | 94,701 | 107,767 |
| 1 This table includes PPSN allocations to foreign nationals of all ages and is sorted in descending order of allocations in 2016. | ||||||
Data sources
This analysis is based on three data sources:
The variables used were the date the PPSN was assigned, the nationality at that time, the age at that time, sex, and the NACE category of economic activity.
For some persons, employment is recorded before the year the PPSN was issued. These numbers, which are relatively small, have been blanked in the headline table for clarity but are included in the detailed tables.
Some pensioners are included in the P35 data, but their numbers are small. Also, self-employed persons are excluded from the data from 2005 if they had no P35 self-employed income and if they had no other work as an employee.
Data analysis from 2002 (Social Welfare activity) and 2005 (Employment activity) are updated annually and available through the CSO Statbank at:
http://www.cso.ie/shorturl.aspx/213
Nationality groups
The category EU15 excl Ireland & the UK consists of Germany, France, Italy, the Netherlands, Belgium, Luxembourg, Denmark, Greece, Spain, Portugal, Austria, Finland and Sweden
The category EU15 to EU25 states consists of the states that joined the EU on 1 May 2004: the Czech Republic, Cyprus, Estonia, Latvia, Lithuania, Hungary, Malta, Poland, Slovenia and Slovakia.
The category EU25 to EU28 states consist of Romania and Bulgaria, who joined the EU on 1 January 2007 and Croatia on 1 July 2013.
Definitions
Employment Activity: Employment activity for the purposes of this release includes any person appearing on the Revenue P35 files, or in the employment file within the Central Records System of the Department of Employment Affairs and Social Protection. The level of activity can vary from having worked one day in the year to working full-time throughout the year.
Social Welfare Activity: Social welfare activity for the purposes of this release includes any person appearing in the claims files within the Central Records System of the Department of Employment Affairs and Social Protection. This includes one off claims, such as dental and optical benefits, and ongoing claims, such as Jobseeker’s Benefit or Jobseeker's Allowance, pensions and illness payments.
NACE Rev 2: Employment is classified using NACE Rev 2. Where persons had two or more employments during a year, they were allocated to the NACE category with the largest number of weeks of employment.
Background to the study
The results presented in this release are based on a data-matching exercise undertaken by the CSO, for statistical purposes, of administrative data from of the Department of Employment Affairs and Social Protection and the Revenue Commissioners. This study was undertaken in line with the Statistics Act, 1993, and the CSO Data Protocol governing data matching exercises undertaken by the CSO (available at http://www.cso.ie/en/aboutus/csodataprotocol/ ).
 Hide Background Notes
Scan the QR code below to view this release online or go to
http://www.cso.ie/en/releasesandpublications/er/fnaes/foreignnationalsppsnallocationsemploymentandsocialwelfareactivity2016/
 Show Table 1 Employment and Social Welfare activity of foreign nationals aged 15 years and over, by broad nationality group and year of entry
 Hide Table 1 Employment and Social Welfare activity of foreign nationals aged 15 years and over, by broad nationality group and year of entry