
This release was compiled during the COVID-19 pandemic. The volume of road fuel clearances have been adversely impacted by the COVID-19 pandemic particularly in April and May 2020, and again in January and February 2021.
| Table A: Excise Clearance Volumes for Road Fuels August 2021 | ||||
| % Change | ||||
| Period | 2021/2019 | 2021/2020 | ||
| Unleaded Petrol | Autodiesel | Unleaded Petrol | Autodiesel | |
| January | -54% | -32% | -51% | -34% |
| February | -46% | -24% | -45% | -28% |
| March | -36% | -15% | -18% | -7% |
| April | -28% | -13% | +157% | +96% |
| May | -24% | -11% | +50% | +47% |
| June | -9% | +2% | +36% | +23% |
| July | -10% | -1% | +7% | +5% |
| August | -13% | -3% | +3% | +5% |
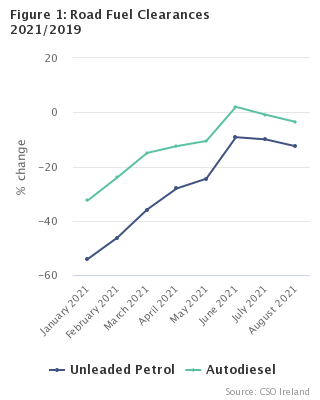
Clearances of autodiesel in August 2021 were 3% lower than in August 2019 (see Table A). Clearances of autodiesel were also 5% higher than the level in August 2020 (see Table 1A).
There was an increase of 3% for clearances of petrol in August 2021 compared with the levels in August 2020 (see Table 1B). August 2021 petrol clearance volumes were 13% below August 2019 (see Table A and Figure 1). Figure 1 shows the previously increasing trend appears to have levelled out over the summer months, with petrol down 54% in January 2021 compared with January 2019; down 46% in February; down 36% in March; down 28% in April; down 24% in May; down 9% in June and down 10% in July 2021 compared with the respective months in 2019 (see Figure 1 and Table A).
Clearances of kerosene (mainly used as a home heating fuel) in August 2021 were 34% higher than in August 2020 (see Table 1D). Excise clearances of marked gas oil in August 2021 were 13% higher than in August 2020, with volumes being the highest for the month of August since 2013 (see Table 1C). Marked gas oil is used for off-road purposes such as agriculture and heating of larger buildings.
Tables 3A to 3D and Figure 4 show trends in the Wholesale Price Index for selected fuels. Table 4 and Figure 5 show trends in the monthly mean temperature at Dublin Airport.
|
The data used in this statistical release mainly relate to Revenue Commissioners monthly excise clearance volumes. The use of transport fuels such as autodiesel and unleaded petrol are less seasonal than the use of home heating fuels. Price changes, exceptionally cold weather, and storage capacity (home heating oil tanks) can all combine to create marked variations in the monthly clearances. Levels of activity in the economy and changes in the vehicle fleet composition can affect the volume of clearances of road fuels. |
| August 2011 | August 2012 | August 2013 | August 2014 | August 2015 | August 2016 | August 2017 | August 2018 | August 2019 | August 2020 | August 2021 | |
| Autodiesel | 226 | 221 | 234 | 238 | 263 | 284 | 299 | 307 | 308 | 283 | 297 |
| Petrol | 158 | 144 | 134 | 122 | 117 | 111 | 103 | 93 | 90 | 76 | 78 |
| MGO | 104 | 97 | 102 | 84 | 88 | 93 | 89 | 93 | 90 | 89 | 101 |
| Kerosene | 43 | 43 | 32 | 39 | 58 | 39 | 53 | 48 | 46 | 30 | 40 |
| Autodiesel | Unleaded Petrol | Marked Gas Oil | Kerosene | |
| 2000 | 1.992 | 1.954 | 1.596 | 0.789 |
| 2001 | 2.15 | 2.044 | 1.63 | 0.95 |
| 2002 | 2.263 | 2.12 | 1.547 | 0.939 |
| 2003 | 2.299 | 2.114 | 1.565 | 0.983 |
| 2004 | 2.444 | 2.188 | 1.581 | 1.053 |
| 2005 | 2.596 | 2.264 | 1.645 | 1.081 |
| 2006 | 2.836 | 2.33 | 1.653 | 1.126 |
| 2007 | 3.025 | 2.377 | 1.592 | 1.124 |
| 2008 | 2.96 | 2.31 | 1.503 | 1.202 |
| 2009 | 2.714 | 2.117 | 1.274 | 1.253 |
| 2010 | 2.56 | 1.93 | 1.226 | 1.329 |
| 2011 | 2.563 | 1.829 | 1.155 | 1.051 |
| 2012 | 2.548 | 1.668 | 1.126 | 0.898 |
| 2013 | 2.676 | 1.568 | 1.102 | 0.906 |
| 2014 | 2.847 | 1.483 | 0.998 | 0.857 |
| 2015 | 3.106 | 1.416 | 1.014 | 1.015 |
| 2016 | 3.33 | 1.335 | 1.044 | 1.05 |
| 2017 | 3.571 | 1.25 | 1.055 | 1.089 |
| 2018 | 3.589 | 1.098 | 1.087 | 1.149 |
| 2019 | 3.679 | 1.043 | 1.093 | 1.068 |
| 2020 | 3.167 | 0.773 | 1.134 | 1.257 |
| Petrol | Autodiesel | Gas oil (other than autodiesel) | Fuel oil | |
| January 2010 | 93.5 | 94.3 | 91.4 | 97 |
| February 2010 | 93.7 | 94.1 | 90.7 | 97.1 |
| March 2010 | 98 | 98.2 | 96.9 | 101.2 |
| April 2010 | 97.8 | 99.3 | 97.6 | 102.2 |
| May 2010 | 98.4 | 100.4 | 102.6 | 107.9 |
| June 2010 | 98 | 100.1 | 102.6 | 107.2 |
| July 2010 | 96.9 | 99.5 | 100.7 | 106.9 |
| August 2010 | 96.5 | 99.2 | 100.1 | 106.6 |
| September 2010 | 97.6 | 100.6 | 101.7 | 106.8 |
| October 2010 | 97 | 100 | 100.7 | 105.8 |
| November 2010 | 98.2 | 102.2 | 103.7 | 107.7 |
| December 2010 | 102.4 | 105.1 | 105.3 | 108.3 |
| January 2011 | 103.8 | 107.1 | 109.1 | 111.9 |
| February 2011 | 103.3 | 108.3 | 109.7 | 112.4 |
| March 2011 | 107 | 111.5 | 114.2 | 118.7 |
| April 2011 | 108.5 | 111.9 | 115.3 | 121.3 |
| May 2011 | 108.2 | 108.8 | 110.9 | 116.8 |
| June 2011 | 106.6 | 110.3 | 113 | 119.2 |
| July 2011 | 108.3 | 111.2 | 114.4 | 120.9 |
| August 2011 | 105.3 | 108.2 | 110.4 | 116 |
| September 2011 | 107.8 | 110.8 | 113.7 | 119.1 |
| October 2011 | 106.6 | 110.9 | 113.2 | 119.6 |
| November 2011 | 105.9 | 113.6 | 117.3 | 122.5 |
| December 2011 | 106.7 | 112.6 | 115.8 | 121.9 |
| January 2012 | 109.2 | 115.9 | 119.7 | 126.2 |
| February 2012 | 110.5 | 114.9 | 119.4 | 126.3 |
| March 2012 | 114 | 117 | 121.4 | 129.6 |
| April 2012 | 114.9 | 115.9 | 119.9 | 128.3 |
| May 2012 | 111.1 | 114.5 | 119.3 | 126.1 |
| June 2012 | 108.5 | 111.3 | 115 | 122.2 |
| July 2012 | 110.8 | 114 | 117.8 | 124.4 |
| August 2012 | 114.6 | 117.6 | 122.2 | 130 |
| September 2012 | 113.9 | 117.7 | 123.6 | 130.1 |
| October 2012 | 113.9 | 118.1 | 124.5 | 126.4 |
| November 2012 | 109.7 | 115.1 | 120.3 | 123 |
| December 2012 | 108.2 | 113.1 | 118.5 | 120.9 |
| January 2013 | 109.5 | 114.2 | 119.3 | 123.1 |
| February 2013 | 111.8 | 115.7 | 122.3 | 125.9 |
| March 2013 | 109.8 | 114 | 118.9 | 122.8 |
| April 2013 | 108.6 | 111.7 | 116.1 | 120.3 |
| May 2013 | 108.7 | 111.5 | 116 | 120.6 |
| June 2013 | 108.6 | 111.4 | 115.8 | 120.4 |
| July 2013 | 111.1 | 113.3 | 118.6 | 121.4 |
| August 2013 | 110.4 | 113 | 118.3 | 120.7 |
| September 2013 | 108.6 | 114.3 | 119.7 | 121.9 |
| October 2013 | 107.4 | 112.5 | 117.7 | 119.9 |
| November 2013 | 107 | 111.2 | 116.4 | 118.9 |
| December 2013 | 106.1 | 111.4 | 116.5 | 119.4 |
| January 2014 | 106.6 | 110.7 | 115.9 | 118.1 |
| February 2014 | 107.6 | 111.4 | 116.7 | 120.6 |
| March 2014 | 107 | 109.7 | 114.3 | 119.2 |
| April 2014 | 108.7 | 110.6 | 115.2 | 119.6 |
| May 2014 | 108.2 | 110.5 | 115.7 | 119.9 |
| June 2014 | 110.1 | 111.2 | 116.3 | 121.5 |
| July 2014 | 110 | 110.7 | 115.8 | 120.7 |
| August 2014 | 107.8 | 110.6 | 115.6 | 118 |
| September 2014 | 108.1 | 110.1 | 114.9 | 117.9 |
| October 2014 | 105.5 | 108 | 111.4 | 113.9 |
| November 2014 | 103.3 | 106.9 | 109.5 | 110.1 |
| December 2014 | 96.7 | 101.1 | 101.7 | 102.4 |
| January 2015 | 93.4 | 96.7 | 95.4 | 96 |
| February 2015 | 98.6 | 102 | 103.6 | 103.8 |
| March 2015 | 102 | 103 | 104.1 | 103.6 |
| April 2015 | 102.6 | 102.9 | 104.9 | 105.7 |
| May 2015 | 104.1 | 104.6 | 107.5 | 108 |
| June 2015 | 106 | 103.9 | 105.8 | 106.3 |
| July 2015 | 106 | 101.8 | 102.7 | 103.2 |
| August 2015 | 101 | 98.8 | 98.3 | 97.4 |
| September 2015 | 97.5 | 98.2 | 97 | 95.2 |
| October 2015 | 96.6 | 97.8 | 96.4 | 96.2 |
| November 2015 | 97 | 97.8 | 96.4 | 95.5 |
| December 2015 | 95.3 | 92.5 | 87.9 | 89.1 |
| January 2016 | 93.2 | 90.2 | 85.5 | 85.7 |
| February 2016 | 90.7 | 89.2 | 84.5 | 85.9 |
| March 2016 | 94 | 93.6 | 90.3 | 90.5 |
| April 2016 | 96.6 | 93.6 | 90.6 | 91.3 |
| May 2016 | 97.2 | 95.4 | 93.4 | 93.9 |
| June 2016 | 97.8 | 97.5 | 96.2 | 97 |
| July 2016 | 96.4 | 96.3 | 94.8 | 96.7 |
| August 2016 | 94.9 | 95.2 | 93 | 95.8 |
| September 2016 | 96.4 | 96.2 | 94.2 | 97.4 |
| October 2016 | 97.7 | 99.3 | 97.9 | 100.9 |
| November 2016 | 95.2 | 96.8 | 94.4 | 97.3 |
| December 2016 | 99.3 | 101.5 | 100.9 | 104.5 |
| January 2017 | 101.5 | 101.7 | 100.9 | 106.5 |
| February 2017 | 102.2 | 101.8 | 101.6 | 105.3 |
| March 2017 | 99.3 | 99.7 | 98.5 | 101.8 |
| April 2017 | 102.4 | 101.9 | 101.8 | 105.6 |
| May 2017 | 100.1 | 98.9 | 97.3 | 102 |
| June 2017 | 98.5 | 97.1 | 94.8 | 100.3 |
| July 2017 | 98.4 | 97.7 | 95.3 | 99.7 |
| August 2017 | 99.1 | 98.7 | 96.4 | 100.2 |
| September 2017 | 100.1 | 100.3 | 99.7 | 102.6 |
| October 2017 | 99 | 100.5 | 99.1 | 103.1 |
| November 2017 | 101.4 | 101.9 | 102.7 | 106.7 |
| December 2017 | 100.7 | 102.2 | 102.6 | 105.1 |
| January 2018 | 101.6 | 103.7 | 105.2 | 108 |
| February 2018 | 99.5 | 100.1 | 99.9 | 103.8 |
| March 2018 | 99.4 | 100.8 | 100.8 | 104.4 |
| April 2018 | 102.8 | 104 | 104.2 | 108.2 |
| May 2018 | 105.7 | 107.1 | 107.9 | 112.9 |
| June 2018 | 105.3 | 106.9 | 107.6 | 112.7 |
| July 2018 | 105.4 | 106.3 | 106.8 | 112.5 |
| August 2018 | 106.3 | 107.2 | 108.4 | 112.9 |
| September 2018 | 106.2 | 108.4 | 109.5 | 113.9 |
| October 2018 | 105.2 | 111.1 | 112.3 | 117.3 |
| November 2018 | 102.7 | 109.5 | 108.6 | 113.2 |
| December 2018 | 99.5 | 104.6 | 102.5 | 107.1 |
| January 2019 | 99.7 | 104.5 | 102.8 | 107.3 |
| February 2019 | 100.6 | 106.1 | 105.4 | 110.4 |
| March 2019 | 102.2 | 106.2 | 106 | 111.6 |
| April 2019 | 107 | 107.2 | 107.7 | 112.4 |
| May 2019 | 107.4 | 107.7 | 108 | 112.6 |
| June 2019 | 103 | 103.7 | 102.6 | 108.2 |
| July 2019 | 106.2 | 106.2 | 105.8 | 112.9 |
| August 2019 | 103.7 | 105 | 104 | 108.8 |
| September 2019 | 102.7 | 106.3 | 105.4 | 109.2 |
| October 2019 | 103.9 | 107.4 | 105.5 | 109.3 |
| November 2019 | 104.7 | 107.2 | 105.2 | 109.3 |
| December 2019 | 104.6 | 107.5 | 105.4 | 109 |
| January 2020 | 105.2 | 108.1 | 104.9 | 108.8 |
| February 2020 | 103.2 | 105 | 101.4 | 105.5 |
| March 2020 | 92.4 | 96.1 | 89 | 95.2 |
| April 2020 | 88.5 | 92.7 | 84.5 | 87.4 |
| May 2020 | 91.2 | 91.6 | 83.7 | 88 |
| June 2020 | 94.7 | 95.3 | 88.7 | 94 |
| July 2020 | 96.4 | 96.8 | 89.9 | 95.8 |
| August 2020 | 97.3 | 97.7 | 91.6 | 95.3 |
| September 2020 | 96 | 94.8 | 87.4 | 92.8 |
| October 2020 | 97.7 | 97.1 | 88.9 | 94.5 |
| November 2020 | 96.8 | 98.2 | 90 | 96 |
| December 2020 | 98.1 | 100.2 | 92.9 | 98.2 |
| January 2021 | 100.7 | 102.3 | 95.9 | 100.8 |
| February 2021 | 102.2 | 104.8 | 98.6 | 103 |
| March 2021 | 106.5 | 107.3 | 101.8 | 105.3 |
| April 2021 | 105.9 | 105.9 | 99.8 | 104 |
| May 2021 | 107.4 | 108.6 | 103.7 | 107.2 |
| June 2021 | 108.5 | 110.1 | 105.7 | 108.5 |
| July 2021 | 111 | 111.4 | 108.2 | 110.6 |
| August 2021 | 110.9 | 110.9 | 106.8 | 109.5 |
| X-axis label | Monthly Mean Temperature |
|---|---|
| January 2010 | 1.7 |
| February 2010 | 2.3 |
| March 2010 | 4.9 |
| April 2010 | 7.7 |
| May 2010 | 9.6 |
| June 2010 | 14.1 |
| July 2010 | 16 |
| August 2010 | 13.9 |
| September 2010 | 13.1 |
| October 2010 | 10.1 |
| November 2010 | 5.2 |
| December 2010 | -0.1 |
| January 2011 | 3.6 |
| February 2011 | 7 |
| March 2011 | 5.8 |
| April 2011 | 10.1 |
| May 2011 | 11.4 |
| June 2011 | 12 |
| July 2011 | 13.8 |
| August 2011 | 13.5 |
| September 2011 | 14 |
| October 2011 | 11.8 |
| November 2011 | 9.7 |
| December 2011 | 5.8 |
| January 2012 | 6.1 |
| February 2012 | 6.6 |
| March 2012 | 8 |
| April 2012 | 6.6 |
| May 2012 | 9.8 |
| June 2012 | 12.7 |
| July 2012 | 14 |
| August 2012 | 15.3 |
| September 2012 | 12 |
| October 2012 | 8.4 |
| November 2012 | 6.4 |
| December 2012 | 5.4 |
| January 2013 | 4.9 |
| February 2013 | 4.2 |
| March 2013 | 3.1 |
| April 2013 | 6.8 |
| May 2013 | 10 |
| June 2013 | 12.7 |
| July 2013 | 16.7 |
| August 2013 | 15.6 |
| September 2013 | 13 |
| October 2013 | 11.7 |
| November 2013 | 6.3 |
| December 2013 | 6.9 |
| January 2014 | 5.7 |
| February 2014 | 5.6 |
| March 2014 | 6.8 |
| April 2014 | 8.9 |
| May 2014 | 11.3 |
| June 2014 | 13.6 |
| July 2014 | 15.8 |
| August 2014 | 13.9 |
| September 2014 | 13.1 |
| October 2014 | 10.9 |
| November 2014 | 7.7 |
| December 2014 | 5.4 |
| January 2015 | 4.7 |
| February 2015 | 4 |
| March 2015 | 5.8 |
| April 2015 | 7.4 |
| May 2015 | 9.6 |
| June 2015 | 12.9 |
| July 2015 | 13.8 |
| August 2015 | 14 |
| September 2015 | 11.8 |
| October 2015 | 10.2 |
| November 2015 | 8.7 |
| December 2015 | 8.6 |
| January 2016 | 5.7 |
| February 2016 | 4.4 |
| March 2016 | 5.9 |
| April 2016 | 6.2 |
| May 2016 | 11.1 |
| June 2016 | 14 |
| July 2016 | 15.7 |
| August 2016 | 15.4 |
| September 2016 | 14.3 |
| October 2016 | 10.4 |
| November 2016 | 5.6 |
| December 2016 | 6.7 |
| January 2017 | 5.7 |
| February 2017 | 6.2 |
| March 2017 | 7.7 |
| April 2017 | 8 |
| May 2017 | 11.6 |
| June 2017 | 14.4 |
| July 2017 | 15 |
| August 2017 | 14.6 |
| September 2017 | 12.4 |
| October 2017 | 11.2 |
| November 2017 | 6.5 |
| December 2017 | 5.3 |
| January 2018 | 5.3 |
| February 2018 | 3.4 |
| March 2018 | 4.3 |
| April 2018 | 8.1 |
| May 2018 | 11.4 |
| June 2018 | 14.5 |
| July 2018 | 16.1 |
| August 2018 | 15.3 |
| September 2018 | 12.2 |
| October 2018 | 9.3 |
| November 2018 | 8.2 |
| December 2018 | 7.7 |
| January 2019 | 5.1 |
| February 2019 | 7 |
| March 2019 | 7.3 |
| April 2019 | 8 |
| May 2019 | 10.2 |
| June 2019 | 12.5 |
| July 2019 | 15.9 |
| August 2019 | 15.4 |
| September 2019 | 13 |
| October 2019 | 9.1 |
| November 2019 | 6 |
| December 2019 | 5.9 |
| January 2020 | 6.3 |
| February 2020 | 5.8 |
| March 2020 | 5.8 |
| April 2020 | 8.5 |
| May 2020 | 10.9 |
| June 2020 | 13.4 |
| July 2020 | 14.4 |
| August 2020 | 14.7 |
| September 2020 | 12.8 |
| October 2020 | 9.5 |
| November 2020 | 8.2 |
| December 2020 | 4.9 |
| January 2021 | 3.9 |
| February 2021 | 6.2 |
| March 2021 | 7.2 |
| April 2021 | 5.6 |
| May 2021 | 9.2 |
| June 2021 | 13.7 |
| July 2021 | 16.1 |
| August 2021 | 14.7 |
| Table 1A Monthly Excise Clearances of Autodiesel (Million litres) August 2021 | ||||||||||||
| Million litres | ||||||||||||
| Year | January | February | March | April | May | June | July | August | September | October | November | December |
| 2000 | 178 | 161 | 175 | 158 | 178 | 173 | 160 | 175 | 179 | 165 | 175 | 115 |
| 2001 | 198 | 164 | 178 | 170 | 188 | 174 | 181 | 182 | 182 | 188 | 192 | 153 |
| 2002 | 211 | 178 | 187 | 189 | 199 | 176 | 198 | 192 | 195 | 200 | 199 | 139 |
| 2003 | 219 | 180 | 190 | 187 | 200 | 187 | 200 | 183 | 202 | 213 | 197 | 140 |
| 2004 | 233 | 186 | 218 | 208 | 209 | 204 | 210 | 205 | 212 | 213 | 213 | 133 |
| 2005 | 253 | 198 | 223 | 218 | 221 | 227 | 209 | 233 | 226 | 211 | 232 | 142 |
| 2006 | 288 | 221 | 246 | 231 | 248 | 243 | 229 | 239 | 236 | 249 | 257 | 150 |
| 2007 | 313 | 237 | 258 | 243 | 277 | 253 | 252 | 259 | 249 | 281 | 264 | 139 |
| 2008 | 322 | 254 | 241 | 279 | 257 | 235 | 243 | 240 | 248 | 260 | 234 | 147 |
| 2009 | 290 | 208 | 238 | 227 | 230 | 225 | 244 | 214 | 241 | 230 | 217 | 150 |
| 2010 | 249 | 203 | 230 | 224 | 212 | 224 | 215 | 219 | 225 | 222 | 231 | 105 |
| 2011 | 271 | 208 | 217 | 213 | 216 | 214 | 211 | 226 | 211 | 214 | 226 | 137 |
| 2012 | 296 | 198 | 216 | 206 | 225 | 199 | 211 | 221 | 210 | 226 | 224 | 117 |
| 2013 | 290 | 199 | 225 | 224 | 240 | 212 | 229 | 234 | 221 | 239 | 233 | 130 |
| 2014 | 311 | 212 | 238 | 239 | 249 | 227 | 246 | 238 | 247 | 255 | 236 | 148 |
| 2015 | 329 | 233 | 256 | 259 | 264 | 259 | 273 | 263 | 270 | 277 | 260 | 165 |
| 2016 | 353 | 265 | 279 | 287 | 281 | 281 | 270 | 284 | 292 | 277 | 292 | 170 |
| 2017 | 365 | 264 | 305 | 276 | 307 | 296 | 288 | 299 | 293 | 293 | 301 | 283 |
| 2018 | 281 | 277 | 292 | 293 | 324 | 301 | 299 | 307 | 295 | 320 | 313 | 287 |
| 2019 | 292 | 281 | 308 | 312 | 325 | 298 | 316 | 308 | 308 | 323 | 316 | 293 |
| 2020 | 298 | 295 | 281 | 139 | 198 | 248 | 297 | 283 | 300 | 280 | 262 | 286 |
| 2021 | 197 | 213 | 262 | 273 | 290 | 304 | 313 | 297 | ||||
| Table 1B Monthly Excise Clearances of Unleaded Petrol (Million litres) August 2021 | ||||||||||||
| Million litres | ||||||||||||
| Year | January | February | March | April | May | June | July | August | September | October | November | December |
| 2000 | 180 | 148 | 168 | 159 | 175 | 170 | 166 | 181 | 168 | 160 | 164 | 113 |
| 2001 | 198 | 150 | 165 | 167 | 184 | 171 | 178 | 193 | 165 | 179 | 177 | 117 |
| 2002 | 211 | 158 | 178 | 178 | 194 | 163 | 191 | 191 | 174 | 186 | 174 | 123 |
| 2003 | 217 | 159 | 172 | 180 | 189 | 170 | 189 | 182 | 179 | 187 | 167 | 123 |
| 2004 | 228 | 164 | 190 | 192 | 183 | 184 | 194 | 186 | 186 | 182 | 183 | 117 |
| 2005 | 242 | 167 | 198 | 193 | 192 | 197 | 195 | 204 | 191 | 184 | 190 | 109 |
| 2006 | 265 | 175 | 204 | 193 | 202 | 199 | 190 | 203 | 195 | 196 | 197 | 111 |
| 2007 | 277 | 182 | 200 | 195 | 211 | 199 | 198 | 214 | 191 | 214 | 194 | 102 |
| 2008 | 277 | 189 | 191 | 206 | 204 | 187 | 193 | 190 | 193 | 202 | 180 | 99 |
| 2009 | 255 | 161 | 180 | 179 | 187 | 177 | 186 | 172 | 183 | 177 | 164 | 96 |
| 2010 | 211 | 153 | 175 | 171 | 167 | 170 | 165 | 165 | 165 | 163 | 160 | 64 |
| 2011 | 207 | 147 | 160 | 159 | 154 | 154 | 153 | 158 | 148 | 147 | 151 | 92 |
| 2012 | 197 | 135 | 150 | 138 | 151 | 139 | 137 | 144 | 133 | 141 | 135 | 68 |
| 2013 | 192 | 119 | 136 | 132 | 143 | 125 | 135 | 134 | 124 | 133 | 127 | 68 |
| 2014 | 180 | 111 | 127 | 128 | 133 | 118 | 129 | 122 | 125 | 127 | 114 | 69 |
| 2015 | 169 | 109 | 119 | 123 | 122 | 117 | 125 | 117 | 118 | 120 | 110 | 67 |
| 2016 | 160 | 108 | 116 | 116 | 115 | 112 | 110 | 111 | 112 | 105 | 108 | 60 |
| 2017 | 143 | 93 | 109 | 102 | 109 | 103 | 100 | 103 | 97 | 96 | 98 | 96 |
| 2018 | 88 | 86 | 88 | 92 | 103 | 95 | 92 | 93 | 87 | 94 | 90 | 89 |
| 2019 | 83 | 78 | 88 | 91 | 93 | 87 | 92 | 90 | 87 | 87 | 84 | 83 |
| 2020 | 79 | 77 | 68 | 25 | 47 | 58 | 78 | 76 | 77 | 62 | 53 | 72 |
| 2021 | 38 | 42 | 56 | 65 | 70 | 79 | 83 | 78 | ||||
| Table 1C Monthly Excise Clearances of Marked Gas Oil (Million litres) August 2021 | ||||||||||||
| Million litres | ||||||||||||
| Year | January | February | March | April | May | June | July | August | September | October | November | December |
| 2000 | 179 | 153 | 155 | 132 | 124 | 125 | 102 | 113 | 151 | 116 | 144 | 104 |
| 2001 | 192 | 155 | 160 | 137 | 126 | 118 | 114 | 114 | 166 | 131 | 116 | 101 |
| 2002 | 159 | 129 | 146 | 138 | 107 | 103 | 123 | 121 | 138 | 136 | 129 | 117 |
| 2003 | 176 | 152 | 136 | 113 | 111 | 118 | 108 | 130 | 123 | 142 | 140 | 115 |
| 2004 | 175 | 147 | 159 | 132 | 129 | 113 | 117 | 127 | 127 | 138 | 129 | 89 |
| 2005 | 173 | 147 | 161 | 131 | 120 | 140 | 111 | 154 | 140 | 120 | 148 | 100 |
| 2006 | 224 | 152 | 162 | 140 | 121 | 138 | 121 | 125 | 111 | 132 | 146 | 80 |
| 2007 | 182 | 144 | 146 | 126 | 135 | 126 | 116 | 132 | 131 | 149 | 142 | 64 |
| 2008 | 168 | 145 | 125 | 157 | 125 | 117 | 109 | 99 | 131 | 126 | 120 | 82 |
| 2009 | 118 | 117 | 127 | 114 | 93 | 112 | 92 | 92 | 118 | 103 | 98 | 90 |
| 2010 | 133 | 112 | 121 | 148 | 71 | 98 | 83 | 104 | 90 | 94 | 106 | 65 |
| 2011 | 136 | 101 | 106 | 88 | 94 | 99 | 65 | 104 | 101 | 95 | 100 | 66 |
| 2012 | 108 | 91 | 102 | 104 | 90 | 91 | 94 | 97 | 95 | 97 | 98 | 59 |
| 2013 | 113 | 89 | 102 | 101 | 93 | 100 | 100 | 102 | 86 | 87 | 82 | 47 |
| 2014 | 104 | 71 | 87 | 90 | 82 | 100 | 91 | 84 | 85 | 81 | 73 | 49 |
| 2015 | 108 | 91 | 82 | 81 | 77 | 98 | 85 | 88 | 92 | 85 | 68 | 59 |
| 2016 | 104 | 86 | 90 | 87 | 88 | 96 | 85 | 93 | 81 | 86 | 85 | 63 |
| 2017 | 100 | 75 | 89 | 83 | 96 | 100 | 95 | 89 | 83 | 82 | 87 | 76 |
| 2018 | 78 | 86 | 95 | 86 | 110 | 110 | 90 | 93 | 89 | 98 | 82 | 70 |
| 2019 | 90 | 81 | 85 | 92 | 104 | 101 | 106 | 90 | 93 | 88 | 86 | 76 |
| 2020 | 88 | 82 | 112 | 101 | 103 | 92 | 97 | 89 | 103 | 97 | 86 | 84 |
| 2021 | 81 | 83 | 104 | 113 | 84 | 116 | 106 | 101 | ||||
| Table 1D Monthly Excise Clearances of Kerosene (Million litres) August 2021 | ||||||||||||
| Million litres | ||||||||||||
| Year | January | February | March | April | May | June | July | August | September | October | November | December |
| 2000 | 111 | 83 | 89 | 55 | 87 | 28 | 30 | 34 | 45 | 55 | 90 | 81 |
| 2001 | 108 | 125 | 109 | 106 | 47 | 43 | 30 | 26 | 63 | 97 | 106 | 90 |
| 2002 | 119 | 102 | 96 | 70 | 51 | 40 | 43 | 44 | 83 | 90 | 91 | 109 |
| 2003 | 152 | 124 | 90 | 55 | 63 | 35 | 40 | 35 | 66 | 108 | 104 | 111 |
| 2004 | 168 | 116 | 134 | 92 | 61 | 22 | 34 | 61 | 72 | 115 | 88 | 90 |
| 2005 | 183 | 136 | 122 | 80 | 56 | 45 | 25 | 86 | 85 | 63 | 125 | 74 |
| 2006 | 193 | 134 | 150 | 100 | 55 | 28 | 29 | 56 | 54 | 111 | 125 | 92 |
| 2007 | 208 | 146 | 128 | 56 | 50 | 37 | 42 | 45 | 89 | 127 | 124 | 70 |
| 2008 | 188 | 147 | 127 | 108 | 38 | 27 | 35 | 40 | 82 | 141 | 139 | 131 |
| 2009 | 246 | 150 | 129 | 97 | 60 | 24 | 57 | 44 | 69 | 109 | 136 | 132 |
| 2010 | 243 | 190 | 156 | 137 | 26 | 14 | 17 | 34 | 73 | 107 | 173 | 160 |
| 2011 | 209 | 125 | 87 | 39 | 42 | 32 | 27 | 43 | 92 | 110 | 120 | 124 |
| 2012 | 109 | 94 | 67 | 86 | 40 | 25 | 29 | 43 | 67 | 121 | 128 | 89 |
| 2013 | 145 | 98 | 118 | 77 | 48 | 18 | 15 | 32 | 70 | 99 | 123 | 64 |
| 2014 | 142 | 108 | 84 | 53 | 35 | 19 | 15 | 39 | 49 | 110 | 111 | 92 |
| 2015 | 188 | 124 | 86 | 54 | 47 | 28 | 27 | 58 | 117 | 109 | 86 | 91 |
| 2016 | 171 | 144 | 112 | 85 | 41 | 23 | 22 | 39 | 80 | 103 | 142 | 88 |
| 2017 | 148 | 145 | 101 | 63 | 40 | 29 | 29 | 53 | 105 | 99 | 128 | 148 |
| 2018 | 121 | 155 | 198 | 73 | 42 | 16 | 14 | 48 | 94 | 128 | 118 | 142 |
| 2019 | 130 | 100 | 100 | 80 | 44 | 39 | 23 | 46 | 114 | 124 | 118 | 150 |
| 2020 | 124 | 137 | 186 | 143 | 108 | 43 | 32 | 30 | 73 | 119 | 101 | 162 |
| 2021 | 151 | 141 | 109 | 101 | 58 | 28 | 22 | 40 | ||||
| Table 2 Annual Excise Clearances 2000-2020 | |||||||
| Million litres | |||||||
| Year | Autodiesel | Unleaded Petrol | Marked Gas Oil | Kerosene | Auto LPG | Other LPG | Fuel Oil |
| 2000 | 1,992 | 1,954 | 1,596 | 789 | 4 | 285 | 1,443 |
| 2001 | 2,150 | 2,044 | 1,630 | 950 | 3 | 277 | 1,597 |
| 2002 | 2,263 | 2,120 | 1,547 | 939 | 2 | 267 | 1,200 |
| 2003 | 2,299 | 2,114 | 1,565 | 983 | 2 | 273 | 809 |
| 2004 | 2,444 | 2,188 | 1,581 | 1,053 | 2 | 279 | 950 |
| 2005 | 2,596 | 2,264 | 1,645 | 1,081 | 2 | 277 | 929 |
| 2006 | 2,836 | 2,330 | 1,653 | 1,126 | 2 | 276 | 884 |
| 2007 | 3,025 | 2,377 | 1,592 | 1,124 | 1 | 279 | 569 |
| 2008 | 2,960 | 2,310 | 1,503 | 1,202 | 1 | 242 | 423 |
| 2009 | 2,714 | 2,117 | 1,274 | 1,253 | 1 | 153 | 141 |
| 2010 | 2,560 | 1,930 | 1,226 | 1,329 | 0 | 165 | 130 |
| 2011 | 2,563 | 1,829 | 1,155 | 1,051 | 0 | 147 | 85 |
| 2012 | 2,548 | 1,668 | 1,126 | 898 | 1 | 195 | 77 |
| 2013 | 2,676 | 1,568 | 1,102 | 906 | 2 | 226 | 83 |
| 2014 | 2,847 | 1,483 | 998 | 857 | 4 | 227 | 64 |
| 2015 | 3,106 | 1,416 | 1,014 | 1,015 | 4 | 245 | 61 |
| 2016 | 3,330 | 1,335 | 1,044 | 1,050 | 4 | 263 | 56 |
| 2017 | 3,571 | 1,250 | 1,055 | 1,089 | 4 | 298 | 58 |
| 2018 | 3,589 | 1,098 | 1,087 | 1,149 | 3 | 325 | 49 |
| 2019 | 3,679 | 1,043 | 1,093 | 1,068 | 3 | 330 | 45 |
| 2020 | 3,167 | 773 | 1,134 | 1,257 | 2 | 327 | 41 |
| Table 3A Wholesale Price Index for Autodiesel August 2021 | ||||||||||||
| 2015=100 | ||||||||||||
| Year | January | February | March | April | May | June | July | August | September | October | November | December |
| 2000 | 58.4 | 58.2 | 59.5 | 59.4 | 58.8 | 59.8 | 61.0 | 61.2 | 68.4 | 68.8 | 68.8 | 62.1 |
| 2001 | 57.9 | 53.2 | 54.4 | 54.3 | 54.7 | 55.1 | 55.9 | 54.2 | 53.9 | 54.0 | 53.1 | 54.7 |
| 2002 | 54.4 | 54.4 | 55.6 | 57.7 | 58.1 | 58.1 | 57.2 | 57.2 | 57.9 | 59.1 | 59.3 | 59.5 |
| 2003 | 61.2 | 63.1 | 65.8 | 59.7 | 59.8 | 57.2 | 58.1 | 58.4 | 59.8 | 58.8 | 60.3 | 63.8 |
| 2004 | 63.6 | 63.6 | 63.6 | 65.2 | 68.5 | 68.2 | 67.6 | 69.3 | 72.3 | 74.6 | 74.6 | 73.5 |
| 2005 | 73.0 | 71.4 | 75.5 | 79.0 | 76.6 | 79.1 | 82.9 | 82.4 | 85.0 | 87.6 | 82.1 | 81.4 |
| 2006 | 82.2 | 82.9 | 84.1 | 85.5 | 86.1 | 86.1 | 87.0 | 87.8 | 84.4 | 83.3 | 83.2 | 83.3 |
| 2007 | 81.1 | 81.3 | 83.3 | 84.5 | 84.9 | 86.6 | 87.2 | 88.1 | 89.4 | 90.1 | 95.6 | 93.7 |
| 2008 | 96.1 | 95.3 | 100.4 | 101.7 | 110.4 | 114.3 | 115.4 | 105.1 | 105.1 | 96.1 | 90.1 | 80.0 |
| 2009 | 79.9 | 78.6 | 75.8 | 83.6 | 84.4 | 88.7 | 83.9 | 89.7 | 87.0 | 88.7 | 89.7 | 90.5 |
| 2010 | 94.3 | 94.1 | 98.2 | 99.3 | 100.4 | 100.1 | 99.5 | 99.2 | 100.6 | 100.0 | 102.2 | 105.1 |
| 2011 | 107.1 | 108.3 | 111.5 | 111.9 | 108.8 | 110.3 | 111.2 | 108.2 | 110.8 | 110.9 | 113.6 | 112.6 |
| 2012 | 115.9 | 114.9 | 117.0 | 115.9 | 114.5 | 111.3 | 114.0 | 117.6 | 117.7 | 118.1 | 115.1 | 113.1 |
| 2013 | 114.2 | 115.7 | 114.0 | 111.7 | 111.5 | 111.4 | 113.3 | 113.0 | 114.3 | 112.5 | 111.2 | 111.4 |
| 2014 | 110.7 | 111.4 | 109.7 | 110.6 | 110.5 | 111.2 | 110.7 | 110.6 | 110.1 | 108.0 | 106.9 | 101.1 |
| 2015 | 96.7 | 102.0 | 103.0 | 102.9 | 104.6 | 103.9 | 101.8 | 98.8 | 98.2 | 97.8 | 97.8 | 92.5 |
| 2016 | 90.2 | 89.2 | 93.6 | 93.6 | 95.4 | 97.5 | 96.3 | 95.2 | 96.2 | 99.3 | 96.8 | 101.5 |
| 2017 | 101.7 | 101.8 | 99.7 | 101.9 | 98.9 | 97.1 | 97.7 | 98.7 | 100.3 | 100.5 | 101.9 | 102.2 |
| 2018 | 103.7 | 100.1 | 100.8 | 104.0 | 107.1 | 106.9 | 106.3 | 107.2 | 108.4 | 111.1 | 109.5 | 104.6 |
| 2019 | 104.5 | 106.1 | 106.2 | 107.2 | 107.7 | 103.7 | 106.2 | 105.0 | 106.3 | 107.4 | 107.2 | 107.5 |
| 2020 | 108.1 | 105.0 | 96.1 | 92.7 | 91.6 | 95.3 | 96.8 | 97.7 | 94.8 | 97.1 | 98.2 | 100.2 |
| 2021 | 102.3 | 104.8 | 107.3 | 105.9 | 108.6 | 110.1 | 111.4 | 110.9 | ||||
| Table 3B Wholesale Price Index for Petrol August 2021 | ||||||||||||
| 2015=100 | ||||||||||||
| Year | January | February | March | April | May | June | July | August | September | October | November | December |
| 2000 | 53.4 | 54.1 | 56.7 | 58.1 | 56.7 | 60.2 | 62.5 | 60.1 | 60.6 | 61.2 | 61.2 | 58.1 |
| 2001 | 54.6 | 55.0 | 56.5 | 56.9 | 61.4 | 62.5 | 59.0 | 55.5 | 55.5 | 54.9 | 52.5 | 55.0 |
| 2002 | 54.7 | 55.6 | 56.4 | 59.6 | 60.6 | 60.1 | 59.3 | 59.6 | 60.1 | 60.6 | 60.5 | 58.4 |
| 2003 | 59.8 | 62.3 | 62.4 | 60.4 | 59.6 | 57.8 | 58.4 | 59.4 | 61.0 | 59.4 | 59.0 | 62.0 |
| 2004 | 61.5 | 62.7 | 63.6 | 64.4 | 69.9 | 69.4 | 67.2 | 68.9 | 68.6 | 69.7 | 68.3 | 66.3 |
| 2005 | 64.1 | 66.6 | 68.0 | 72.6 | 71.1 | 72.0 | 76.7 | 77.8 | 82.2 | 79.3 | 74.9 | 74.8 |
| 2006 | 77.4 | 76.1 | 76.1 | 81.9 | 82.9 | 83.0 | 85.8 | 84.6 | 75.9 | 75.2 | 75.5 | 76.4 |
| 2007 | 75.1 | 75.4 | 79.6 | 81.5 | 84.1 | 85.7 | 86.2 | 83.1 | 83.2 | 83.1 | 88.0 | 85.3 |
| 2008 | 88.6 | 86.2 | 87.9 | 88.4 | 93.6 | 97.8 | 98.4 | 93.1 | 94.0 | 89.1 | 83.1 | 76.0 |
| 2009 | 77.0 | 81.8 | 78.7 | 83.1 | 86.5 | 90.7 | 86.0 | 91.1 | 87.6 | 87.6 | 89.9 | 90.3 |
| 2010 | 93.5 | 93.7 | 98.0 | 97.8 | 98.4 | 98.0 | 96.9 | 96.5 | 97.6 | 97.0 | 98.2 | 102.4 |
| 2011 | 103.8 | 103.3 | 107.0 | 108.5 | 108.2 | 106.6 | 108.3 | 105.3 | 107.8 | 106.6 | 105.9 | 106.7 |
| 2012 | 109.2 | 110.5 | 114.0 | 114.9 | 111.1 | 108.5 | 110.8 | 114.6 | 113.9 | 113.9 | 109.7 | 108.2 |
| 2013 | 109.5 | 111.8 | 109.8 | 108.6 | 108.7 | 108.6 | 111.1 | 110.4 | 108.6 | 107.4 | 107.0 | 106.1 |
| 2014 | 106.6 | 107.6 | 107.0 | 108.7 | 108.2 | 110.1 | 110.0 | 107.8 | 108.1 | 105.5 | 103.3 | 96.7 |
| 2015 | 93.4 | 98.6 | 102.0 | 102.6 | 104.1 | 106.0 | 106.0 | 101.0 | 97.5 | 96.6 | 97.0 | 95.3 |
| 2016 | 93.2 | 90.7 | 94.0 | 96.6 | 97.2 | 97.8 | 96.4 | 94.9 | 96.4 | 97.7 | 95.2 | 99.3 |
| 2017 | 101.5 | 102.2 | 99.3 | 102.4 | 100.1 | 98.5 | 98.4 | 99.1 | 100.1 | 99.0 | 101.4 | 100.7 |
| 2018 | 101.6 | 99.5 | 99.4 | 102.8 | 105.7 | 105.3 | 105.4 | 106.3 | 106.2 | 105.2 | 102.7 | 99.5 |
| 2019 | 99.7 | 100.6 | 102.2 | 107.0 | 107.4 | 103.0 | 106.2 | 103.7 | 102.7 | 103.9 | 104.7 | 104.6 |
| 2020 | 105.2 | 103.2 | 92.4 | 88.5 | 91.2 | 94.7 | 96.4 | 97.3 | 96.0 | 97.7 | 96.8 | 98.1 |
| 2021 | 100.7 | 102.2 | 106.5 | 105.9 | 107.4 | 108.5 | 111.0 | 110.9 | ||||
| Table 3C Wholesale Price Index for Gas Oil August 2021 | ||||||||||||
| 2015=100 | ||||||||||||
| Year | January | February | March | April | May | June | July | August | September | October | November | December |
| 2000 | 49.3 | 51.0 | 53.7 | 52.3 | 51.2 | 54.1 | 54.7 | 56.5 | 67.7 | 67.8 | 67.6 | 67.4 |
| 2001 | 60.3 | 55.5 | 56.1 | 54.6 | 56.2 | 58.0 | 58.5 | 56.5 | 55.9 | 54.4 | 53.0 | 49.8 |
| 2002 | 48.3 | 48.6 | 49.9 | 52.1 | 53.0 | 52.5 | 51.5 | 52.1 | 53.8 | 55.7 | 56.5 | 54.5 |
| 2003 | 57.8 | 60.7 | 65.8 | 53.2 | 53.2 | 51.9 | 52.5 | 53.5 | 54.9 | 53.7 | 55.7 | 55.6 |
| 2004 | 55.3 | 53.8 | 54.7 | 57.6 | 61.3 | 61.8 | 61.4 | 64.5 | 67.8 | 69.7 | 69.9 | 65.0 |
| 2005 | 65.4 | 66.7 | 74.2 | 78.8 | 73.1 | 76.9 | 85.1 | 83.9 | 89.5 | 91.8 | 84.8 | 83.5 |
| 2006 | 85.8 | 86.7 | 88.3 | 90.2 | 90.9 | 91.0 | 91.9 | 93.0 | 89.6 | 84.3 | 83.1 | 82.8 |
| 2007 | 79.4 | 80.3 | 82.3 | 85.1 | 85.0 | 87.2 | 88.2 | 90.2 | 93.7 | 93.0 | 101.7 | 99.5 |
| 2008 | 104.4 | 102.2 | 108.8 | 109.4 | 125.1 | 131.5 | 133.7 | 119.2 | 118.7 | 103.6 | 95.8 | 78.6 |
| 2009 | 78.7 | 76.4 | 71.8 | 78.4 | 79.6 | 85.5 | 79.3 | 87.9 | 84.3 | 86.7 | 89.1 | 88.6 |
| 2010 | 91.4 | 90.7 | 96.9 | 97.6 | 102.6 | 102.6 | 100.7 | 100.1 | 101.7 | 100.7 | 103.7 | 105.3 |
| 2011 | 109.1 | 109.7 | 114.2 | 115.3 | 110.9 | 113.0 | 114.4 | 110.4 | 113.7 | 113.2 | 117.3 | 115.8 |
| 2012 | 119.7 | 119.4 | 121.4 | 119.9 | 119.3 | 115.0 | 117.8 | 122.2 | 123.6 | 124.5 | 120.3 | 118.5 |
| 2013 | 119.3 | 122.3 | 118.9 | 116.1 | 116.0 | 115.8 | 118.6 | 118.3 | 119.7 | 117.7 | 116.4 | 116.5 |
| 2014 | 115.9 | 116.7 | 114.3 | 115.2 | 115.7 | 116.3 | 115.8 | 115.6 | 114.9 | 111.4 | 109.5 | 101.7 |
| 2015 | 95.4 | 103.6 | 104.1 | 104.9 | 107.5 | 105.8 | 102.7 | 98.3 | 97.0 | 96.4 | 96.4 | 87.9 |
| 2016 | 85.5 | 84.5 | 90.3 | 90.6 | 93.4 | 96.2 | 94.8 | 93.0 | 94.2 | 97.9 | 94.4 | 100.9 |
| 2017 | 100.9 | 101.6 | 98.5 | 101.8 | 97.3 | 94.8 | 95.3 | 96.4 | 99.7 | 99.1 | 102.7 | 102.6 |
| 2018 | 105.2 | 99.9 | 100.8 | 104.2 | 107.9 | 107.6 | 106.8 | 108.4 | 109.5 | 112.3 | 108.6 | 102.5 |
| 2019 | 102.8 | 105.4 | 106.0 | 107.7 | 108.0 | 102.6 | 105.8 | 104.0 | 105.4 | 105.5 | 105.2 | 105.4 |
| 2020 | 104.9 | 101.4 | 89.0 | 84.5 | 83.7 | 88.7 | 89.9 | 91.6 | 87.4 | 88.9 | 90.0 | 92.9 |
| 2021 | 95.9 | 98.6 | 101.8 | 99.8 | 103.7 | 105.7 | 108.2 | 106.8 | ||||
| Table 3D Wholesale Price Index for Fuel Oil August 2021 | ||||||||||||
| 2015=100 | ||||||||||||
| Year | January | February | March | April | May | June | July | August | September | October | November | December |
| 2000 | 47.6 | 48.2 | 53.0 | 51.8 | 47.7 | 49.1 | 52.0 | 52.1 | 56.6 | 58.1 | 60.5 | 58.6 |
| 2001 | 54.2 | 50.0 | 50.7 | 50.7 | 50.8 | 52.4 | 52.8 | 52.6 | 52.6 | 52.4 | 50.4 | 48.2 |
| 2002 | 48.5 | 48.6 | 49.8 | 51.2 | 52.2 | 52.6 | 51.8 | 51.8 | 52.8 | 55.6 | 55.0 | 53.1 |
| 2003 | 55.6 | 59.8 | 63.5 | 52.1 | 52.1 | 51.2 | 53.2 | 55.2 | 55.4 | 53.3 | 53.4 | 53.7 |
| 2004 | 51.4 | 50.4 | 50.6 | 52.1 | 55.2 | 56.4 | 56.0 | 56.4 | 56.4 | 56.6 | 57.0 | 53.3 |
| 2005 | 54.4 | 57.2 | 61.4 | 66.4 | 63.7 | 65.6 | 71.9 | 74.3 | 79.6 | 77.4 | 75.8 | 75.6 |
| 2006 | 76.8 | 81.8 | 80.8 | 81.2 | 80.7 | 80.0 | 80.5 | 82.2 | 78.7 | 73.9 | 73.7 | 72.4 |
| 2007 | 70.8 | 72.0 | 73.3 | 76.0 | 77.0 | 81.0 | 82.9 | 86.2 | 87.3 | 88.6 | 97.4 | 95.3 |
| 2008 | 99.8 | 95.4 | 97.4 | 99.1 | 108.3 | 114.2 | 122.2 | 113.9 | 111.5 | 98.1 | 88.4 | 74.8 |
| 2009 | 74.8 | 77.1 | 74.3 | 79.6 | 83.5 | 89.8 | 84.7 | 93.5 | 90.8 | 92.1 | 96.1 | 95.3 |
| 2010 | 97.0 | 97.1 | 101.2 | 102.2 | 107.9 | 107.2 | 106.9 | 106.6 | 106.8 | 105.8 | 107.7 | 108.3 |
| 2011 | 111.9 | 112.4 | 118.7 | 121.3 | 116.8 | 119.2 | 120.9 | 116.0 | 119.1 | 119.6 | 122.5 | 121.9 |
| 2012 | 126.2 | 126.3 | 129.6 | 128.3 | 126.1 | 122.2 | 124.4 | 130.0 | 130.1 | 126.4 | 123.0 | 120.9 |
| 2013 | 123.1 | 125.9 | 122.8 | 120.3 | 120.6 | 120.4 | 121.4 | 120.7 | 121.9 | 119.9 | 118.9 | 119.4 |
| 2014 | 118.1 | 120.6 | 119.2 | 119.6 | 119.9 | 121.5 | 120.7 | 118.0 | 117.9 | 113.9 | 110.1 | 102.4 |
| 2015 | 96.0 | 103.8 | 103.6 | 105.7 | 108.0 | 106.3 | 103.2 | 97.4 | 95.2 | 96.2 | 95.5 | 89.1 |
| 2016 | 85.7 | 85.9 | 90.5 | 91.3 | 93.9 | 97.0 | 96.7 | 95.8 | 97.4 | 100.9 | 97.3 | 104.5 |
| 2017 | 106.5 | 105.3 | 101.8 | 105.6 | 102.0 | 100.3 | 99.7 | 100.2 | 102.6 | 103.1 | 106.7 | 105.1 |
| 2018 | 108.0 | 103.8 | 104.4 | 108.2 | 112.9 | 112.7 | 112.5 | 112.9 | 113.9 | 117.3 | 113.2 | 107.1 |
| 2019 | 107.3 | 110.4 | 111.6 | 112.4 | 112.6 | 108.2 | 112.9 | 108.8 | 109.2 | 109.3 | 109.3 | 109.0 |
| 2020 | 108.8 | 105.5 | 95.2 | 87.4 | 88.0 | 94.0 | 95.8 | 95.3 | 92.8 | 94.5 | 96.0 | 98.2 |
| 2021 | 100.8 | 103.0 | 105.3 | 104.0 | 107.2 | 108.5 | 110.6 | 109.5 | ||||
| Table 4 Met Eireann Monthly Mean Temperature for Dublin Airport 2000-2021 | ||||||||||||
| Centigrade | ||||||||||||
| Year | January | February | March | April | May | June | July | August | September | October | November | December |
| 2000 | 4.9 | 6.1 | 7.3 | 6.4 | 10.5 | 13.3 | 14.6 | 15.1 | 13.2 | 9.3 | 6.0 | 5.3 |
| 2001 | 3.6 | 4.3 | 5.0 | 7.2 | 11.4 | 12.8 | 15.1 | 14.9 | 12.8 | 12.2 | 7.8 | 4.6 |
| 2002 | 6.8 | 6.4 | 7.2 | 8.1 | 10.9 | 13.1 | 14.4 | 15.0 | 12.5 | 9.5 | 8.4 | 6.4 |
| 2003 | 5.1 | 4.8 | 6.8 | 8.9 | 10.9 | 13.9 | 16.2 | 15.8 | 13.5 | 9.0 | 7.9 | 5.2 |
| 2004 | 5.4 | 4.9 | 6.5 | 8.7 | 10.8 | 14.5 | 14.4 | 15.5 | 13.6 | 9.2 | 8.0 | 6.4 |
| 2005 | 6.7 | 4.8 | 7.6 | 8.0 | 10.1 | 14.5 | 15.5 | 15.2 | 13.7 | 11.6 | 6.5 | 5.8 |
| 2006 | 5.6 | 5.0 | 5.5 | 8.0 | 10.8 | 14.6 | 16.9 | 15.2 | 14.7 | 11.6 | 7.6 | 6.6 |
| 2007 | 6.7 | 5.9 | 6.4 | 10.6 | 10.8 | 13.0 | 14.2 | 14.6 | 13.0 | 11.0 | 8.3 | 6.3 |
| 2008 | 6.4 | 5.8 | 6.0 | 7.6 | 11.6 | 12.8 | 14.8 | 15.2 | 12.4 | 8.9 | 6.9 | 4.4 |
| 2009 | 4.3 | 5.1 | 6.7 | 8.3 | 10.9 | 13.2 | 14.9 | 15.3 | 12.5 | 11.1 | 7.4 | 3.6 |
| 2010 | 1.7 | 2.3 | 4.9 | 7.7 | 9.6 | 14.1 | 16.0 | 13.9 | 13.1 | 10.1 | 5.2 | -0.1 |
| 2011 | 3.6 | 7.0 | 5.8 | 10.1 | 11.4 | 12.0 | 13.8 | 13.5 | 14.0 | 11.8 | 9.7 | 5.8 |
| 2012 | 6.1 | 6.6 | 8.0 | 6.6 | 9.8 | 12.7 | 14.0 | 15.3 | 12.0 | 8.4 | 6.4 | 5.4 |
| 2013 | 4.9 | 4.2 | 3.1 | 6.8 | 10.0 | 12.7 | 16.7 | 15.6 | 13.0 | 11.7 | 6.3 | 6.9 |
| 2014 | 5.7 | 5.6 | 6.8 | 8.9 | 11.3 | 13.6 | 15.8 | 13.9 | 13.1 | 10.9 | 7.7 | 5.4 |
| 2015 | 4.7 | 4.0 | 5.8 | 7.4 | 9.6 | 12.9 | 13.8 | 14.0 | 11.8 | 10.2 | 8.7 | 8.6 |
| 2016 | 5.7 | 4.4 | 5.9 | 6.2 | 11.1 | 14.0 | 15.7 | 15.4 | 14.3 | 10.4 | 5.6 | 6.7 |
| 2017 | 5.7 | 6.2 | 7.7 | 8.0 | 11.6 | 14.4 | 15.0 | 14.6 | 12.4 | 11.2 | 6.5 | 5.3 |
| 2018 | 5.3 | 3.4 | 4.3 | 8.1 | 11.4 | 14.5 | 16.1 | 15.3 | 12.2 | 9.3 | 8.2 | 7.7 |
| 2019 | 5.1 | 7.0 | 7.3 | 8.0 | 10.2 | 12.5 | 15.9 | 15.4 | 13.0 | 9.1 | 6.0 | 5.9 |
| 2020 | 6.3 | 5.8 | 5.8 | 8.5 | 10.9 | 13.4 | 14.4 | 14.7 | 12.8 | 9.5 | 8.2 | 4.9 |
| 2021 | 3.9 | 6.2 | 7.2 | 5.6 | 9.2 | 13.7 | 16.1 | 14.7 | ||||
Clearances reflect the duty paid amounts of oil removed from tax warehouses. Clearances data provide a proxy for sales and the associated level of consumption but do not reflect actual consumption per se. First, clearances relate to Irish duty paid product. They do not include consumption on which Irish taxes have not been paid. Second, clearances reflect the timing of withdrawals of product from warehouses by manufacturers rather than the timing of consumption.
Excise duties are indirect taxes on the sale or use of specific products e.g. alcohol, tobacco, and mineral oils. They are usually applied as an amount per quantity of the product. The Revenue Commissioners collect statistics on the volumes of fuel clearances covered by excise taxes. These monthly statistics show trends such as increased clearances of heating oils in unusually cold spells and reductions in clearances of road fuels in a period of restricted movement such as that resulting from Covid-19. This release includes information on monthly wholesale price indices for fuels and monthly mean temperature for Dublin Airport as an aid to users in understanding the trends.
EU legislation on excise duties was largely prompted by the launch of the Single Market in 1993. EU legislation was adopted to ensure that excise duties for certain products were applied in the same way and to the same products throughout the Single Market, and that Member States applied at least a minimum rate of excise duty. All revenue from excise duties goes entirely to the Member States.
Monthly excise clearances data were obtained directly from Revenue. Revenue publish annual excise clearances data at https://www.revenue.ie/en/corporate/information-about-revenue/statistics/excise/receipts-volume-and-price/excise-receipts-commodity.aspx.
Excise duty on mineral oils is currently paid to the exchequer when the oils are removed from bonded warehouses. Current excise rates including carbon taxes are given in the table below in euro per thousand litres for the fuels most relevant for this release.
| Fuel | Rate per 1000 litres |
| Autodiesel | €515.38 |
| Unleaded petrol | €619.36 |
| Marked gas oil | €117.78 |
| Kerosene | €65.74 |
| Auto LPG | €106.07 |
| Other LPG | €42.48 |
| Heavy fuel oil non-propellant | €95.05 |
| Heavy fuel oil for navigation | €515.38 |
NORA’s function is to arrange for the holding of national strategic oil stocks for supply in an emergency. NORA’s ongoing activities are partially funded by a levy imposed on disposals of oil products. The levy is paid by oil marketing companies and oil consumers on their relevant disposals of petroleum products in the State. Such companies are obliged to submit monthly reports to the Department of the Environment, Climate and Communications. NORA publish monthly statistics that are broadly consistent with the excise clearances but there are differences in coverage. The NORA statistics are available at https://www.nora.ie/statistics.312.html
All data are subject to revision particularly the most recent months.
The Wholesale Price Index data have been revised. You can find more information at
Information Note - Wholesale Price Index Revision 2020
Wholesale prices for the bulk supply of different categories of petroleum fuels are obtained from the major fuel suppliers. All indices in the series are based on prices at the 15th of the month. Quarterly and annual indices are simple averages of the corresponding monthly indices.
Prices used in the compilation of the indices are:
The monthly mean temperature data for Dublin Airport were taken directly from the Met Éireann website, combining historical data from the time series at https://www.met.ie/climate/available-data/historical-data with monthly 2021 data from live tables at https://www.met.ie/climate/available-data/monthly-data
 Hide Background Notes
Scan the QR code below to view this release online or go to
http://www.cso.ie/en/releasesandpublications/er/fec/fuelexciseclearancesaugust2021/
 Show Table 1A: Monthly Excise Clearances of Autodiesel (Million litres) August 2021
 Hide Table 1A: Monthly Excise Clearances of Autodiesel (Million litres) August 2021